Structure analysis of high-pressure phase for skyrmion-hosting multiferroic Cu2OSeO3
Abstract
Cu2OSeO3 is known as a unique example of insulating multiferroic compounds with skyrmion spin texture, which is characterized by the chiral cubic crystal structure at ambient pressure. Recently, it has been reported that this compound shows pressure-induced structural transition with large enhancement of magnetic ordering temperature. In the present study, we have investigated the detailed crystal structure in the high pressure phase, by combining the synchrotron X-ray diffraction experiment with the diamond anvil cell and the analysis based on the genetic algorithm. Our resuts suggest that the original pyrochlore Cu network is sustained even after the structural transition, while the orientation of SeO3 molecule as well as the position of oxygen in the middle of Cu tetrahedra are significantly modified. The latter features may be the key for the reported enhancement of and associated stabilization of skyrmion phase at room temperature.
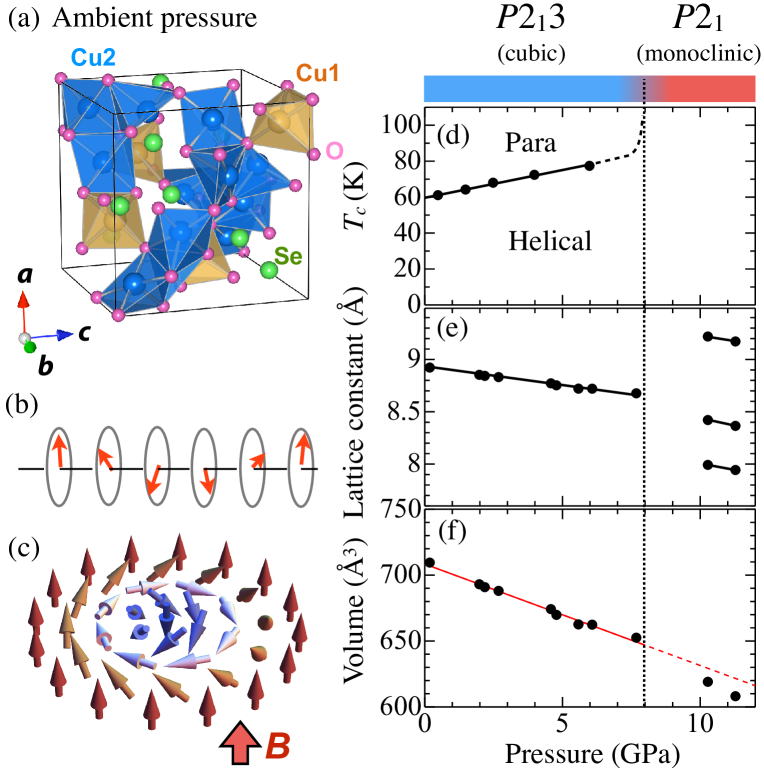
Magnetic skyrmion, i.e. a nanometric vortex-like swirling spin texture with topologically stable particle nature, has recently attracted much attention (Fig. 1(c))MnSi ; TEMFeCoSi ; SkXTheoryFirst ; SkXReviewFertTwo ; SkXReviewTokura . In metallic systems, the interaction between conduction electrons and skyrmion spin texture enables the the unique manner of skyrmion manipulation by electric currentCurrentControlNeutron ; CurrentControlLTEM ; CurrentControlBubble ; THE ; EmergentEfield . Because of its particle-like character, small size and electric controllability, magnetic skyrmion is now intensively studied as a candidate of high-density information carrier for next generation of magnetic information storage and processing devicesSkXReviewFertTwo ; SkLogic ; Neuromorphic .
Previously, the observation of magnetic skyrmions has mostly been reported for the noncentrosymmetric systems, where Dzyaloshinskii-Moriya (DM) interaction plays a key role on the stabilization of skyrmion spin textureMnSi ; TEMFeCoSi ; SkXReviewTokura ; Cu2OSeO3_Seki . The DM interaction usually favors the helical magnetic order as the ground state (Fig. 1(b)), while the application of magnetic field induces the formation of the triangular lattice of skyrmions (Fig. 1(c)). The magnetic moment at the core (edge) of each skyrmion is aligned antiparallel (parallel) to external magnetic field, and the in-plane component of magnetic moments show various swirling spin texture depending on the symmetry of underlying crystal latticeMnSi ; TEMFeCoSi ; Cu2OSeO3_Seki ; CoZnMn_First ; GaV4S8 ; Heusler .
So far, the most of skyrmion-hosting materials are reported to be metallic, while the electric-current-induced manipulation of skyrmions in such systems always causes the energy loss by the Joule heating. One potential solution is the employment of multiferroics, i.e. the insulating materials with both magnetic and dielectric orders. Our target compound Cu2OSeO3 is the first example of insulating materials to host magnetic skyrmionsCu2OSeO3_Seki , which is characterized by the chiral cubic crystal structure with space group at the ambient pressure (Fig. 1a)COSO_First ; COSO_Structure . In this compound, the skyrmion spin texture can magnetically induce electric polarization, through the symmetry reduction of charge distribution mediated by the spin-orbit interactionCu2OSeO3_Seki ; COSO_ME ; COSO_Dielectric ; COSO_DFT . By utilizing such a strong coupling between the skyrmion spin texture and electric polarization, the electric-field-induced creation, annihilationCOSO_Efield , and motionCOSO_Eresonance ; COSO_Erotation of skyrmions have successfully been demonstrated, which paves the way to the efficient skyrmion manipulation in insulators without Joule heat loss.
At this stage, the magnetic ordering temperature of such skyrmion-hosting multiferroics is relatively low ( K for Cu2OSeO3), and the further enhancement of their is highly demanded. Very recently, it has been reported that the application of hydrostatic pressure on Cu2OSeO3 leads to the structural phase transition with dramatic enhancement of , where the stabilization of skyrmions at room temperature has been proposedCOSO_PressurePNAS . However, the detailed crystal structure in the high pressure phase, as well as the origin of the reported enhancement of , remains yet to be resolved.
In this work, we studied the detailed crystal structure in the high pressure phase of Cu2OSeO3, through the synchrotron X-ray diffraction experiment with the diamond anvil cell and the associated analysis based on the genetic algorithm. Our results suggest that the original pyrochlore Cu network is sustained even after the structural transition, while the orientation of SeO3 molecule as well as the position of oxygen in the middle of Cu tetrahedra are significantly modified. The latter features may be the key for the reported enhancement of and associated stabilization of skyrmion phase at room temperature.
The powder and single crystals of Cu2OSeO3 were prepared as described elsewhereCOSO_InfraRed . The high pressure X-ray powder diffraction profiles were measured with the diamond anvil cell. The culet size of the anvils was 1.0 mm and the diameter of stainless steel gasket hole was approximately 500 m. The sample and several ruby small crystals with 2-3 m size, whose fluorescence spectra allows the accurate evaluation of pressure amplitude, were loaded in the hole sealed with 4:1 methanol-ethanol solution as the pressure medium. This pressure medium can avoid the solidification at least up to 11 GPa (in contrast with the silicon oil used in Ref. COSO_PressurePNAS that gradually solidifies above 3 GPa and causes inhomogeneous pressure distribution)PressureMedium , which suppresses the broadening of diffraction peaks and enables the detailed structural analysis. The ac magnetic susceptibility was measured with the cubic-anvil-type hydrostatic pressure cryostat.
| Se11 | -0.22072 | 0.71354 | 0.55357 |
|---|---|---|---|
| Se12 | 0.24609 | 0.77457 | -0.00505 |
| Se21 | 0.51611 | 0.94958 | 0.25412 |
| Se22 | 0.02207 | 0.55026 | 0.20258 |
| Cu11 | -0.12454 | 0.85879 | 0.17283 |
| Cu12 | 0.36539 | 0.63550 | 0.36025 |
| Cu21 | -0.10356 | 0.62461 | 0.88334 |
| Cu22 | -0.33948 | 0.87528 | 0.88710 |
| Cu23 | 0.61996 | 0.63833 | 0.13453 |
| Cu24 | 0.13201 | 0.65734 | 0.64996 |
| Cu25 | -0.14111 | 0.39966 | 0.59562 |
| Cu26 | -0.44802 | 0.37754 | 0.32787 |
| O11 | -0.02562 | 1.00764 | 0.26310 |
| O12 | 0.55591 | 0.55314 | 0.32849 |
| O21 | -0.01885 | 0.74687 | 0.54087 |
| O22 | -0.23087 | 0.53680 | 0.52306 |
| O23 | -0.24531 | 0.72596 | 0.74661 |
| O24 | 0.38624 | 0.65268 | 0.05586 |
| O25 | 0.33637 | 0.92839 | 0.05198 |
| O26 | 0.26723 | 0.77650 | -0.19908 |
| O31 | -0.19316 | 0.79565 | -0.05429 |
| O32 | 0.17319 | 0.75362 | 0.46386 |
| O41 | 0.54470 | 0.77658 | 0.29676 |
| O42 | 0.52574 | 0.51164 | 0.56858 |
| O43 | 0.71269 | 1.00208 | 0.24616 |
| O44 | 0.01704 | 0.72671 | 0.17187 |
| O45 | 0.15378 | 0.50186 | 0.06769 |
| O46 | 0.14829 | 0.54426 | 0.36320 |
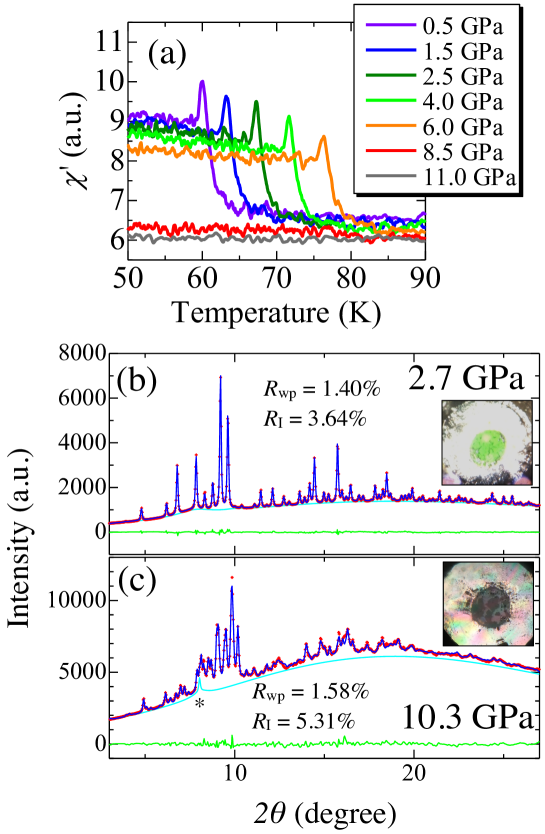
Figure 2(a) indicates the temperature dependence of ac magnetic susceptibility for Cu2OSeO3, measured under zero magnetic field with various amplitude of hydrostatic pressure . The profile shows a clear peak structure at K for 0.5 GPa, and the peak gradually shifts toward the higher temperature by increasing . Above 8 GPa, the peak structure suddenly disappears from the measured temperature range, which suggests the emergence of structural phase transition and associated large enhancement of as previously reportedCOSO_PressurePNAS ; COSO_PressureRonnow ; COSO_PressurePRB .
To investigate the pressure dependence of crystal structure, we have performed the synchrotron X-ray diffraction experiment at SPring-8 BL02B1 beamline with the diamond anvil cell. The wavelength of incident X-ray was 0.42734 Åwith 150 m beamsize. Figures 2(b) and (c) indicate the powder diffraction profiles measured at 2.7 GPa and 10.3 GPa, respectively. The former profile is well reproduced by the structure at the ambient pressure (Fig. 2(b)). We observed the discontinuous change of powder diffraction pattern above 8 GPa as shown in Fig. 2(c). The latter high pressure phase is confirmed to be stable at least up to 11.3 GPa, which is the maximum pressure of the present experimental condition. Sharp distinct Bragg peaks in the high angle region of (i.e. Å) were recognized in Fig 2(c). These were crucial for following structural analysis.
Since the original crystal unit cell of Cu2OSeO3 at the ambient pressure (Fig. 1(a)) contains 56 atomsCOSO_Structure , the structural analysis based on the powder diffraction pattern under the high pressure is challenging. To identify the reasonable structural model to reproduce the observed diffraction pattern, we performed the analysis based on the genetic algorithm (GA) GA , in which several basic molecular structural unit is assumed and their relative orientations and positions are explored as the fitting parameter. This approach has been particularly successful in the structural analysis of organic compounds, and the present Cu2OSeO3 containing the rigid SeO3 molecule with orbital can be an appropriate target. There are independent four SeO3 molecules, eight Cu atoms and four oxygen atoms in the crystallographic asymmetric unit. The number of degrees of freedom in one SeO3 molecule is 6, including three positional parameters and three orientation parameters. Each isolated atom is characterized by three positional parameters. Therefore, the total number of degrees of freedom became 59, because one positoinal parameter must be fixed in the case of a noncentrosymmetric space group. After the search of the candidate structure by the genetic algorithm, the additional rigid-body Rietveld analysisRietveld with bond length and angle restraints has been performed to refine the structural parameter. Finally, we obtained the atomic coordinates with the reliability factor and as summarized in Table 1 with the monoclinic space group . Similar Rietveld analysis has also been performed for various , and we obtained the pressure dependence of lattice constants and volume of crystallographic unit cell as shown in Figs. 1(e) and (f). As the pressure increases, the unit cell volume linearly decreases and then shows a discontinuous drop at the structural phase transition. During this process, the number of atoms in the unit cell remains unchanged.
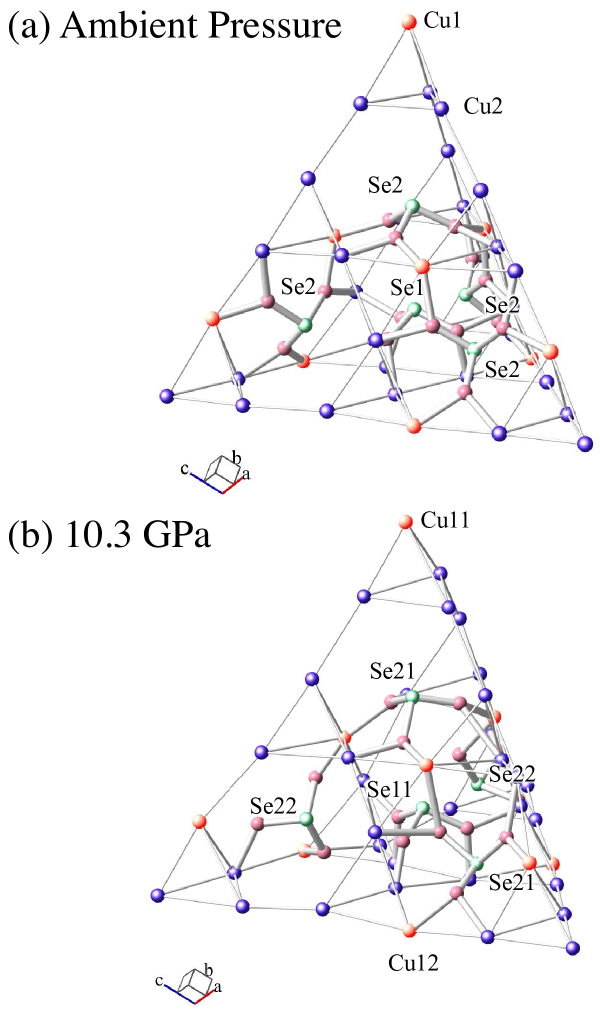
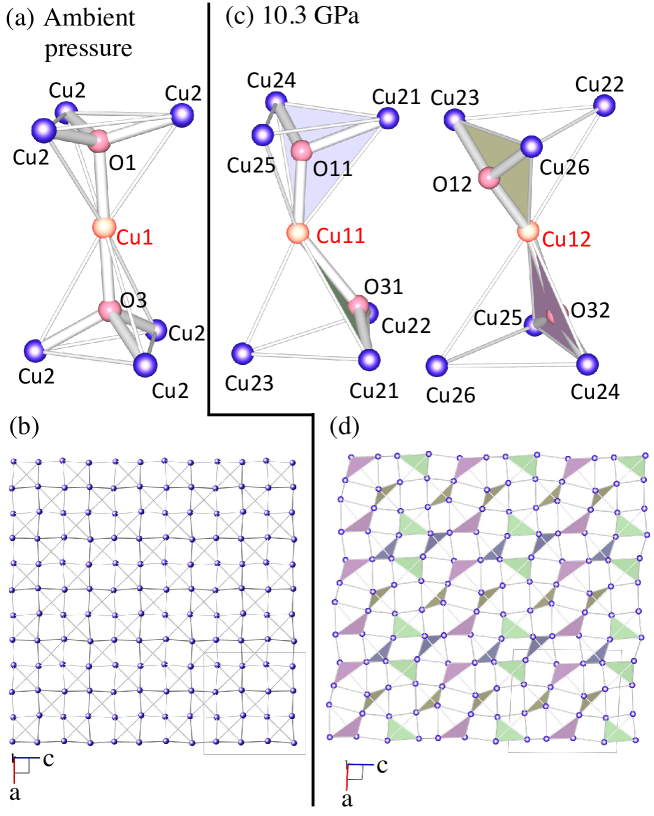
Figures 3(a) and (b) indicate the position of Cu2+ () magnetic ions and SeO3 molecules before and after the structural phase transition, respectively (Some oxygen atoms are not shown for clarity. The Cu frameworks viewed from the [010] direction are also indicated in Figs. 4(b) and (d)). In the original Cu2OSeO3 structure, Cu sites form a distorted pyrochlore lattice, which consists of the corner-shared Cu tetrahedra and large vacancy among them. We found that this Cu-pyrochlore framework is retained even in the high pressure phase, while its buckling manner is considerably modified (Figs. 4(b) and (d)). Here, the vacancy space is filled by the SeO3 molecule. The shrinkage of vacancy volume leads to the tilting of SeO3 orientation, which breaks the three-fold rotational symmetry in the system.
In the following, we discuss the origin of magnetic order and its pressure-induced modification in Cu2OSeO3. The original Cu2OSeO3 structure contains two distinctive Cu2+ sites surrounded by either a trigonal bipyramid or square pyramid of oxygen ligands (i.e. Cu1 and Cu2 sites, respectively) with the ratio of 1:3 (Fig. 1(a)). Here, the super-exchange interaction between the Cu1 and Cu2 is antiferromagnetic but the one between Cu2 ions is ferromagnetic, which stabilizes the three-up one-down type local ferrimagnetic orderCOSO_Dielectric ; COSO_Ferri . According to the previous calculation based on the density functional theory (DFT), a hole exists in the and orbitals for the Cu1 and Cu2 ions, respectively, and the sign of super-exchange interactions can be explained by the Kanamori-Goodenough rule with the Cu-O-Cu bonding angle close to 90 degreeCOSO_DFT . Here, the most important change upon the structural transition is the shift of the oxygen atom position, that was originally located at the center of Cu-tetrahedra (Fig. 4(a)). In the high pressure phase, one of the four Cu-O bonds is broken and the oxygen moves to the middle of a triangular Cu plaquette as shown in Fig. 4(c). Such an oxygen position shift within the Cu tetrahedron, as well as the tilting of SeO3 molecule whose oxygen atoms also contribute to the Cu-O-Cu super-exchange path (Fig. 3(b)), modifies the manner of crystal field splitting and associated orbital hybridization for each Cu-O-Cu bond, which would result in the dramatic change of magnetic interactions. Note that the original green transparent color of the sample (mainly reflecting the absorption by crystal field excitationCOSO_Faraday ) turns into the black opaque upon the structural transition (Figs. 2(b) and (c)), which also supports the modification of orbital character in Cu sites. Because of the complicated crystal structure in the high pressure phase, the quantitative evaluation of exchange amplitude for each path is not straightforward. In general, the largest magnitude of is obtained when transfer integral for the super-exchange path is maximized, and we naively expect that such a situation probably emerges here. To fully clarify the origin of reported enhancement of and skyrmion formation at room temprature, further DFT calculation based on the proposed crystal structure would be helpful.
In summary, we investigated the detailed crystal structure for the high pressure phase of skyrmion-hosting multiferroic Cu2OSeO3. Our analysis suggests that the tilting of SeO3 molecule, as well as the modification of oxygen position within the Cu tetrahedra, are the main features of the pressure-induced structural transition. The present results set a fundamental basis for better understanding of the magnetism in the high pressure phase, and may contribute to the further development of the general strategy to realize multiferroic skyrmions at room temperature.
The authors thank T. Arima for enlightening discussions and K. Sugimoto and H. Kasai for experimental and analytical help. This work was partly supported by Grants-In-Aid for Scientific Research (grant nos 18H03685, 20H00349, 19KK0132 and 20H04656) from JSPS, PRESTO (grant no. JPMJPR18L5) and CREST (grant no. JPMJCR1874) from JST, Asahi Glass Foundation and Murata Science Foundation. The synchrotron radiation experiments were performed with the approval of the Japan Synchrotron Radiation Research Institute (JASRI) (Proposal Nos. 2015A1573. 2016A0078).
References
- (1) S. Mühlbauer et al., Science 323, 915 (2009).
- (2) X. Z. Yu et al., Nature 465, 901 (2010).
- (3) U. K. Rößler et al., Nature 442, 797 (2006).
- (4) A. Fert, N. Reyren, V. Cros, Nat. Rev. Mater, 2, 17031 (2017).
- (5) N. Nagaosa, Y. Tokura, Nature Nanotech. 8, 899 (2013).
- (6) F. Jonietz et al., Science 330, 1648 (2010).
- (7) X. Z. Yu et al., Nature Comm. 3, 988 (2012).
- (8) W. Jiang et al., Science 349, 283 (2015).
- (9) A. Neubauer et al., Phys. Rev. Lett. 102, 186602 (2009).
- (10) T. Schulz et al., Nature Phys. 8, 301 (2012).
- (11) X. Zhang et al., Sci. Rep. 5, 9400 (2015).
- (12) K. M. Song et al., Nature Electronics 3, 148 (2020).
- (13) S. Seki, X. Z. Yu, S. Ishiwata, Y. Tokura, Science 336, 198 (2012).
- (14) Y. Tokunaga et al., Nature Comm. 6, 7638 (2015).
- (15) I. Kézsmárki et al., Nature Mater. 14, 1116 (2015).
- (16) A. K. Nayak et al., Nature 548, 561 (2017).
- (17) G. Meunier, M. Bertaud, J. Galy, J. Appl. Crystallogr. 9, 364 (1976).
- (18) H. Effenberger, F. Pertlik, Monatsch. Chem. 117, 887 (1986).
- (19) S. Seki, S. Ishiwata, Y. Tokura, Phys. Rev. B 86, 060403(R) (2012).
- (20) J-W. G. Bos et al., Phys. Rev. B 78, 094416 (2008).
- (21) J. H. Yang et al., Phys. Rev. Lett. 109, 107203 (2012).
- (22) Y. Okamura et al., Nature Comm. 7, 12669 (2016).
- (23) Y. Okamura et al., Nature Comm. 4, 2391 (2013).
- (24) J. S. White et al., Phys. Rev. Lett. 113, 107203 (2014).
- (25) L. Deng et al., Proc. Natl. Acad. Sci. 117, 8783 (2020).
- (26) K. H. Miller et al, Phys. Rev. B 82, 144107 (2010).
- (27) S. Klotz et al., J. Phys. D: Appl. Phys. 42, 075413 (2009).
- (28) I. Levatić et al., Sci. Rep. 6, 21347 (2016).
- (29) V. A. Sidorov et al., Phys. Rev. B 89, 100403(R) (2014).
- (30) E. Nishibori, T. Ogura, S. Aoyagi, M. Sakata., J. Appl. Cryst. 41, 292 (2008).
- (31) The Rietveld Method, R. A. Young (Oxford University Press, Oxford, 1993).
- (32) K. Kohn, J. Phys. Soc. Jpn. 42, 2065 (1977).
- (33) R. B. Versteeg et al., Phys. Rev. B 94, 094409 (2016).