Selective Conduction of Organic Molecules via Free-Standing Graphene
Abstract
A race is held between ten species of organic gas molecules on a graphene substrate driven by thermal gradients via molecular dynamics. Fast conduction of the molecules is observed with selectivity for aromatic compounds. This selectivity stems from the fact that the planar structure of the aromatic molecule helps keep a shorter distance to the substrate, which is the key to the driving force at the gas-solid interface. The drift velocity monotonically increases with decreasing molecule density, with no ballistic transport observable even for a single molecule. A non-linear regime is discovered for the conduction of benzene molecules under large thermal gradients. At low temperature, molecules formed aggregation and move collectively along specific path in the graphene substrate.
I Introduction
Directional transport of molecules is a central process for separation of chemicals Li et al. (2015), drug delivery Bianco et al. (2005), molecular machines Erbas-Cakmak et al. (2015), energy conversion and storage Park and Jung (2014), and so forth. Conduction of molecules can be realized via applying temperature gradients along which molecules drift. In liquid or gaseous mixtures, the driving force is known to stem from the difference in kinetic energy between the hot and the cold molecules Duhr and Braun (2006). However, the driving force of thermodiffusion at solid-phase interfaces is under debate. For instance, Barreiro et al. reported that motion of a gold cargo attached to a carbon nanotube (CNT) can be actuated by imposing a thermal gradient along the tube Barreiro et al. (2008). The underlying mechanism of the actuation was reported to be phononic excitations traveling from the hot to the cold region Guo and Guo (2013). Becton and Wang studied the motion of a nanoflake on a graphene sheet and reported that the driving force is a discrepancy in the kinetic energy across the temperature gradient Becton and Wang (2014). Panizon et al. measured a driving force independent of the local gradient magnitude on a gold cluster transmitted through scattering with flexural phonon waves in a graphene substrate Panizon et al. (2017).
Low-dimensional carbons have drawn considerable attention for nanoscale molecule transport thanks to their chemical inertness and peculiar structures Zhang et al. (2019); Sun et al. (2016). Spontaneous water conduction through a CNT channel was first reported in 2001 by Hummer et al. using molecular dynamics (MD) simulations Hummer et al. (2001). Fluid and solid transport through CNTs was experimentally observed in the following years Regan et al. (2004); Holt et al. (2006); Sun et al. (2006). Mass transport through CNTs by thermodiffusion was first reported by Schoen et al., who demonstrated via MD that motion of a gold nanoparticle can be induced on CNTs subjected to thermal gradients Schoen et al. (2006). This was later confirmed by a scanning electron microscopy experiment Barreiro et al. (2008). MD remains the state-of-the-art method to explore molecular transport at nanoscale numerically Leng et al. (2016); Panizon et al. (2017).
Most of previous works focus on the transport of solids by low-dimensional carbon nanostructures. In contrast, little is known about the conduction of gas molecules adsorbed on solid nanostructures Roos et al. (2011). Can organic molecules be conducted on two-dimension (2D) membranes like graphene? If so, what type of molecules will exhibit higher velocity, and where the driving force comes from? To address these questions and in view of the important implications of the transport of organic compounds for a wide range of applications, we simulate thermodiffusion of organic molecules adsorbed on a suspended graphene sheet subjected to a thermal gradient. The first race is run between ten different species of hydrocarbons via MD.
II Methods
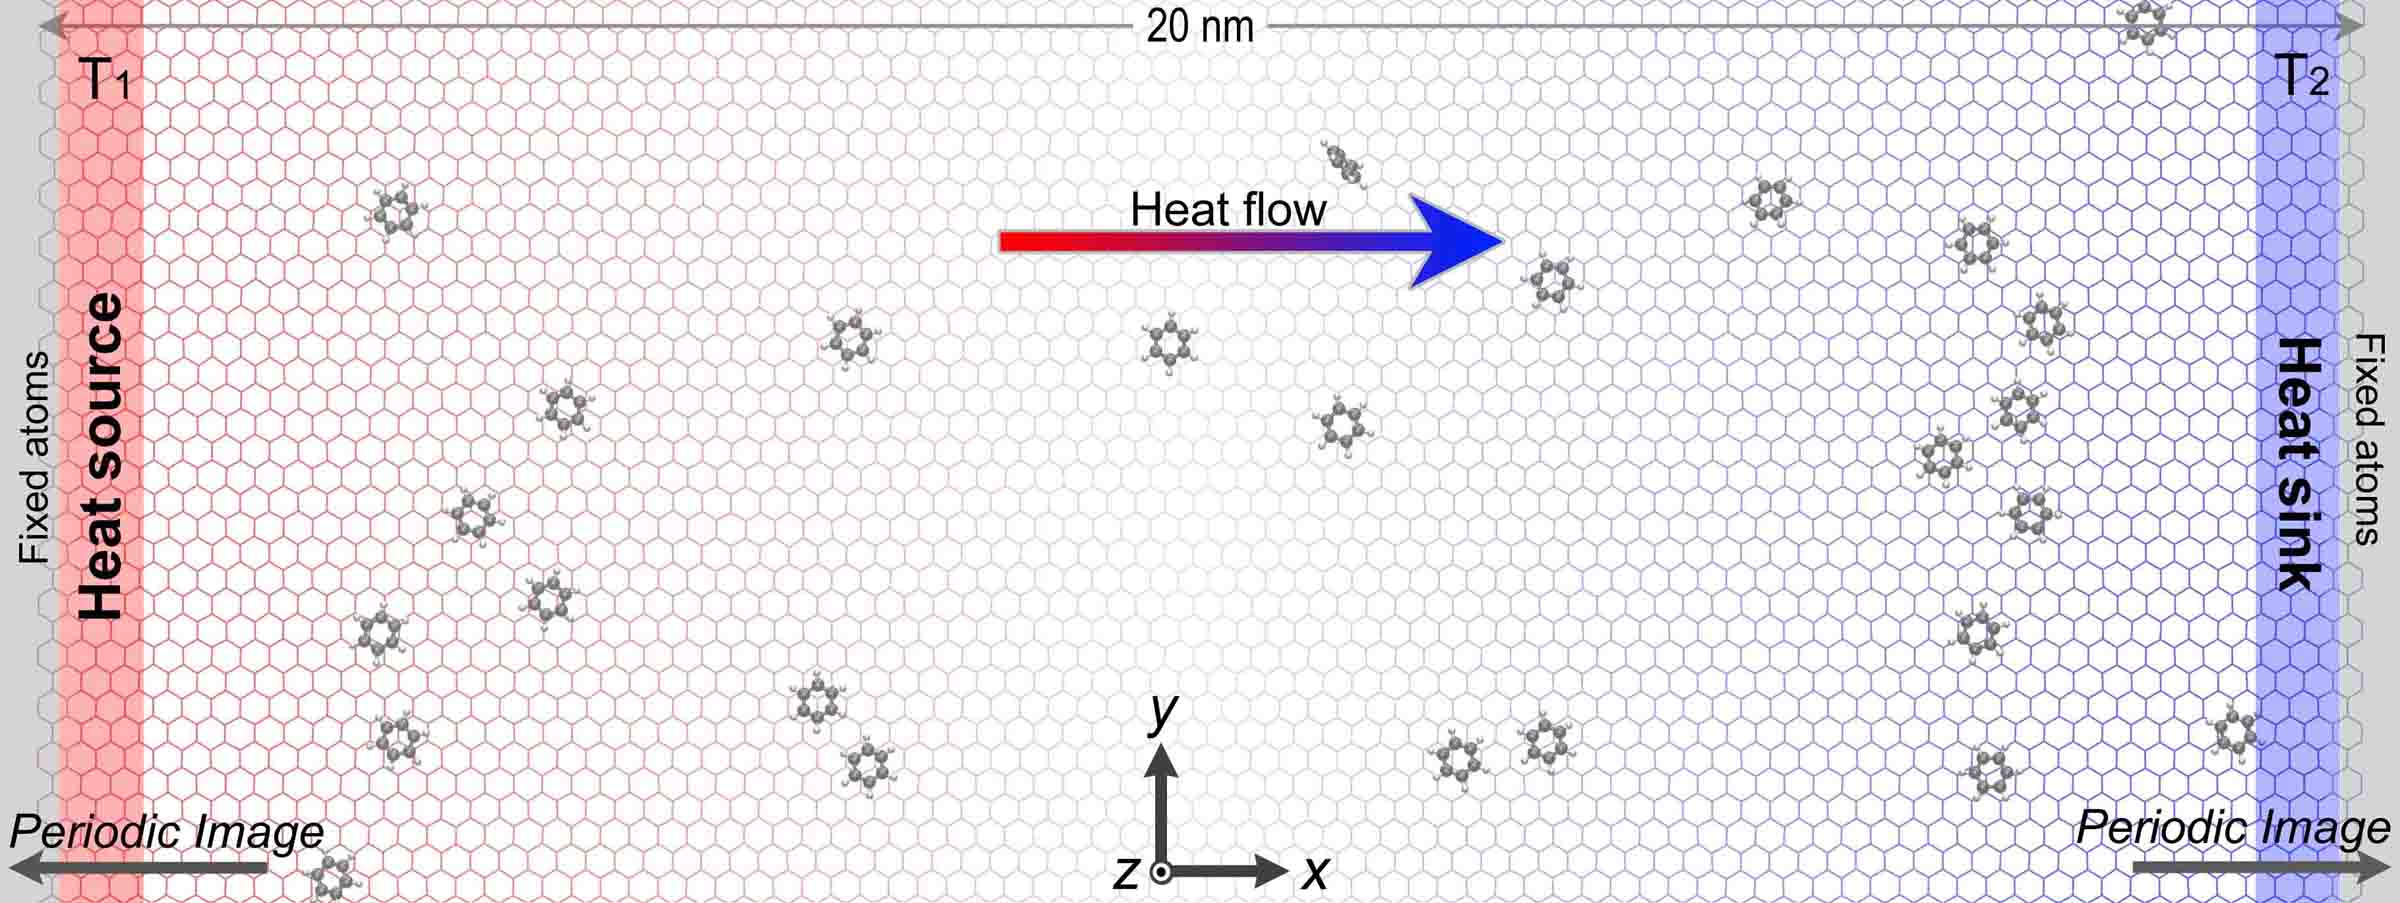
We consider a rectangular cell of in an infinite free-standing graphene layer. In analogy to experiments Barreiro et al. (2008); Zambrano et al. (2009); Oyarzua et al. (2018), two thermal energy reservoirs having different temperatures ( and ) are placed at the both sides of this cell, as shown in Fig. 1. The and boundaries of this cell are both set to be periodic in order to ensure a steady flow of molecules. Ten species of small organic molecules (benzene, butane, cyclehexane, cyclopentane, ethane, hexane, methylpropane, pentane, propane and toluene) are chosen to be the adsorbates. Different sets of simulations are performed varying molecular type, adsorbate density, temperature and thermal gradient. In each of these simulations, a number of organic molecules are initially adsorbed at random positions atop the graphene. The atoms of the adsorbates and the free part of graphene are free to move, while the temperatures of the graphene atoms in the thermal reservoir regions are controlled to progressively reach and by using the Nosé-Hoover thermostat Plimpton (1995); Wang (2018); Wu et al. (2019); Guo et al. (2015); Li et al. (2013); Lin et al. (2014). The MD run for a period of with a time step of after thermal equilibrium is reached within about . The simulation scheme is illustrated in video recordings provided in the Supporting Information.
The potential energy of the system is given by the adaptive interatomic reactive empirical bond order (AIREBO) potential as a sum of many-body interaction bonds,
| (1) |
where is the total number of atoms, , , and are atom index numbers. and are the interatomic repulsion and attraction terms for the valence electrons, respectively. is a single-bond torsion term. Many-body effects are included in the bond-order function,
| (2) |
where is a function of the atomic distance and bond angle, represents effects of the bond conjugation, and depends on the dihedral atomic angle. The long-range Van der Waals (vdw) interactions are included by adding the term , which is given by a parameterized Lennard-Jones (LJ) force field with a cutoff radius of . The parameter values and benchmarks of this force field are provided in Ref. (Stuart et al., 2000). Compared to other force fields for hydrocarbon systems, the modeling of bond rotation and torsion in the AIREBO potential in terms of the bond order is particularly important for simulating the adsorption process, taking into account possible deformations Wang (2009); Li et al. (2014); Wang and Philippe (2009) of the substrate induced by the adsorbates and viceversa. The AIREBO potential has therefore shown good accuracy in describing adsorption of hybridized-carbon systems Petucci et al. (2013); Qi et al. (2018). We focus on carbohydrates here for simplicity and accuracy.
III Results and Discussion
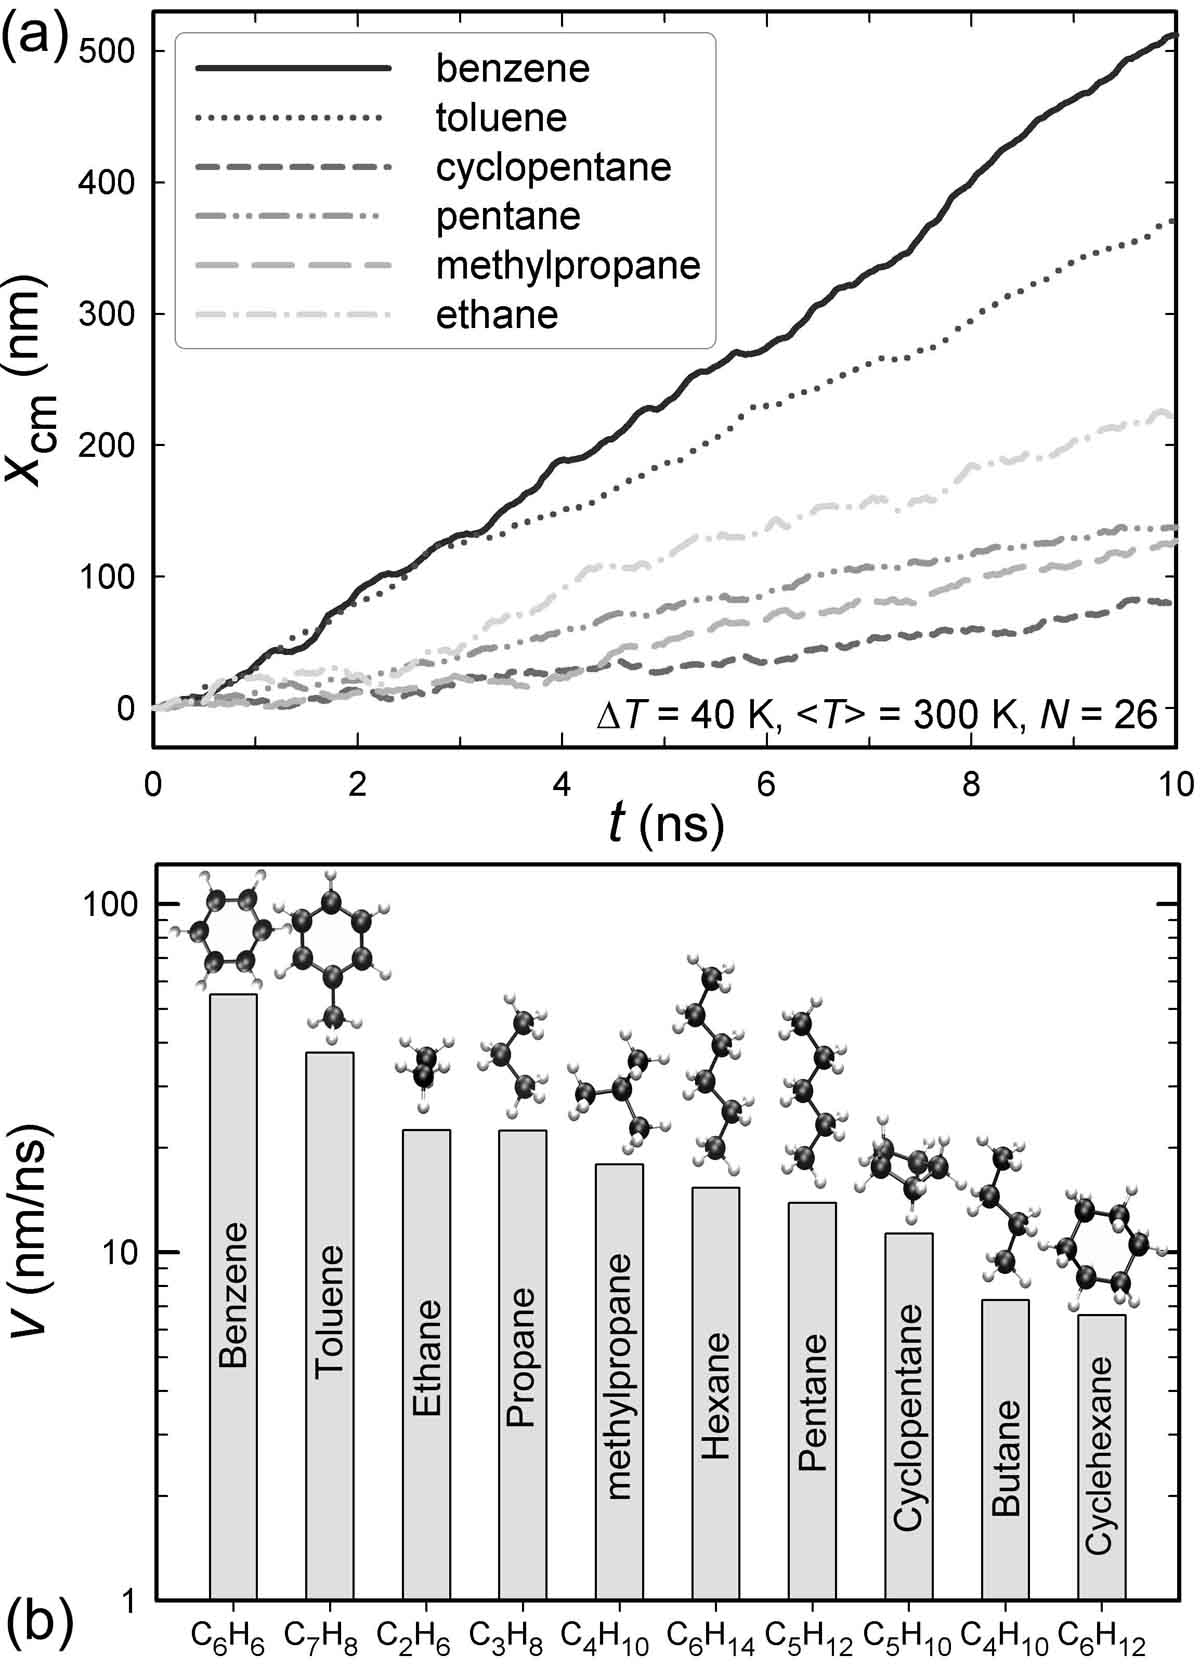
Fig. 2(a) shows the movement of the center of mass of molecules for different species of molecules at a constant number density. The unidirectional conduction of the molecules is found to be fast and selective. Benzene molecules are crowned champions of the race after having run more than within . The second place is taken by toluene molecules, which likewise have a hexagonal molecular structure. The aliphatic compounds such as ethane, pentane, methylpropane and cyclopentane move significantly slower than the aromatic ones. Video recordings in the Supporting Information illustrate the conduction of benzene and butane molecule for comparison.
Fig. 2(b) provides a comparison of the drift velocity between different molecule types. It can be seen that the ethane, propane, methylpropane and hexane molecules take the third, fourth, fifth and sixth positions, respectively. This can be understood from the fact that the increasing geometrical molecular cross-section increases the probability of collisions during transport. However, the subsequent ranking does not follow the expected trend of increasing molecular size. For instance, the pentane and butane molecules exhibit smaller velocity than the hexanes despite the similar structure and larger size of the latter. The cyclopentane molecules take the eighth position regardless their smaller size. The butane molecule has a similar structure to pentane and butane but smaller, and are however is even slower than cyclopentane. The last place is taken by the cyclohexane molecules, which a priori have no big size among the tested molecules.
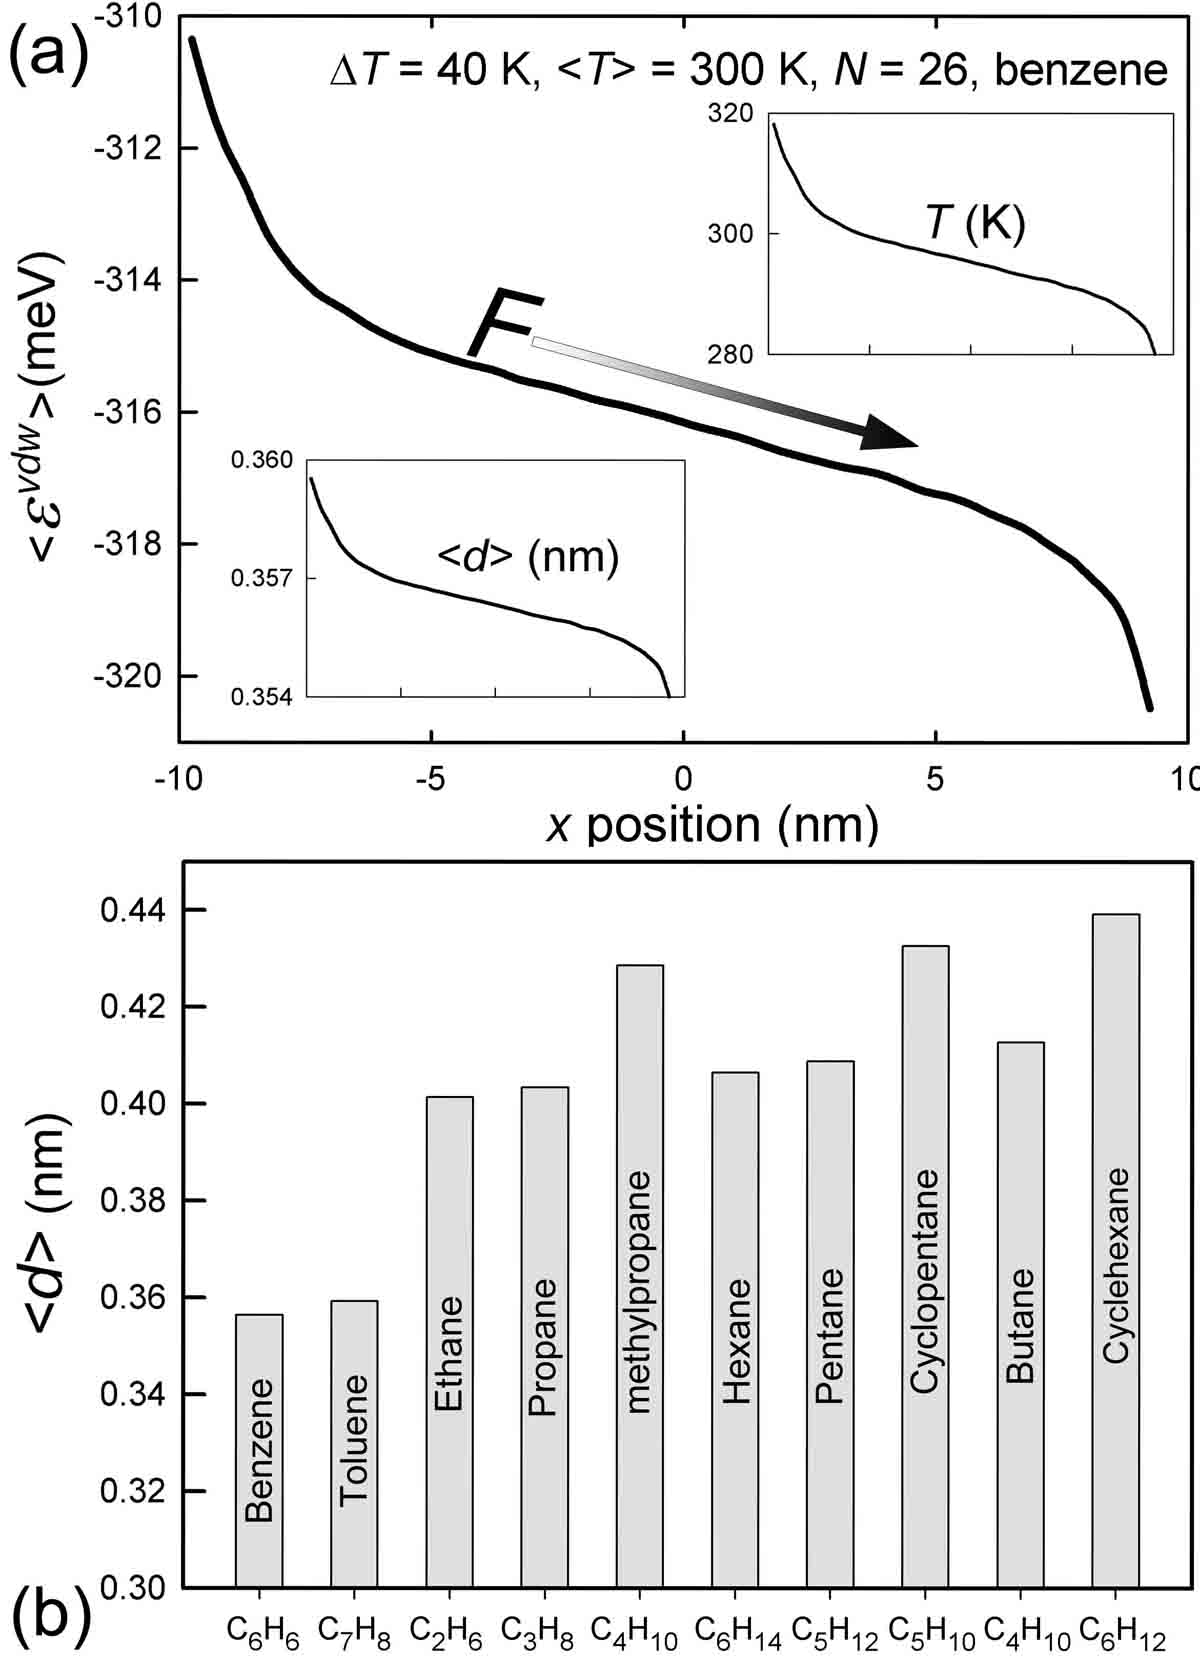
The ranking of the molecules is striking from the perspective of textbook thermodiffusion of gaseous mixtures, in which the molecular size should be the dominating factor at a given number density of adsorbates. The selectivity for aromatic molecules clearly points to a distinct driving mechanism of molecular transport at the gas-solid interface. We find that the driving force stems from the interaction between the adsorbates and the substrate instead of from that between the adsorbates, as shown in Fig. 3(a). A gradient of the potential energy of the interaction between the molecules and the graphene substrate is induced by the change in their distance, due to the non-uniform temperature field shown in the insets of Fig. 3(a). It is seen that the temperature gradient is steeper in the regions close to the thermal reservoirs. Acceleration of the molecules can be expected in these regions due to higher driving force, despite the kinetic energy is supposed to distribute uniformly inside the reservoirs, since the size of the reservoir ( in length) is quite small comparing to the length of the graphene sheet (). The planar structures of the aromatic molecules help keep shorter distances to the substrate, and thus they are under higher driving forces. This is confirmed by the average adsorbate-substrate distance data plotted in Fig. 3(b), which is clearly in an inverse correlation with the competition results shown in Fig. 2(b).
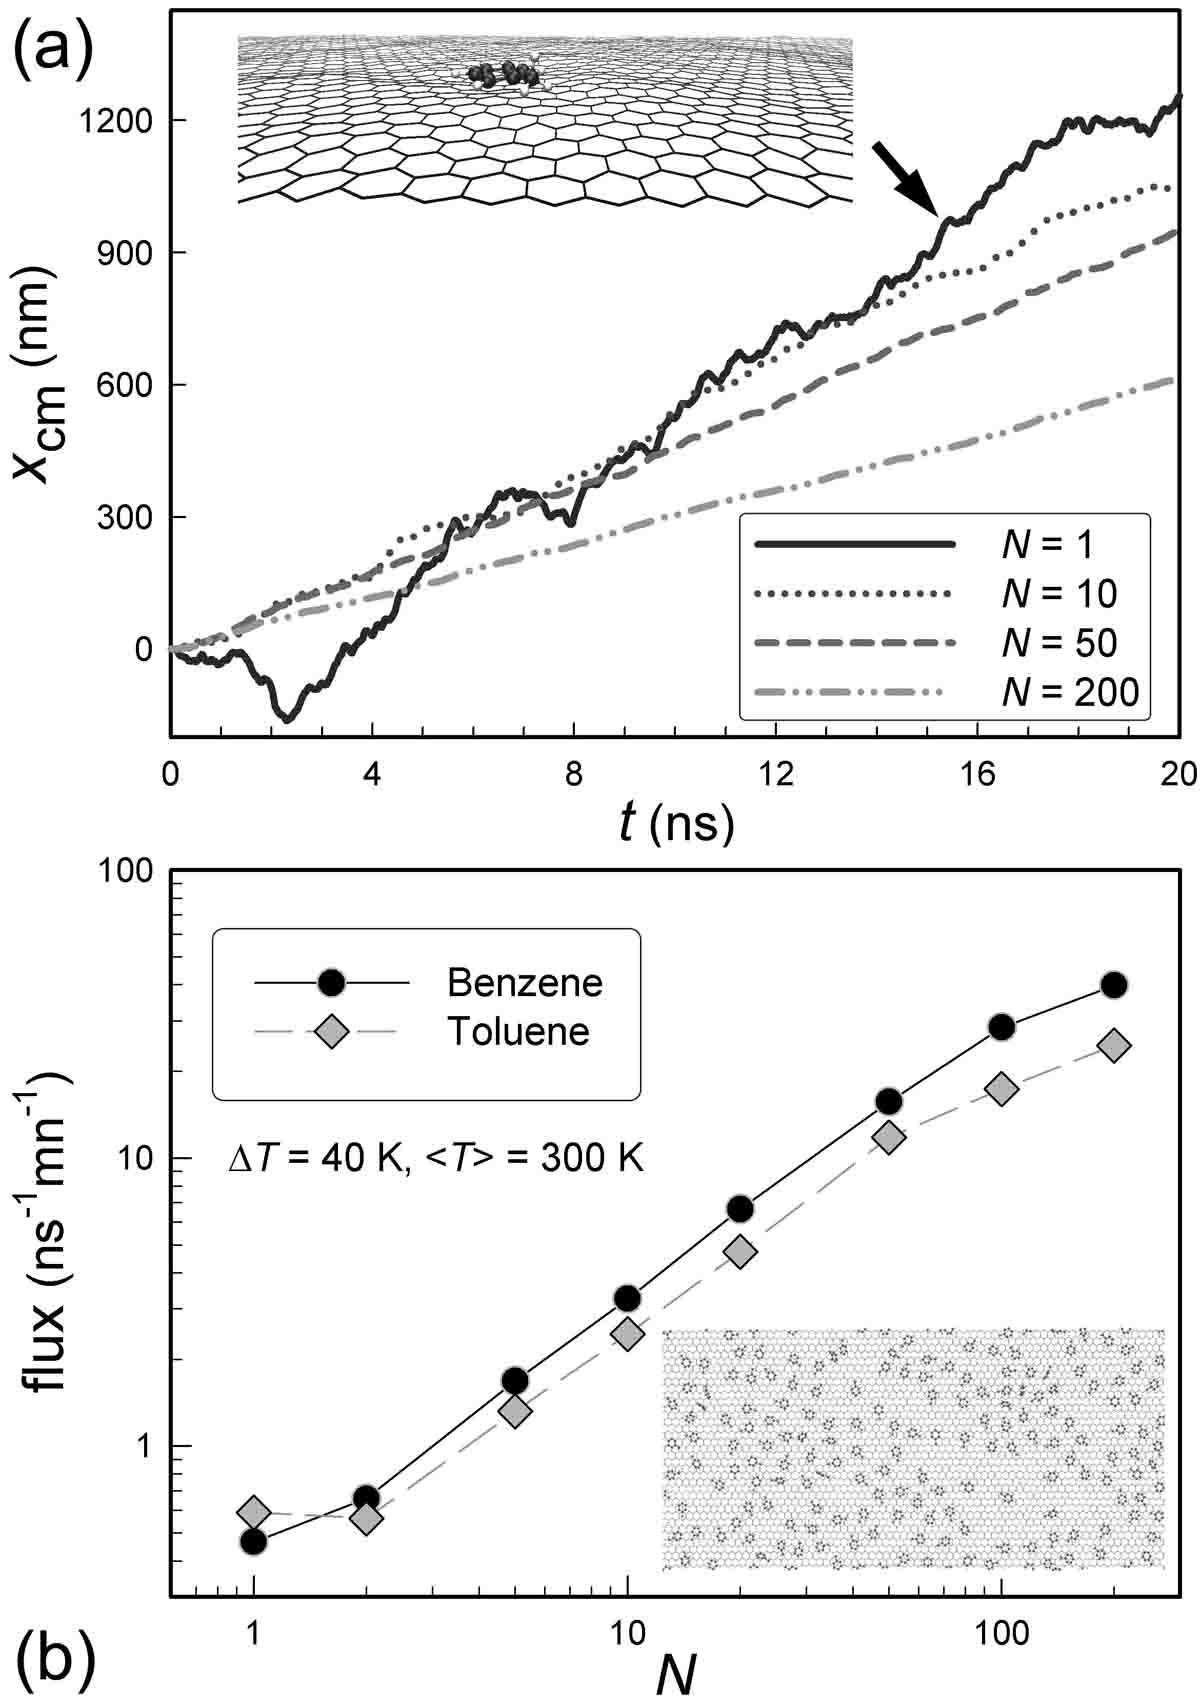
The origin of the driving force is also correlated to results of another set of simulations performed with various numbers of adsorbates, as shown in Fig. 4a. According to the kinetic theory of gases, the velocity should first increase and then decrease with decreasing in a gaseous mixture. However, this is not observed here. Instead, the molecules travel longer distance at lower density. A single adsorbate run with a high speed of about . The increase of the drift velocities with decreasing at low molecular densities clearly indicates that the molecular transport is mainly driven by the adsorbate-graphene interaction. Another dissimilarity in the thermodiffusion at gas-solid interface and that in a gas mixture can be seen in the curve in Fig. 4a. Because of no collision with other adsorbates, a single molecule can be expected to exhibit ballistic transport, by which its curve should have a parabolic shape. However, this is neither observed. The diffusive manner of single-molecule transport stems from thermal effects including the random rotation of the molecule and also possible collisions with thermally induced waves and ripples in the CNT surface as shown by the inset of Fig. 4a Fasolino et al. (2007); Barreiro et al. (2008); Wang and Devel (2011); Guo and Guo (2013). This rather stands in contrast to the previously reported ballistic thermophoresis of gold on graphene Panizon et al. (2017).
To have a comprehensive view of the density influence of the molecular transport, we plot the diffusion flux in Fig.4b as the amount of substance across a give -direction line in the 2D graphene plane. It can be seen that the flux roughly hold a linear relation with , except for too small () and too large density (). This observation identifies at least two different regimes of molecular transport, which is correlated to the surface coverage. We note that the nonlinear effect for may also be due to the reduced sample population to make valid statistics as we see in Fig. 4 that oscillation of curves is more significant for small . Moreover, we see that the flux of benzene molecules is kept higher than that of toluene ones at almost all density range.
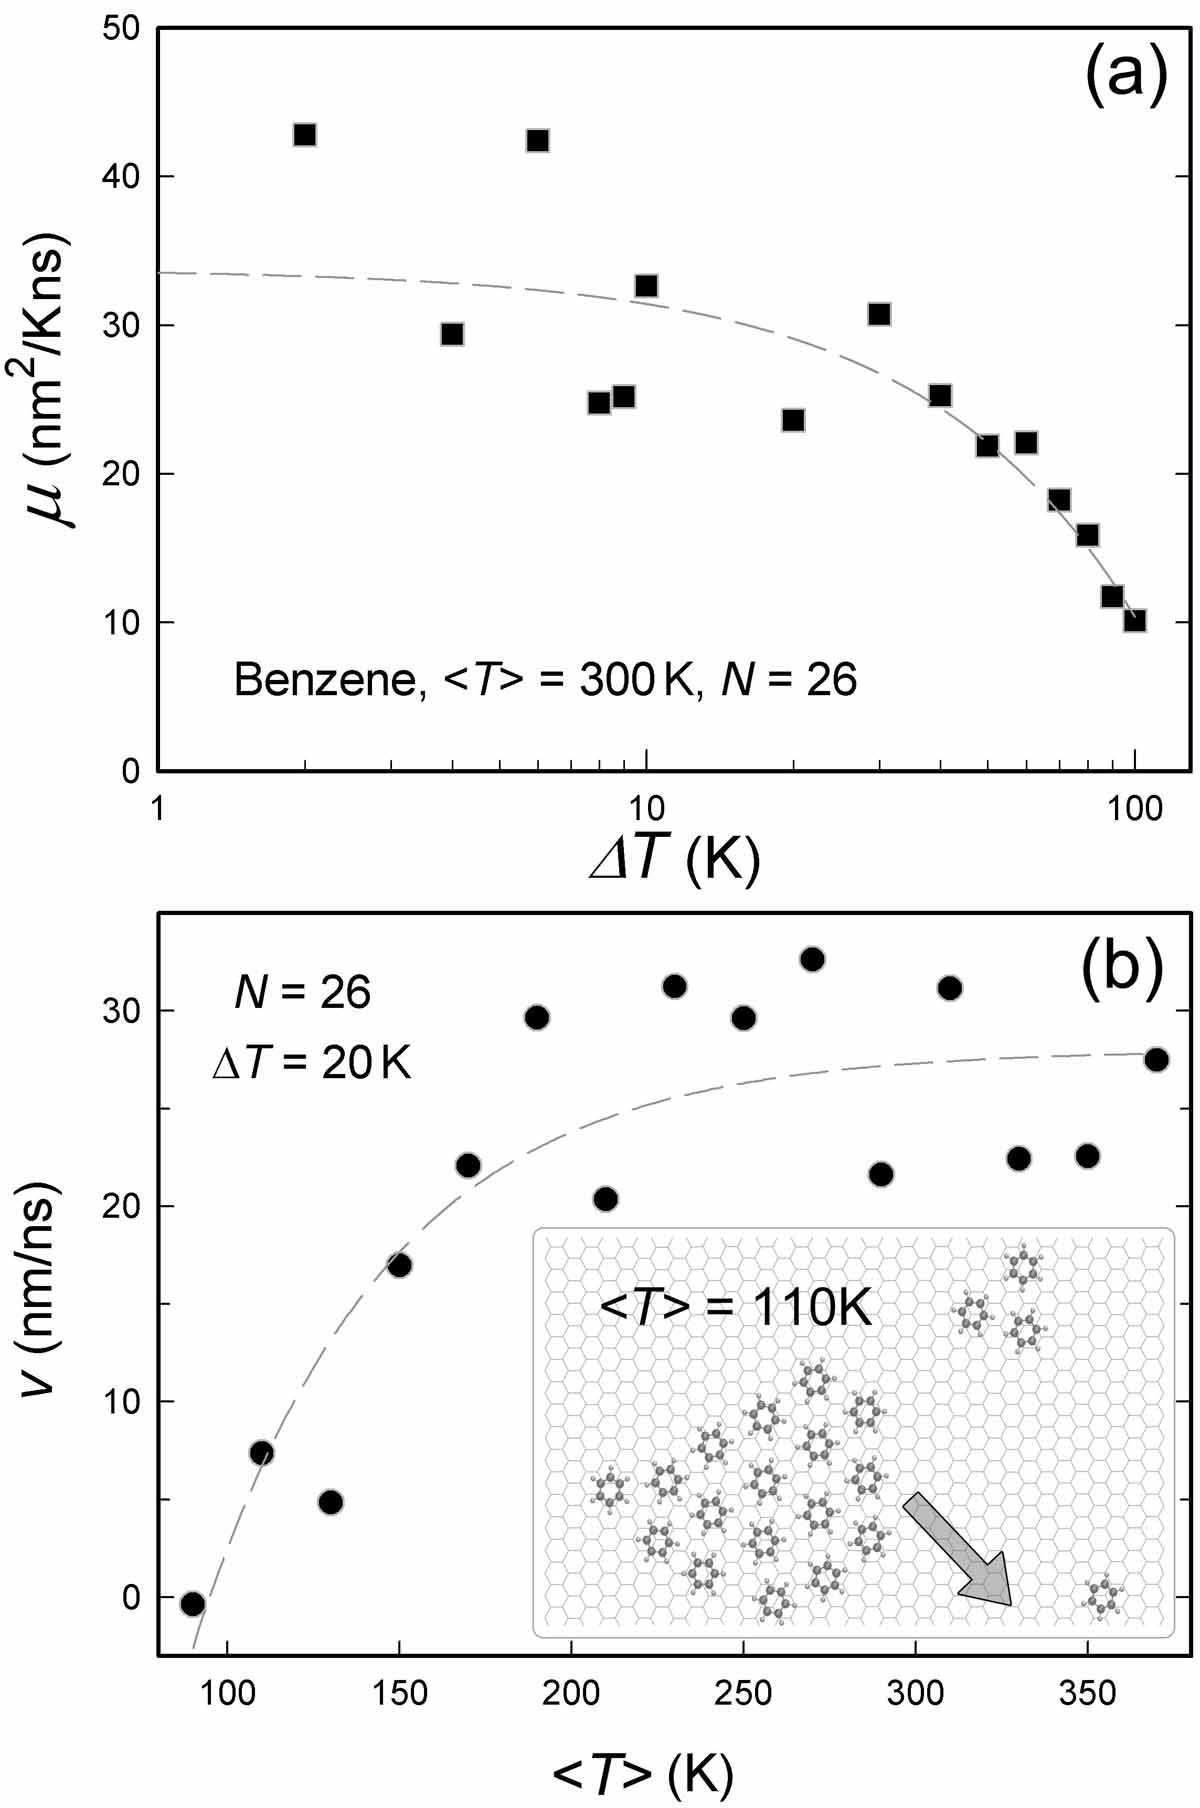
Drift mobility is defined as where is the temperature gradient. is usually a constant for a given molecule density. However, a strong non-linear dependence of the drift velocity on the temperature gradient is observed for large as shown in Fig. 5(a). It is seen that decreases rapidly with increasing when (corresponding to ). This indicates a non-linear regime of the drift velocity. Two possible origins of this non-linear regime might be correlated with the scattering of molecules with flexural phonon waves in the graphene substrate Guo and Guo (2013); Panizon et al. (2017), as well as with the non-linearity of the temperature profile shown in the upper inset of Fig. 3(a), which becomes more significant with increasing Osman and Srivastava (2001); Yang et al. (2015). Note that is expected to change with the molecular type and density, as well as with the average temperature . Moreover, the oscillation of at small is caused by the fact that a far longer simulation time is needed to make valid statistics of the results for small . Moreover, dissociation of a few molecules is observed at very high molecular density as shown in a video recording in the Supporting Information.
Fig. 5(b) shows temperature effects on the drift velocity. No conduction is observable when is below an activation temperature of . The increase of at increasing temperature is due to combined temperature effects on both the molecular diffusivity and the driving force. The diffusion coefficient of gases is known to increase at increasing temperature. Meanwhile, the driving force is supposed to be enhanced and then diminished since it is strongly correlated with the slope of the potential energy curves in relation to the adsorbate-substrate distance as the molecules can be considered as anharmonic oscillators. This could the reason why increases at increasing with decreasing proportionality. Moreover, the benzenes form aggregates and move collectively at low temperature as shown in the inset of Fig. 5(b) as well as in a video recording in the Supporting Information. Their movement shows preference on certain orientations on the graphene surface. This is consistent with the observation by Schoen et al. about the motion of a gold nanoparticle in helical tracks on a CNT surface Schoen et al. (2006); Mao and Sinnott (2002) based on the registry-dependent interaction between hybridized carbons Chen et al. (2013).
IV Conclusions
The first race of organic molecules is made on a free-standing graphene substrate in MD simulations. The winners are two aromatics, namely benzene and toluene, which are found to exhibit higher drift velocities than the aliphatic molecules. This selective molecular transport is driven by a potential gradient coming from varying adsorbate-substrate distance caused by the non-uniform temperature field. Such a mechanism is quite different from that behind conventional gas-phase thermodiffusion. The molecular flux increases at increasing molecular density in two different regimes that are correlated to surface coverage. No ballistic transport is observable even for a single molecule on the graphene, probably due to thermal rippling of graphene. Furthermore, the drift mobility roughly remains constant except for under very large thermal gradient, signifying a nonlinear regime of the drift velocity. A critical activation temperature for the transport of benzenes on graphene is also detected. These results have strong implications for our understanding of the conduction of organic molecules on 2D nanostructures, and pave a way to a practical mean for selectively recognizing planar aromatic molecules, benzene in particular.
References
- Li et al. (2015) Y. F. Li, S. F. Wang, G. W. He, H. Wu, F. S. Pan, and Z. Y. Jiang, Chem. Soc. Rev. 44, 103 (2015).
- Bianco et al. (2005) A. Bianco, K. Kostarelos, and M. Prato, Curr. Opin. Chem. Biol. 9, 674 (2005).
- Erbas-Cakmak et al. (2015) S. Erbas-Cakmak, D. A. Leigh, C. T. McTernan, and A. L. Nussbaumer, Chem. Rev. 115, 10081 (2015).
- Park and Jung (2014) H. G. Park and Y. Jung, Chem. Soc. Rev. 43, 565 (2014).
- Duhr and Braun (2006) S. Duhr and D. Braun, Proc. Natl. Acad. Sci. U.S.A. 103, 19678 (2006).
- Barreiro et al. (2008) A. Barreiro, R. Rurali, E. R. Hernandez, J. Moser, T. Pichler, L. Forro, and A. Bachtold, Science 320, 775 (2008).
- Guo and Guo (2013) Y. F. Guo and W. L. Guo, Nanoscale 5, 318 (2013).
- Becton and Wang (2014) M. Becton and X. Q. Wang, J. Chem. Theory Comput. 10, 722 (2014).
- Panizon et al. (2017) E. Panizon, R. Guerra, and E. Tosatti, Proc. Natl. Acad. Sci. U.S.A. 114, E7035 (2017).
- Zhang et al. (2019) X. Q. Zhang, H. L. Liu, and L. Jiang, Adv. Mater. 31, 1804508 (2019).
- Sun et al. (2016) P. Z. Sun, K. L. Wang, and H. W. Zhu, Adv. Mater. 28, 2287 (2016).
- Hummer et al. (2001) G. Hummer, J. C. Rasaiah, and J. P. Noworyta, Nature 414, 188 (2001).
- Regan et al. (2004) B. C. Regan, S. Aloni, R. O. Ritchie, U. Dahmen, and A. Zettl, Nature 428, 924 (2004).
- Holt et al. (2006) J. K. Holt, H. G. Park, Y. M. Wang, M. Stadermann, A. B. Artyukhin, C. P. Grigoropoulos, A. Noy, and O. Bakajin, Science 312, 1034 (2006).
- Sun et al. (2006) L. Sun, F. Banhart, A. V. Krasheninnikov, J. A. Rodriguez-Manzo, M. Terrones, and P. M. Ajayan, Science 312, 1199 (2006).
- Schoen et al. (2006) P. A. E. Schoen, J. H. Walther, S. Arcidiacono, D. Poulikakos, and P. Koumoutsakos, Nano Lett. 6, 1910 (2006).
- Leng et al. (2016) J. T. Leng, Z. R. Guo, H. W. Zhang, T. C. Chang, X. M. Guo, and H. J. Gao, Nano Lett. 16, 6396 (2016).
- Roos et al. (2011) M. Roos, D. Kunzel, B. Uhl, H. H. Huang, O. B. Alves, H. E. Hoster, A. Gross, and R. J. Behm, J. Am. Chem. Soc. 133, 9208 (2011).
- Zambrano et al. (2009) H. A. Zambrano, J. H. Walther, P. Koumoutsakos, and I. F. Sbalzarini, Nano Lett. 9, 66 (2009).
- Oyarzua et al. (2018) E. Oyarzua, J. H. Walther, and H. A. Zambrano, Phys. Chem. Chem. Phys. 20, 3672 (2018).
- Plimpton (1995) S. Plimpton, J. Comput. Phys. 117, 1 (1995).
- Wang (2018) Z. Wang, J. Phys. D Appl. Phys. 51, 435301 (2018).
- Wu et al. (2019) Z. Y. Wu, X. L. Yang, and Z. Wang, Nanotechnology 30, 245601 (2019).
- Guo et al. (2015) W. Guo, Z. Wang, and J. Li, Nano Lett. 15, 6582 (2015).
- Li et al. (2013) X. D. Li, J. Carrete, J. P. Lin, G. J. Qiao, and Z. Wang, Appl. Phys. Lett. 103, 103902 (2013).
- Lin et al. (2014) J. P. Lin, X. D. Li, G. J. Qiao, Z. Wang, J. Carrete, Y. Ren, L. Z. Ma, Y. J. Fei, B. F. Yang, L. Lei, et al., J. Amer. Chem. Soc. 136, 1497 (2014).
- Stuart et al. (2000) S. Stuart, A. Tutein, and J. Harrison, J. Chem. Phys. 112, 6472 (2000).
- Wang (2009) Z. Wang, Carbon 47, 3050 (2009).
- Li et al. (2014) J. Li, X. B. Yan, G. Y. Gou, Z. Wang, and J. T. Chen, Phys. Chem. Chem. Phys. 16, 1850 (2014).
- Wang and Philippe (2009) Z. Wang and L. Philippe, Phys. Rev. Lett. 102, 215501 (2009).
- Petucci et al. (2013) J. Petucci, C. LeBlond, M. Karimi, and G. Vidali, J. Chem. Phys. 139, 044706 (2013).
- Qi et al. (2018) H. Qi, S. Picaud, M. Devel, L. E., and W. Z., ApJ 867, 133 (2018).
- Fasolino et al. (2007) A. Fasolino, J. H. Los, and M. I. Katsnelson, Nature Mater. 6, 858 (2007).
- Wang and Devel (2011) Z. Wang and M. Devel, Phys. Rev. B 83, 125422 (2011).
- Osman and Srivastava (2001) M. A. Osman and D. Srivastava, Nanotechnology 12, 21 (2001).
- Yang et al. (2015) X. L. Yang, J. Carrete, and Z. Wang, J. Appl. Phys. 118, 085701 (2015).
- Mao and Sinnott (2002) Z. G. Mao and S. B. Sinnott, Phys. Rev. Lett. 89, 278301 (2002).
- Chen et al. (2013) Y. B. Chen, Z. Y. Shen, Z. W. Xu, Y. Hu, H. T. Xu, S. Wang, X. L. Guo, Y. F. Zhang, L. M. Peng, F. Ding, et al., Nature Comm. 4, 2205 (2013).