The Massive Ancient Galaxies At NEar-infrared (MAGAZ3NE) Survey: Confirmation of Extremely Rapid Star-Formation and Quenching Timescales for Massive Galaxies in the Early Universe111The spectra presented herein were obtained at the W. M. Keck Observatory, which is operated as a scientific partnership among the California Institute of Technology, the University of California and the National Aeronautics and Space Administration. The Observatory was made possible by the generous financial support of the W. M. Keck Foundation.
Abstract
We present near-infrared spectroscopic confirmations of a sample of 16 photometrically-selected galaxies with stellar masses at redshift from the XMM-VIDEO and COSMOS-UltraVISTA fields using Keck/MOSFIRE as part of the MAGAZ3NE survey. Eight of the ultra-massive galaxies (UMGs) have specific star formation rates (sSFR) Gyr-1, with negligible emission lines. Another seven UMGs show emission lines consistent with active galactic nuclei and/or star formation, while only one UMG has sSFR Gyr-1. Model star formation histories of these galaxies describe systems that formed the majority of their stars in vigorous bursts of several hundred Myr duration around during which hundreds to thousands of solar masses were formed per year. These formation ages of Gyr prior to observation are consistent with ages derived from measurements of (4000) and (H). Rapid quenching followed these bursty star-forming periods, generally occurring less than 350 Myr before observation, resulting in post-starburst SEDs and spectra for half the sample. The rapid formation timescales are consistent with the extreme star formation rates observed in dusty starbursts observed with ALMA, suggesting that such dusty galaxies are progenitors of these UMGs. While such formation histories have been suggested in previous studies, the large sample introduced here presents the most compelling evidence yet that vigorous star formation followed by rapid quenching is almost certainly the norm for high mass galaxies in the early universe. The UMGs presented here were selected to be brighter than raising the intriguing possibility that even (fainter) older quiescent UMGs could exist at this epoch.
1 Introduction
The observation of massive, quiescent galaxies has repeatedly forced astronomers to reconsider the paradigm of galaxy evolution and cosmology, particularly in the early Universe. The spectrum of an old galaxy at (Dunlop et al., 1996) brought serious challenges to the Einstein-de Sitter cosmology (Einstein & de Sitter, 1932) popular at the time. Further observations of similar galaxies at progressively higher redshifts (e.g., Cimatti et al., 2004; Kriek et al., 2009; Gobat et al., 2012; van de Sande et al., 2013) led to the realization that galaxies could build up large stellar populations and quench star formation at early times, which required new suites of simulations to reproduce them (e.g., Vogelsberger et al., 2014a, b; Genel et al., 2014; Hopkins et al., 2014; Schaye et al., 2015; Crain et al., 2015; Henriques et al., 2015; Wellons et al., 2015; Davé et al., 2016; Feldmann et al., 2016).
It is now clear that most, if not all, ultra-massive galaxies (UMGs; ) have assembled the majority of their mass by (e.g., Nelan et al., 2005; Thomas et al., 2005; Treu et al., 2005; Gallazzi et al., 2005; Thomas et al., 2010; Estrada-Carpenter et al., 2020). Indeed, the number density of these galaxies evolves very little over the most recent 9 Gyr (van der Wel et al., 2014; Gargiulo et al., 2016; Kawinwanichakij et al., 2020), and evidence suggests most of the mass assembly for these galaxies occurred in an early short-lived burst, while less massive quiescent galaxies have underwent longer, less intense periods of star formation (Pacifici et al., 2016; Ciesla et al., 2017). Thus, determining the evolution of these UMGs at earlier times is of great interest as they hold clues to the processes required not only for intense, early star formation, but also rapid quenching.
Critical to the discovery of large numbers of quiescent UMGs at higher redshifts is the existence of wide and deep near-infrared (NIR) imaging combined with ancillary multi-wavelength observations. The NIR wavelengths are where these galaxies are most easily detected and also constrain stellar masses, as the NIR corresponds to the rest-frame optical at . Additional photometry across a range of wavelengths is necessary to effectively characterize SEDs and rule out drastically different natures; in particular, IRAC photometry is critical to differentiating between dust-obscured and old populations at . A variety of recent surveys have made such imaging available, including CANDELS (Koekemoer et al., 2011; Grogin et al., 2011), NMBS (van Dokkum et al., 2009; Whitaker et al., 2011), UltraVISTA (McCracken et al., 2012), VIDEO (Jarvis et al., 2013), DES+VHS (Banerji et al., 2015), and ZFOURGE (Straatman et al., 2016). This has resulted in an increasing number of photometric candidates that require follow-up to confirm their quiescent natures (Marchesini et al., 2010; Straatman et al., 2014; Spitler et al., 2014; Guarnieri et al., 2019; Alcalde Pampliega et al., 2019; Merlin et al., 2019; Shahidi et al., 2020).
Selection of these objects is often done using color-color diagrams (e.g., Labbé et al., 2005), the most common of which is the restframe (U-V) vs (V-J) plane known as the UVJ diagram (e.g., Wuyts et al., 2007; Williams et al., 2009; Martis et al., 2016; Forrest et al., 2016), where the red colors of quiescent objects make them stand out. However, at high redshifts the clear color bimodality seen in UVJ at low redshifts is not as well defined (Whitaker et al., 2011; Muzzin et al., 2013; Straatman et al., 2016). Additionally, the presence of strong emission lines can move galaxy colors significantly, thus affecting conclusions drawn from photometry alone (e.g., Salmon et al., 2015; Forrest et al., 2018, Marsan et al. 2020, in prep). Spectroscopic follow-up is thus required to 1) confirm the redshift, 2) quantify the strength of emission lines associated with ongoing star formation and 3) put limits on dust-obscured star formation.
NIR spectroscopy (corresponding to rest-frame optical wavelengths at ) can inform these areas by detecting either emission features such as [Oii], , and [Oiii] or absorption features including the Balmer series and Calcium H and K lines (e.g., Belli et al., 2014; Kriek et al., 2015; Belli et al., 2017; Newman et al., 2018). While the strongest constraints on dust obscured star formation can be provided by far-infrared data, a complete lack of emission lines in a spectrum is also highly constraining. However, at candidate UMGs are faint and require significant amounts of exposure time, particularly for those which do not have emission lines. Indeed while candidate quiescent UMGs have been spectroscopically confirmed at (e.g., Marsan et al., 2015, 2017; Glazebrook et al., 2017; Schreiber et al., 2018a; Tanaka et al., 2019; Forrest et al., 2020; Valentino et al., 2020, Saracco et al. 2020, submitted), only a few have been confirmed to have no emission lines, and several have far-infrared detections indicating ongoing star formation (Schreiber et al., 2018a, b). All of these works have concluded that these galaxies formed their large stellar masses in short, intense bursts of star formation.
For this work we used the - and -band spectroscopic capabilities of Keck-MOSFIRE (McLean et al., 2010, 2012) to follow up a set of massive candidates from XMM-VIDEO (Annunziatella et al., in prep) and COSMOS-UltraVISTA fields (Muzzin et al., in prep). The survey aimed to characterize not only quiescent candidates, but also candidate UMGs in the blue star-forming region and red candidates consistent with large amounts of dust to inform the picture of galaxy formation in the early universe. We present the photometric properties and selection method in Section 2, the spectroscopic observations and data reduction in Section 3, the redshift determination and galaxy property characterization in Section 4, and then present the results in Section 5 and the main conclusions in Section 6). Throughout this work we assume a Chabrier IMF (Chabrier, 2003) and a CDM cosmology with km s-1 Mpc-1, , and . We also adopt an AB magnitude system (Oke & Gunn, 1983).
2 Photometric Data and Target Selection
2.1 Photometric Catalogs
MAGAZ3NE targets were selected from parent photometric catalogs in the UltraVISTA DR1 (Muzzin et al., 2013), UltraVISTA DR3 (Muzzin et al., in prep) and XMM-VIDEO (Annunziatella et al., in prep) fields.
The UltraVISTA survey McCracken et al. (2012) obtained deep near-infrared -, -, -, and -band imaging over 1.62 deg2 in the COSMOS field. Combined with ancillary photometry from m, this yielded 30 bandpasses allowing for accurate characterization of galaxy spectral energy distributions (SEDs) and precise photometric redshifts (DR1 catalogs, 90% completeness mag; Muzzin et al., 2013). Further deep imaging in the NIR yielded a set of ultra-deep strips over 0.84 deg2 (DR3 catalogs; 90% completeness mag; Marsan et al. 2020, in prep, Muzzin et al., in prep), which allowed for detection of massive, quiescent galaxies whose properties cannot be constrained from optical photometry alone. Considerable further photometry was also added to obtain a total of 49 bandpasses in regions where there is overlap. Critical to this work were Spitzer/IRAC mosaics using data from the S-COSMOS (Sanders et al., 2007), SPLASH (Mehta et al., 2018) and SMUVS (Ashby et al., 2018), which resulted in IRAC imaging mag deeper in the and m bandpasses relative to DR1.
Similarly, the VISTA Deep Extragalactic Observations survey (VIDEO; Jarvis et al., 2013) acquired deep near-infrared -, -, -, -, and -band imaging in three fields: the European Large Area Infrared Space Observatory S1 field, the extended Chandra Deep Field South, and the XMM-Newton Large Scale Structure (XMM) field. Of the three VIDEO fields, we only present targets from the XMM field in this work, which also has substantial photometric observations in other optical and near-infrared bandpasses. Catalogs were constructed using VIDEO DR4 data over 4.65 deg2 with a depth of mag (Annunziatella, et al., in prep). These include 22 photometric passbands ranging from u-band to IRAC m including NIR observations from from the VIDEO survey (Jarvis et al., 2013), and deep IRAC data from the SERVS (Mauduit et al., 2012) and DEEPDRILL (Lacy et al. 2020, submitted) surveys.
2.2 Candidate UMG Targets
We selected primary targets on the basis of photometric redshift ( ; roughly the window in which falls into the MOSFIRE -band) and stellar mass ( ), as fit using EAzY (Brammer et al., 2008) and FAST (Kriek et al., 2009) (see Table 1). We also made a -band magnitude cut, AB. According to the MOSFIRE ETC222https://www2.keck.hawaii.edu/inst/mosfire/etc.html a 300 minute (18 ks) exposure would allow such an object to be detected with a continuum signal-to-noise ratio (SNR) of 5/pixel, sufficient to determine a redshift from a Balmer absorption feature such as . In the -band, the same detection threshold corresponds to AB.
In order to characterize a representative sample of UMGs at , we aimed to observe galaxies in a variety of locations on the UVJ diagram, potentially representing different stages of massive galaxy evolution. The main goal of this survey was to obtain redshifts for UMGs, confirming that such a population exists at this epoch, and to subsequently characterize these galaxies using emission and absorption features.
Confirmation of these faint galaxies via detection of absorption lines is difficult under poor observing conditions. As such, we selected a number of UMG candidates with blue SEDs, consistent with ongoing star formation, to observe when conditions were unfavorable. These galaxies were more likely to have emission features which can more easily be detected. In particular, we considered the amount of UV flux, strength of the Lyman and Balmer breaks, UVJ colors, and photometrically-derived star-formation rate (SFR) for selection. While the same mass and photometric redshift thresholds applied for selection of these targets, the magnitude cut was relaxed half a magnitude to .
This selection method resulted in a sample of 33 candidate UMGs. From this sample, 21 were observed and 16 were spectroscopically confirmed. In this work we discuss these 16 objects, but a summary of the 5 remaining objects is presented in Appendix B. Note that none of these unconfirmed objects can be ruled out as a UMG at - three objects had insufficient signal-to-noise to confirm a redshift, one shows clear continuum but no defining features, and the fifth has a redshift but hosts a luminous quasar, making its mass uncertain.
3 Observations and Data Reduction
3.1 Mask Construction & Ancillary Targets
MOSFIRE slits were arranged using the MOSFIRE Automatic GUI-based Mask Application (MAGMA) tool333http://www2.keck.hawaii.edu/inst/mosfire/magma.html. This software requires an input list of targets with priority weighting, and a range of allowable pointing positions and position angles (PA). For each candidate UMG, -band images were visually inspected to find nearby sources which could contaminate the spectra. In several cases, PA was constrained and/or dither size altered to avoid spectral contamination. We also constructed masks ahead of time for observing in poor conditions, targeting UMG candidates more likely to show emission features as discussed above. Slit width for these masks was increased from to .
All masks had one or two UMGs, 4-8 position alignment stars, and at least one star on a science slit, for use in monitoring the seeing and slit losses, as well as performing a telluric correction (see Section 3.3.2 and Appendix D). Masks were designed to include as many bright, nearby galaxies with similar photometric redshifts as possible in order to characterize the local environment via emission line detection. Ancillary targets were prioritized based on magnitude, SED shape, and redshift probability distribution from EAzY, and the stellar mass and SFR fit by FAST.
3.2 Observing Plan
Bright UMG candidates with red SEDs and UVJ colors were prioritized for observation, as these were not expected to show strong emission features. More time and better conditions were required to confirm redshifts for these objects through the detection of absorption features. That said, classification as star-forming or quiescent via UVJ colors is known to not be a pure indicator of the existence or lack of emission features, as spectroscopic determination of both redshift and emission line contamination can alter derived rest-frame colors significantly (e.g., Schreiber et al., 2018a).
We performed on-the-fly reductions throughout observing. If a UMG showed clear emission lines in the 2D reduction, we moved on to the next target for the night. However, if emission features from a UMG candidate were not clear after hours but stellar continuum was seen, we changed to a second mask on the same UMG. This allowed us to spectroscopically confirm neighbor galaxies to the UMG and increase continuum SNR of the UMG for better characterization of absorption features.
Targets were initially observed with MOSFIRE -band spectroscopy in order to detect any strong emission from [Oiii] and in either emission or absorption. A single exception to this was COS-DR3-84674, which was observed in -band, due to concerns that a small deviation from its low could cause lines to fall between the - and -bands. As such, we targeted this object in -band in an attempt to obtain an absorption line redshift or detection of [Oii] emission.
For half of the UMG targets, emission from [Oiii] was detected in -band with SNR . The remaining eight had continuum detections, but no clear emission features were seen. While in three cases the redshift could be confirmed from absorption features, the remaining five UMGs without clear spectroscopic redshifts were followed up with -band spectroscopy. This allowed for detection of higher order Balmer absorption features, CaH and CaK absorption, and the 4000 Å break, and also allowed for constraint of the spectral shape between the two bandpasses.
In total, 15 of the confirmed UMGs were observed for an average of 2 hours in -band, and six confirmed UMGs were observed for an average of 5 hours in -band. All masks were observed using an ABBA dither pattern and 180 or 120 s exposures for - and -bands, respectively. A table of observed masks and UMG targets can be found in Appendix A.
3.3 Spectral Reduction
3.3.1 Spectral Extraction
Each mask was processed individually. In cases where a galaxy was observed on multiple masks, spectra were only stacked after each one had been processed independently and a 1D spectrum extracted. For these, the 1D spectra were coadded using inverse variance weighting based on the error spectra.
We began by running the MOSFIRE Data Reduction Pipeline (DRP)444https://github.com/Mosfire-DataReductionPipeline/MosfireDRP, which constructs a pixel flat image, identifies slits, removes thermal contamination (-band), performs wavelength calibration using sky lines, Neon arc lamps, and Argon arc lamps, removes sky background, and rectifies the spectra, yielding a reduced 2D spectrum for a given mask.
While the DRP also offers an option to extract a 1D spectrum, we wrote our own custom code to perform optimal extraction (Horne, 1986). Briefly, this involves collapsing the 2D spectrum for each slit along the wavelength axis and fitting a Gaussian to the summed fluxes, with a prior on the predicted position of the object on each slit. This Gaussian is then used as a weight when collapsing the spectrum along the spatial axis to obtain the 1D spectrum (and errors) for each object555The official MOSFIRE DRP appears to have not yet been updated to do this - https://github.com/Keck-DataReductionPipelines/MosfireDRP/issues/126.
3.3.2 Sky Line Identification and Telluric Corrections
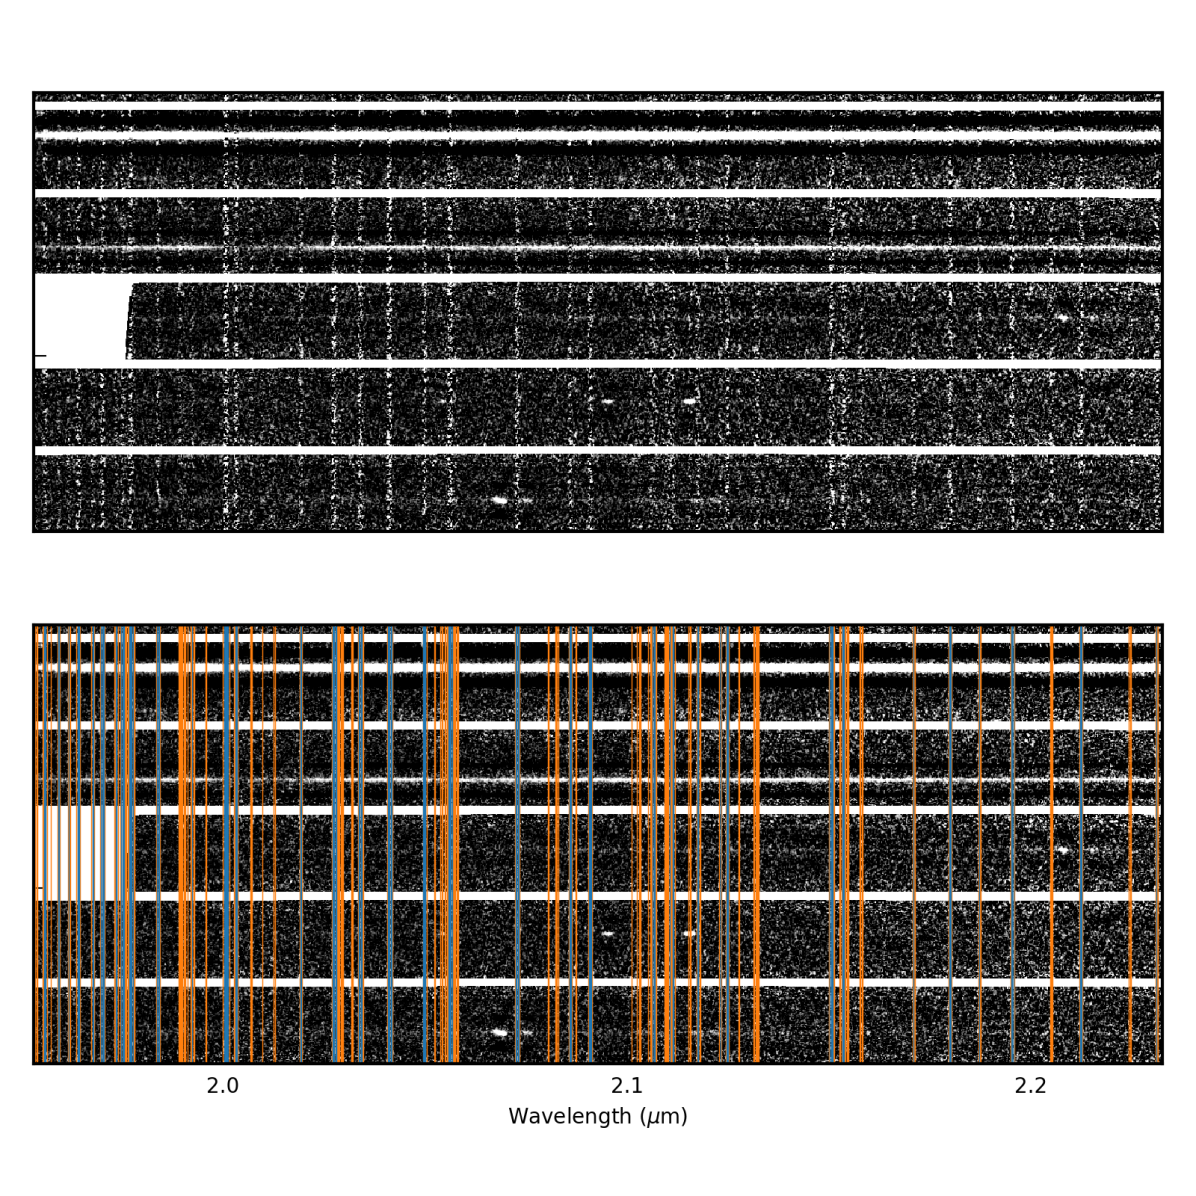
Strong sky lines are a serious contaminant in the NIR, particularly in the -band, and while the DRP attempts to subtract off their flux, large flux variances remain at these locations even after subtraction. For each wavelength in a reduced mask, we calculate the median variance per pixel on sky in the spatial direction, and derive thresholds above which wavelengths are determined to be contaminated by either weak or strong sky lines. Strong sky lines are masked, while weak lines are interpolated over. More details on this process are given in Appendix C. For plotting purposes, we filled masked wavelengths by using an inverse variance weighted average of nearby wavelengths which are not associated with sky lines.
A custom Python code was also written to perform telluric correction using stars observed in mask slits. The method is briefly described here, while a more detailed description, as well as a comparison to standard star telluric correction is provided in Appendix D. Briefly, we used the spectra of stars observed on the slits within each mask to obtain a telluric correction by fitting PHOENIX stellar models (Husser et al., 2013) to the NIR photometry of each star to obtain a model spectrum. The ratio of the model to the observed stellar spectrum was taken to be the telluric correction and was applied to all slits on a given mask. When multiple stars were observed on a mask, the resultant telluric corrections were coadded using inverse variance weighting of the spectral errors. As the subsequent fitting procedure scales the spectra to match the photometry, we were here only concerned with the correction of the spectra in terms of shape.
| UMG | SFR | (Gyr) | (Gyr) | |||||
|---|---|---|---|---|---|---|---|---|
| COS-DR3-202019 | ||||||||
| XMM-VID3-2293 | ||||||||
| XMM-VID1-2075 | ||||||||
| XMM-VID3-1120 | ||||||||
| COS-DR3-160748 | ||||||||
| COS-DR3-201999 | ||||||||
| COS-DR3-179370 | ||||||||
| COS-DR3-195616 | ||||||||
| COS-DR3-208070 | ||||||||
| XMM-VID3-2457 | ||||||||
| COS-DR3-84674 | ||||||||
| COS-DR1-113684 | ||||||||
| COS-DR3-131925 | ||||||||
| COS-DR3-226441 | ||||||||
| XMM-VID1-2399 | ||||||||
| COS-DR3-111740 | ||||||||
| COS-DR1-79837 | — | — | — | — | — | |||
| XMM-VID3-3941 | — | — | — | — | ||||
| XMM-VID1-2761 | — | — | — | — | — | |||
| COS-DR1-258857 | — | — | — | — | — | |||
| XMM-VID2-270 | — | — | — | — | — |
4 Analysis
In order to determine spectroscopic redshifts we used a combination of the programs slinefit666https://github.com/cschreib/slinefit and FAST++777https://github.com/cschreib/fastpp (Schreiber et al., 2018a), a variation of the popular FAST program (Kriek et al., 2011) which fits to both photometric and spectroscopic data. FAST++ allows for different functional star formation histories (SFHs), scaling of spectra to match photometry, and fitting of spectra with different wavelength resolutions, among many other features. The program slinefit fits spectra with emission (and absorption) features across a range of redshifts using gaussians of varying widths and amplitudes. In this work, we are concerned with fitting [Oii] (line ratio fixed to unity), , and [Oiii] (line ratio fixed to 0.3) for the UMGs and galaxies at similar redshifts. The program also allows for continuum fitting to enable more accurate characterization of line properties such as equivalent widths.
4.1 Fitting Photometric and Spectroscopic Data with FAST++
In fitting with FAST++ we use stellar population models from Bruzual & Charlot (2003, BC03) with a starburst dust law (Calzetti et al., 2000). We used the following grids for various input parameters:
In general, metallicity was fixed to , as several studies have shown this to be broadly correct for high-redshift massive galaxies (e.g., Belli et al., 2019; Kriek et al., 2019; Estrada-Carpenter et al., 2019, Jafariyazani et al., in prep; but also see Saracco et al. 2020 for a spectroscopic measurement of super-solar stellar metallicity for one of our galaxies, COS-DR3-160748). However, we did test metallicities of and as well, which yielded only slightly worse fits to the data, and not significantly different galaxy properties.
Velocity dispersion, which must be fixed for each run of FAST++, was set to 300 km/s. While velocity dispersions of similar galaxies at these redshifts and masses are rare, Tanaka et al. (2019) calculate km/s for a galaxy at with 11. Their Figure 4 also presents published velocity dispersions for massive quiescent galaxies at , which range from to km/s and show a slight positive correlation with stellar mass. A more in-depth analysis of velocity dispersions is beyond the scope of this work.
Characterizing the SFHs of these galaxies addresses directly the potential identification of the population from which they descended. Additionally, the maximum SFR and the time at which these galaxies quenched inform models of star formation in the young cosmos, and can provide important insights into the evolution of massive galaxies in the local universe. Here we test both a delayed exponentially declining SFH888SFR() (using the parameter grid above) as well as a double exponential SFH:
| (1) | |||
| (2) |
This SFH has been used in other works studying massive galaxies at high redshift (Schreiber et al., 2018a; Valentino et al., 2020; Forrest et al., 2020), and we adopt the same parameter grid described therein:
We emphasize that while the exact shape of the best-fit SFH is model-dependent and can vary depending upon assumptions of the parametric form, general characteristics, such as when the majority of stars were formed and when the galaxy quenched, can be well constrained provided that the SFH inputs are sufficiently flexible and appropriate for the object in question. In particular, Belli et al. (2019) show that various SFH parameterizations yield similar values of star forming timescale and sSFR. We find the same for the delayed- and double-exponential models described here, and will use values from the double-exponential fits in the remainder of the work.
4.2 Redshift Determination and Template Fitting for Absorption Line UMGs
When stellar continuum is detected with no clear emission features, we use FAST++ to determine the redshift. For galaxies with spectra in both the - and -bands, we fit the spectrum of each band combined with the photometry independently in order to remove differences in flux scaling between the spectra when matching the photometry. The two spectra are then scaled relative to each other and refit in combination with the photometry. This relative rescaling between bands can be up to 15% depending on the accuracy of the flux calibration factor in the slit star telluric correction.
For redshift fitting, we fit to the combined photometry and spectroscopy of the galaxy in question. We do three runs per galaxy, the first with the model redshifts ranging with to obtain an initial fit, ,0, and a second run with model redshifts and to obtain a final . While these two runs are completed with a delayed- SFH, the third run uses a double-exponential SFH with the possibility of additional low levels of late-time star formation (see Section 4.1, as well as Schreiber et al., 2018b, a). This SFH is more computationally intensive and thus having the redshift fixed to improves runtime significantly. More details on the fitting input parameters are given in Section 4.1.
We subsequently run slinefit on the spectrum, with the best-fit model from FAST++ used as the stellar continuum template. This allows for measurement or limits on the strength of weak emission features in these galaxies. This does not affect the redshift determination at all, only the line measurements. Final line fluxes and equivalent widths are presented in Table 2.
4.3 Redshift Determination and Template Fitting for Emission Line UMGs
For galaxies where emission features are detected we use slinefit to determine the spectroscopic redshift, . In this first fit we use a set of high resolution galaxy spectral templates based on those provided in EAzY (Brammer et al., 2008) to generate a stellar continuum on top of which to fit lines. The resultant is then fixed when fitting with FAST++.
Before fitting these galaxies with FAST++ however, we must correct the observed photometry for the effects of the emission lines, as the template libraries do not include them. To do this, the observed magnitude is converted to a total flux by multiplying the average flux density by the width of the bandpass. In the -band, the photometric flux is reduced by the sum of the emission line fluxes,
| (3) |
where the line fluxes are taken from the model output of slinefit.
In most cases, we do not have -band spectra, and so we must estimate the effects of photometric contamination by [Oii].
We do this by making the following assumptions:
1) the [Oii] line flux is due to a combination of star formation and AGN activity,
| (4) |
2) case B recombination can be used to obtain a SFR from (Kennicutt, 1998; Moustakas et al., 2006),
| (5) | |||||
| (6) | |||||
| (7) |
where is in units of erg s-1 and SFRs are in units of M⊙ yr-1.
3) the SFR derived from is equal to that derived from [Oii],
| (8) | |||||
| (9) |
4) the ratio of [Oiii] to [Oii] due to AGN activity is given by typical values (Silverman et al., 2009)
| (10) |
Tying all these pieces together leaves us with an [Oii] line flux estimation as a function of the and [Oiii] line fluxes observed in the -band spectra. Equation 4 then becomes
| (11) |
and we can correct the -band photometry accordingly
| (12) |
We note that while the various assumptions made in these calculations may not be accurate in every case, the typical effect of the -band photometric correction is only a few percent, and a factor of two in the correction does not change the resultant best-fit parameters for the equations significantly, particularly since the spectroscopic redshift is known. Furthermore, any effects of dust would only decrease the strength of [Oii] relative to and [Oiii] thus any correction would be smaller than calculated here.
Next we use FAST++ to fit the galaxy with the redshift fixed to that obtained with slinefit. For this process we input the corrected photometry, as well as spectra with the emission line regions masked, again due to the fact that the template libraries in use do not include emission features. As above, galaxies with spectra in both the - and -bands are fit with each spectral band independently and then scaled to match the entire spectrum. Once a best-fit template is obtained from FAST++ we then repeat the entire process, i.e., we rerun slinefit with the best fit FAST++ template input as the continuum model, use the resulting revised line strength estimates to recorrect the photometry, and refit with FAST++. In all cases, the new line flux and equivalent width values are similar to the initial values, with differences of .
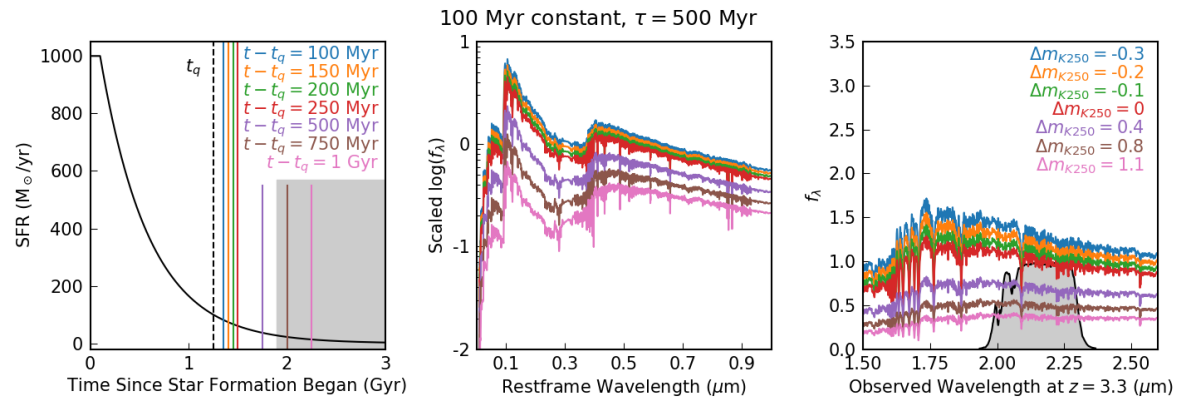
The spectroscopic and photometric redshifts agree quite well (see Figure 1 and Table 1), with for the UMGs. As defined in Brammer et al. (2008),
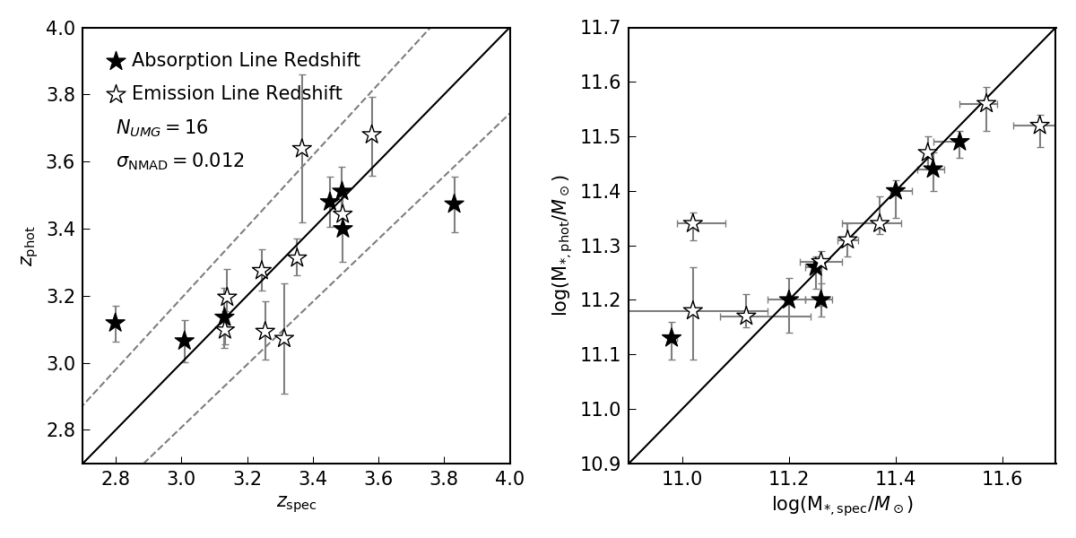
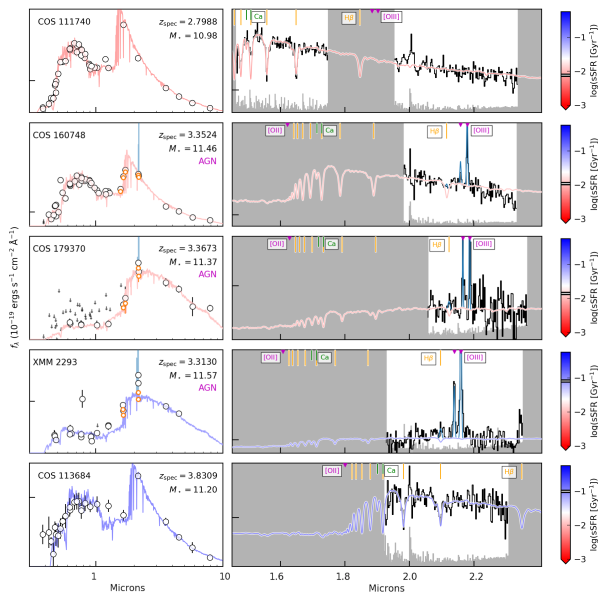
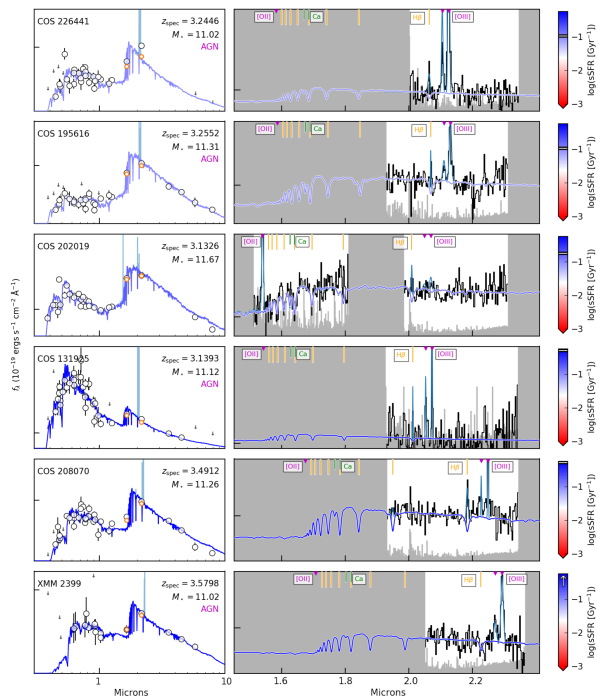
Similarly, the final stellar masses agree very well with those derived from the photometric catalogs alone. The largest discrepancies occur for galaxies with strong emission line contamination and one with a large redshift discrepancy. Best-fit spectral models are shown plotted with the observed photometry and spectra in Figures 2, 3, and 4. These figures also show the line fits and effects of photometric corrections for line emission.
| UMG | ([Oii]) | SFR[OII] | (4000) | (H) | (H) | SFRHβ999This calculation assumes all flux from the line is due to star formation. This may be considered an upper limit for those galaxies which host AGN. | ([Oiii]) | ([Oiii]) | ||||
|---|---|---|---|---|---|---|---|---|---|---|---|---|
| COS-DR3-202019 | ||||||||||||
| XMM-VID3-2293101010, consistent with AGN at these large stellar masses. | ||||||||||||
| XMM-VID1-2075 | ||||||||||||
| XMM-VID3-1120 | ||||||||||||
| COS-DR3-160748b | ||||||||||||
| COS-DR3-201999b | ||||||||||||
| COS-DR3-179370 | ||||||||||||
| COS-DR3-195616b | ||||||||||||
| COS-DR3-208070 | ||||||||||||
| XMM-VID3-2457 | ||||||||||||
| COS-DR3-84674 | ||||||||||||
| COS-DR1-113684 | ||||||||||||
| COS-DR3-131925b | ||||||||||||
| COS-DR3-226441b | ||||||||||||
| XMM-VID1-2399b | ||||||||||||
| COS-DR3-111740 |
5 Results
5.1 Absorption Line Galaxies
Of the 16 confirmed UMGs in the sample, 7 show well-detected absorption features and lack emission features. Five of these absorption-line galaxies are UVJ-quiescent residing in the lower region of the quiescent wedge typically associated with young post-starburst galaxies. Notably, XMM-VID3-1120 was published in Forrest et al. (2020) as XMM-2599 - the updated identifier is due to a new catalog version.
The remaining two absorption line galaxies (COS-DR3-111740, , and COS-DR1-113684, ) are at redshifts where a combination of the wavelength coverage of MOSFIRE, and position of the object on the chip, and the bandpasses observed do not allow access to the [Oii], , or [Oiii] emission features, and as such, emission features could be present. This also results from the spectroscopic redshifts of these two objects being discrepant from their photometric redshifts - indeed, they are clear outliers on Figure 1. Both have similar UVJ colors and SEDs to COS-DR3-160748 (discussed below), consistent with galaxies that have very recently ceased forming new stars, or have small residual amounts of star formation.
5.2 Emission Line Galaxies
The remaining 9 UMGs show clear emission features with SNR from [Oii] or [Oiii]. Of these, 7 have a line ratio (labeled in Table 2 and Figures 2, 3, 4), which is typically associated with AGN activity, especially at high mass (e.g., Baldwin et al., 1981; Juneau et al., 2011; Trump et al., 2013; Kewley et al., 2013; Shapley et al., 2015; Strom et al., 2017; Reddy et al., 2018). This agrees with numerous previous studies which suggest that AGN activity is more common at high redshifts (e.g., Marsan et al., 2017), though this is the largest spectroscopic sample of this mass and redshift to be analyzed.
One of these, COS-DR3-160748 was first spectroscopically confirmed in Marsan et al. (2015), and a deep spectrum has recently been analyzed in Saracco et al. (2020, submitted). Stellar masses derived in all three works are in rough agreement ( ), as are the conclusions that an AGN exists in this galaxy and there is little ongoing star formation.
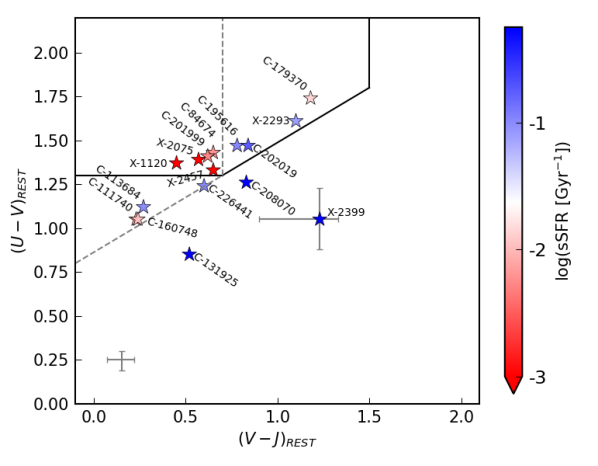
5.3 Rest-Frame Colors
Figure 5 shows the spectroscopically confirmed galaxies on the restframe UVJ color-color diagram, which has been well-used as a discriminator between star-forming and quiescent galaxies (e.g., Labbé et al., 2006; Williams et al., 2009; Forrest et al., 2018; Schreiber et al., 2018a). However, at high redshifts, the clear bimodality in colors between these populations appears to erode, no longer providing a selection as pure as at lower redshifts (e.g., Whitaker et al., 2011; Muzzin et al., 2013; Straatman et al., 2016). Part of the reason for this is that galaxies can be passive for up to several hundred Myr (depending on SFH) before their colors reach the quiescent wedge on the UVJ diagram (Merlin et al., 2018). While this is a short time relative to the lifetime of local galaxies, it is non-negligible in the high-redshift universe, and thus one would expect a larger fraction of galaxies to be observed in such a phase.
Schreiber et al. (2018a) suggest simply extending the diagonal wedge line to bluer colors for samples of massive galaxies, though they then encounter some star-forming contaminants in the resulting selection. We add this extension in Figure 5 and find that 3 additional UMGs are included in the resulting quiescent wedge. All have SEDs with small amounts of UV flux, consistent with low levels of star formation as would be expected in a galaxy that has recently undergone a starburst event and is now quenching its star formation, as well as very blue (V-J) indicating a lack of an older, passive stellar population.
Three galaxies with strongly detected emission lines are also UVJ-quiescent, even when accounting for the effects of their emission features. Two of these have large [Oiii]/ ratios, implying that their emission lines are due to AGN activity and not ongoing star formation, while the third has clear [Oii] emission and negligible [Oiii] suggestive of some ongoing star formation. We thus conclude that the standard UVJ diagram, while still doing a decent job of separating star-forming and quiescent galaxies, provides neither a complete nor pure selection of either population at this mass and redshift regime.
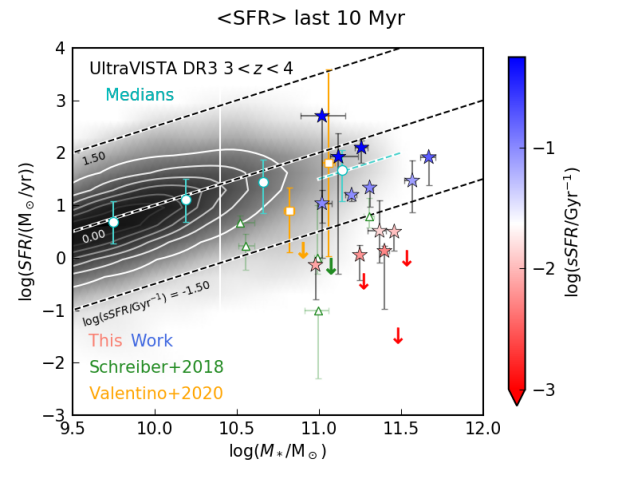
5.4 Star Formation Rates
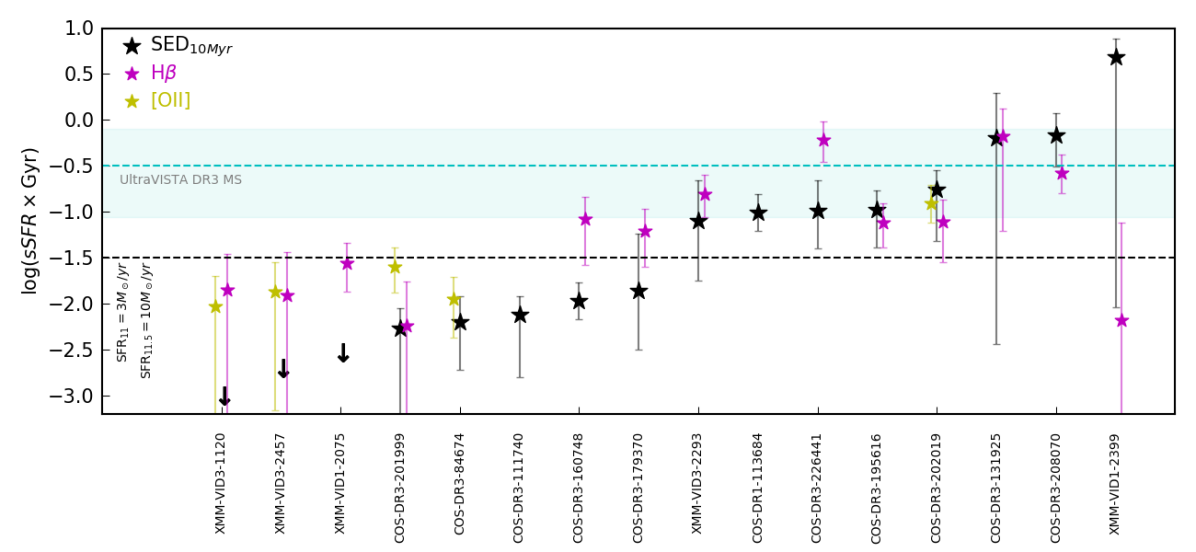
We compare the UMGs on the SFR vs. stellar-mass plane to other galaxies in the UltraVISTA DR3 catalogs (Muzzin et al., in prep), for which the SFRs and stellar masses were calculated using an exponentially declining SFH (Figure 6). All SFRs plotted here are averages over the last 10 Myr as calculated from each galaxy’s best-fit SFH. Using the instantaneous SFR or averaging over 100 Myr does not make any significant difference to our conclusions. The absorption line UMGs fall at least one dex below the star-forming main sequence (SFMS), clearly consistent with galaxies having highly inhibited, if not completely quenched, star formation. This is also the case for several other massive galaxies from Schreiber et al. (2018a). The confirmed emission line galaxies are generally consistent with the SFMS, though they average only (sSFR [Gyr-1] , or SFR M⊙/yr.
In addition to the SFRs derived from the emission-line corrected photometry and masked spectroscopy, we also derive SFRs from and [Oii] lines when observed in the spectra, providing other probes of star formation. Comparing the results of these star formation indicators is important in assessing their accuracy, and we show this in Figure 7. Though these probes do measure star formation over slightly different timescales, agreement between various measurements for individual galaxies is quite good. In logarithmic space the differences are most significant for low sSFR, but differences in absolute terms here are on the order of .
5.5 Stellar Ages
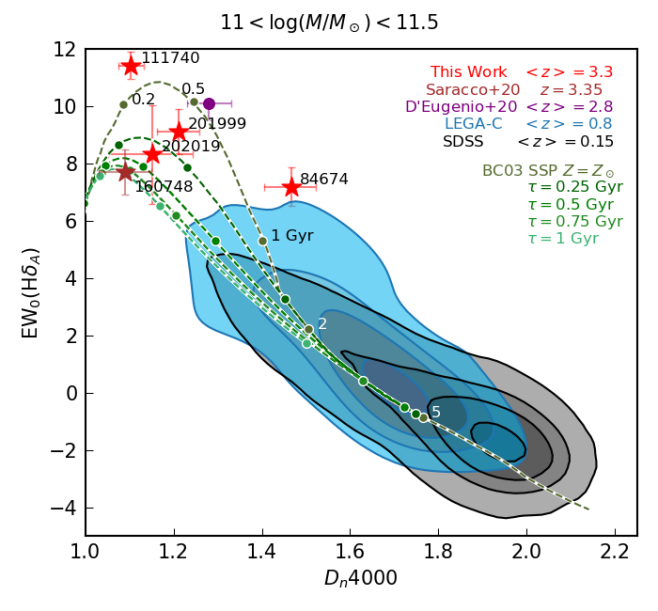
The spectral indices (4000) and (H) (Balogh et al., 1999) combine to form an effective probe of stellar age which breaks a degeneracy with metallicity (e.g., Kauffmann et al., 2003). In the local universe, massive galaxies tend to show larger (4000) and lower (H), as they quenched long ago, while less massive galaxies, on average containing younger stellar populations have lower (4000) and higher (H).
We are able to measure both spectral features for four of the UMGs, and use published values for a fifth using spectra from LBT/LUCI in Saracco et al. (2020, submitted). The spectral wavelength coverage of the other UMGs does not allow for one or both measurements due to different redshifts and bandpasses observed. These are shown in Figure 8, along with large samples of massive galaxies at and published in Wu et al. (2018). Also plotted is a stack of massive galaxies at from D’Eugenio et al. (2020). Taken together, these data paint a picture showing the most massive galaxies at high redshifts are younger than galaxies of similar mass at lower redshifts. This makes sense due to the younger age of the universe, as well as numerous studies suggesting that high-mass galaxies appear to have formed much of their stellar mass at earlier times than lower mass galaxies at a given epoch (e.g., Pacifici et al., 2016; Bellstedt et al., 2020). Indeed when compared to various evolutionary tracks, the UMGs are consistent with stellar ages of 200-800 Myr.
5.6 Star Formation Histories
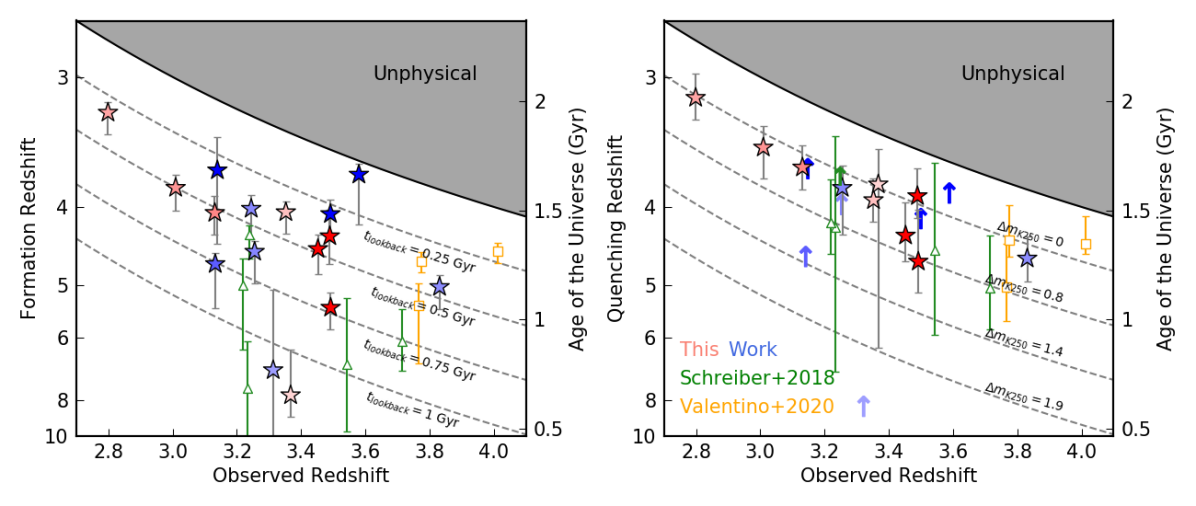
These ages can be compared to the ages determined from the best-fit SFHs of the modeling. As a reminder, we use FAST++ to simultaneously fit the photometry and spectroscopy, and thereby derive the formation lookback time, by which point half of the observed stellar mass has been formed, and the quenching lookback time, at which time star formation in a galaxy has fallen below 10% of the average during the main burst of star formation (Table 1). While a double-exponential SFH parameterization is used, conclusions do not change if a delayed-exponential profile is used instead (see Section 4.1).
Using this methodology, the resulting best-fit SFHs show short (median timescale of 120 Myr), intense (median of 1500 M⊙/yr) bursts of star formation responsible for the vast majority of stellar mass growth. These bursts occurred in the past, consistent with the ages surmised from spectral indices above. Following this, star formation rates truncated quickly. UMG quenching times are narrowly constrained to lookback times of for those UMGs no longer forming stars, and the median value is 310 Myr (Figure 9). This quenching happens rapidly with median timescale Myr. The derived timescales are in good agreement with those from Saracco et al. (2020), which performed an independent analysis on deeper H+K spectra for COS-DR3-160748.
5.6.1 Rapidly Star-forming Progenitors
The confirmation of a number of highly dust-obscured massive star-forming galaxies at (Capak et al., 2011; Riechers et al., 2013; Ma et al., 2015; Riechers et al., 2017; Strandet et al., 2017; Marrone et al., 2018; Pavesi et al., 2018; Zavala et al., 2018; Jin et al., 2019) has raised the question of how these galaxies evolve and what their descendants look like. Naturally, massive quiescent galaxies must be an eventual evolutionary stage, as these galaxies cannot continue forming stars at the observed rates for more than several hundred Myr (assuming no large inflows of cool gas to use as fuel). The idea that such galaxies might be the progenitors of lower redshift massive quiescent galaxies has been suggested in previous works (e.g., Toft et al., 2014; Belli et al., 2019; Forrest et al., 2020).
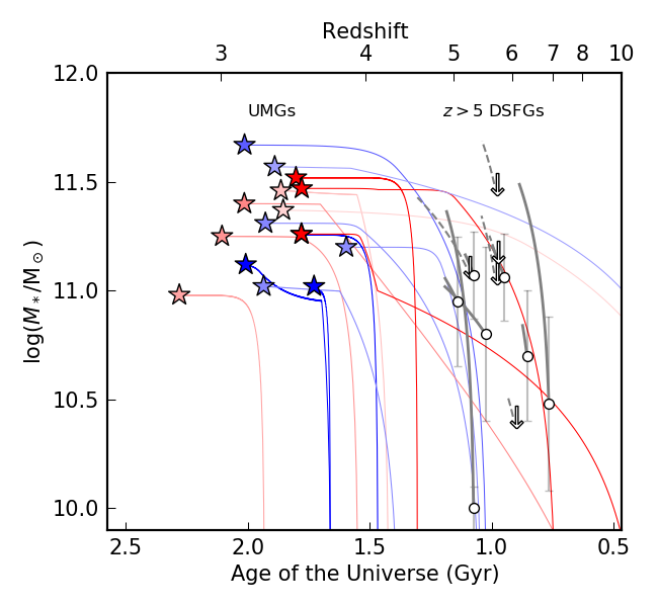
It now appears that significant numbers of these dust-obscured galaxies exist at , many of which may not be photometrically-detected in the optical or even the - and bandpasses due to large amounts of dust (Wang et al., 2019; Williams et al., 2019; Riechers et al., 2020). The inferred number densities of these objects has also increased as a result of larger and deeper surveys with ALMA (e.g., Riechers et al., 2020), and agree with number densities of UMGs (star-forming and quiescent combined) observed photometrically at which has been found to be about Mpc-3 (Schreiber et al., 2018a, Marsan et al. 2020, in prep). Of course since star-forming UMGs contribute to this number density, it is unreasonable to assume that all DSFGs are quenched by (see Valentino et al., 2020, for an in depth discussion), though it seems reasonable to assume that the progenitors of the quiescent UMGs were at one time starbursts very similar to these DSFGs. Best-fit SFHs suggest that this period of intense star formation occurred at for the majority of the UMGs (Figure 10), perhaps also suggesting the existence of fainter, quenched UMGs as descendants of the DSFG population.
Indeed, the evolution of the most massive early-type galaxies in the local Universe along a path involving rapid star-formation as a DSFG at , quenching around , and subsequent stellar mass growth via mergers is supported by several lines of evidence. Studies of local galaxies suggest a scenario in which the most massive galaxies formed their stars in bursts at very early times (e.g., Kauffmann et al., 2003; Gallazzi et al., 2005; Thomas et al., 2010; Smith et al., 2012), with subsequent mass growth dominated by mergers (Hill et al., 2017). The size growth of quiescent galaxies from compact at high redshift objects to more extended at lower redshifts is also consistent with being merger-driven (e.g., Barro et al., 2013; Kubo et al., 2018; Estrada-Carpenter et al., 2020). The quenching timescales presented here for such a large sample of UMGs at convincingly support this evolutionary hypothesis of the most massive galaxies.
5.6.2 On the Possibility of Older, Quiescent Galaxies
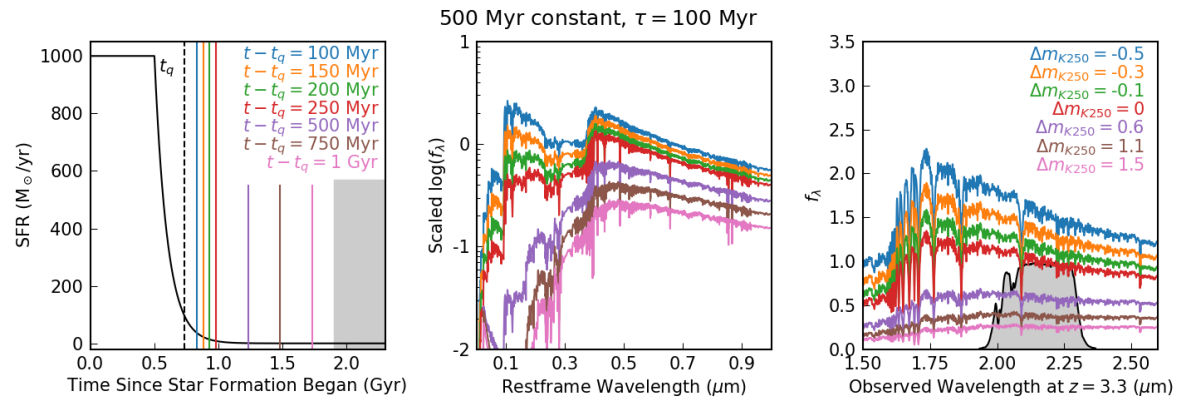
The quenching timescales derived for this sample suggest that all the quiescent UMGs are younger post-starburst galaxies, and not old, long-dead passive populations. Indeed at this epoch, no such old passive populations have been spectroscopically confirmed (D’Eugenio et al., 2020), which we also find when comparing the UMGs presented here to those published in Schreiber et al. (2018a) and Valentino et al. (2020). While the age of the universe at is quite young, there is still sufficient time for a UMG to have formed its stars, quenched, and evolved passively for perhaps as long as 1 Gyr by , especially given the short timescales on which UMGs at this epoch appear to form their stars (Schreiber et al., 2018a; Valentino et al., 2020; Forrest et al., 2020, Saracco et al. 2020).
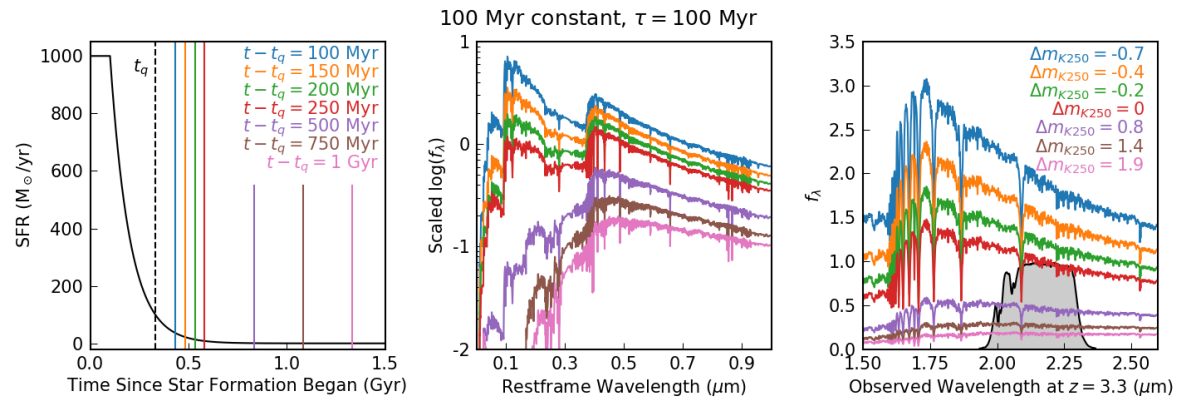
Such a galaxy would be considerably fainter than a post-starburst however, and selection for spectroscopic follow-up is necessarily biased towards brighter targets. We quantify this magnitude difference by generating galaxy SEDs at various stages of evolution according to several SFHs using BC03 SPS models. Solar metallicity models are used, as this metallicity has been shown to be roughly appropriate for these massive, early galaxies (Belli et al., 2019, Saracco et al. 2020, submitted). We take the SED at several timesteps in this evolution, redshift it to (the median redshift of the sample), and calculate the magnitude in the -band (see Figure 11, as well as Appendix E for details). Compared to a baseline observation of 0.25 Gyr after the simulated galaxy quenches (roughly consistent with the quenched UMGs), a galaxy observed 1 Gyr after quenching would be 1-2 magnitudes fainter in the -band depending upon the SFH, corresponding to and fainter than the magnitude cut used here. For an object observed at , this would correspond to , and would require extreme star formation just prior to this time, consistent with the DSFG HFLS-3 (Riechers et al., 2013; Cooray et al., 2014).
Galaxies with the requisite -band magnitudes, photometric redshifts, stellar masses, as well as red UVJ colors do exist in the UltraVISTA DR3 catalog. There are 56 objects with photometric fits suggesting , , and SFR M⊙/yr, 47 of which are fainter than . Of the nine brighter targets, we targeted and confirmed three - COS-DR3-84674, COS-DR3-111740, and COS-DR3-201999, two of which are post-starbursts, and one of which is at a lower redshift. The faintest of the spectroscopically confirmed UMGs (COS-DR3-179370) has , but we note that this was confirmed via detection of strong emission lines.
The fainter candidate objects generally have lower photometric signal-to-noise, leading to less well constrained photometric redshifts and template fits. As a result, selecting reliable candidates at fainter magnitudes from the existing photometry for spectroscopic follow-up is more difficult. Targeting these candidate old red galaxies with instruments such as Keck/MOSFIRE would require multiple nights to confirm their redshifts and natures through high signal-to-noise detection of stellar continuum features. Still, the intriguing possibility of older, more passive galaxies at this early time does exist. Proving it will require significant time investment either from the ground (several nights on 8-10 m class telescopes) or from space (e.g., JWST). Upcoming 30 m class telescopes could also play an important role in confirming these objects as well.
6 Conclusions
We have presented the largest sample to date of spectroscopically confirmed ultra-massive galaxies with at . The sample is selected from the COSMOS-UltraVISTA and XMM-VIDEO fields which have a critical combination of impressive depth and area, allowing these catalogs to excel at finding such rare objects. Galaxies with well-defined SEDs were observed as part of the MAGAZ3NE survey with the Keck/MOSFIRE instrument in the -band, where strong emission lines from and [Oiii] are observed in 9/16 UMGs. The -band was also used to confirm redshifts via detection of Balmer series absorption, which is clearly visible in all 6 UMGs targeted, and also to confirm any [Oii] emission. The confirmation of this population is further evidence that such massive galaxies form the vast majority of their stars early in the universe.
While these UMGs show a wide range of SFRs, at least 5/16 have ceased star formation in the last several hundred Myr (post-starbursts), and 3 others only have residual amounts of new star formation ongoing ( M⊙/yr), which puts them dex below the star-forming main sequence for galaxies of this redshift and mass. The remainder are forming at least 10 M⊙/yr, and two UMGs are consistent with SFR M⊙/yr.
Of those with emission features, 7 show line ratios of [Oiii]/ , typically observed in such massive galaxies only with AGN activity. This is consistent with previous studies suggesting that massive galaxies at these early times are often AGN hosts, and that AGN feedback may play a significant role in quenching star formation in this population.
We compare the (4000) and (H) values for five of the UMGs to high mass galaxies at lower redshifts as well as stellar evolution models. The most massive galaxies at higher redshifts are younger, with the sample suggesting the bulk of stars were formed Gyr before observation.
The build up of stellar mass from the best-fit SFHs for some of these UMGs are consistent with DSFGs, again suggesting that a period of intense star formation is a critical step in the evolution of this population before quenching star formation at . This is also consistent with the SFHs derived for massive local galaxies from stellar archaeology.
Fitting the full multi-wavelength SEDs (corrected for emission line contamination) and the near-IR spectroscopy yield best-fit SFHs which similarly indicate that most star formation occurred at in short-lived, explosive bursts of M⊙/yr for Myr before quenching rapidly. While several of the UMGs have quenched before as in Forrest et al. (2020), most UMGs which have quenched their star formation did so around Myr before observation, and we do not confirm any significantly evolved passive galaxies, implying that post-starbursts are the most evolved galaxies in the massive population at this epoch. However, the possibility of older, more passive galaxies does exist, even at this remarkably early time. Identifying compelling candidates will require deeper NIR photometry, and spectroscopically confirming them will require substantial observations with either large ground-based instruments or sensitive space-based telescopes.
7 Acknowledgements
The authors wish to recognize and acknowledge the very significant cultural role and reverence that the summit of Maunakea has always had within the indigenous Hawaiian community. We are most fortunate to have the opportunity to conduct observations from this mountain. Additionally, we thank the anonymous referee for suggestions that improved the manuscript.
This work is supported by the National Science Foundation through grants AST-1517863, AST-1518257, and AST-1815475, by HST program number GO-15294, and by grant numbers 80NSSC17K0019 and NNX16AN49G issued through the NASA Astrophysics Data Analysis Program (ADAP). Support for program number GO-15294 was provided by NASA through a grant from the Space Telescope Science Institute, which is operated by the Association of Universities for Research in Astronomy, Incorporated, under NASA contract NAS5-26555. Further support was provided by the Faculty Research Fund (FRF) of Tufts University and by Universidad Andrés Bello grant number DI-12-19/R. M.N. acknowledges INAF 1.05.01.86.20 and PRIN MIUR F.OB. 1.05.01.83.08. Data presented herein were obtained using the UCI Remote Observing Facility, made possible by a generous gift from John and Ruth Ann Evans.
This work has relied heavily upon code developed by other people, for which we are quite thankful.
References
- Alcalde Pampliega et al. (2019) Alcalde Pampliega, B., Pérez-González, P. G., Barro, G., et al. 2019, The Astrophysical Journal, 876, 135, doi: 10.3847/1538-4357/ab14f2
- Ashby et al. (2018) Ashby, M. L. N., Caputi, K. I., Cowley, W., et al. 2018, The Astrophysical Journal Supplement Series, 237, 39, doi: 10.3847/1538-4365/aad4fb
- Baldwin et al. (1981) Baldwin, J. A., Phillips, M. M., & Terlevich, R. 1981, Publications of the Astronomical Society of the Pacific, 93, 5, doi: 10.1086/130766
- Balogh et al. (1999) Balogh, M. L., Morris, S. L., Yee, H. K. C., Carlberg, R. G., & Ellingson, E. 1999, The Astrophysical Journal, 527, 54, doi: 10.1086/308056
- Banerji et al. (2015) Banerji, M., Jouvel, S., Lin, H., et al. 2015, Monthly Notices of the Royal Astronomical Society, 446, 2523, doi: 10.1093/mnras/stu2261
- Barro et al. (2013) Barro, G., Faber, S. M., Pérez-González, P. G., et al. 2013, The Astrophysical Journal, 765, 104, doi: 10.1088/0004-637X/765/2/104
- Belli et al. (2017) Belli, S., Newman, A. B., & Ellis, R. S. 2017, The Astrophysical Journal, 834, 18, doi: 10.3847/1538-4357/834/1/18
- Belli et al. (2019) —. 2019, The Astrophysical Journal, 874, 17, doi: 10.3847/1538-4357/ab07af
- Belli et al. (2014) Belli, S., Newman, A. B., Ellis, R. S., & Konidaris, N. P. 2014, Astrophysical Journal Letters, 788, doi: 10.1088/2041-8205/788/2/L29
- Bellstedt et al. (2020) Bellstedt, S., Robotham, A. S. G., Driver, S. P., et al. 2020. https://arxiv.org/abs/2005.11917
- Brammer et al. (2008) Brammer, G. B., van Dokkum, P. G., & Coppi, P. 2008, The Astrophysical Journal, 686, 1503, doi: 10.1086/591786
- Bruzual & Charlot (2003) Bruzual, G., & Charlot, S. 2003, Monthly Notices of the Royal Astronomical Society, 344, 1000, doi: 10.1046/j.1365-8711.2003.06897.x
- Calzetti et al. (2000) Calzetti, D., Armus, L., Bohlin, R. C., et al. 2000, The Astrophysical Journal, 533, 682, doi: 10.1086/308692
- Capak et al. (2011) Capak, P. L., Riechers, D., Scoville, N. Z., et al. 2011, Nature, 470, 233, doi: 10.1038/nature09681
- Chabrier (2003) Chabrier, G. 2003, Publications of the Astronomical Society of the Pacific, 115, 763, doi: 10.1086/376392
- Ciesla et al. (2017) Ciesla, L., Elbaz, D., & Fensch, J. 2017, Astronomy & Astrophysics, 608, A41, doi: 10.1051/0004-6361/201731036
- Cimatti et al. (2004) Cimatti, A., Daddi, E., Renzini, A., et al. 2004, Nature, 430, 184, doi: 10.1038/nature02668
- Cooray et al. (2014) Cooray, A., Calanog, J., Wardlow, J. L., et al. 2014, The Astrophysical Journal, 790, 40, doi: 10.1088/0004-637X/790/1/40
- Crain et al. (2015) Crain, R. A., Schaye, J., Bower, R. G., et al. 2015, Monthly Notices of the Royal Astronomical Society, 450, 1937, doi: 10.1093/mnras/stv725
- Davé et al. (2016) Davé, R., Thompson, R., & Hopkins, P. F. 2016, Monthly Notices of the Royal Astronomical Society, 462, 3265, doi: 10.1093/mnras/stw1862
- D’Eugenio et al. (2020) D’Eugenio, C., Daddi, E., Gobat, R., et al. 2020, The Astrophysical Journal, 892, L2, doi: 10.3847/2041-8213/ab7a96
- Dunlop et al. (1996) Dunlop, J., Peacock, J., Spinrad, H., et al. 1996, Nature, 381, 581, doi: 10.1038/381581a0
- Einstein & de Sitter (1932) Einstein, A., & de Sitter, W. 1932, Proceedings of the National Academy of Sciences, 18, 213, doi: 10.1073/pnas.18.3.213
- Estrada-Carpenter et al. (2019) Estrada-Carpenter, V., Papovich, C., Momcheva, I., et al. 2019, The Astrophysical Journal, 870, 133, doi: 10.3847/1538-4357/aaf22e
- Estrada-Carpenter et al. (2020) —. 2020. https://arxiv.org/abs/2005.12289
- Feldmann et al. (2016) Feldmann, R., Hopkins, P. F., Quataert, E., Faucher-Giguère, C. A., & Kerěs, D. 2016, Monthly Notices of the Royal Astronomical Society: Letters, 458, L14, doi: 10.1093/mnrasl/slw014
- Forrest et al. (2016) Forrest, B., Tran, K.-V. H., Tomczak, A. R., et al. 2016, The Astrophysical Journal, 818, L26, doi: 10.3847/2041-8205/818/2/L26
- Forrest et al. (2018) Forrest, B., Tran, K.-V. H., Broussard, A., et al. 2018, The Astrophysical Journal, 863, 131, doi: 10.3847/1538-4357/aad232
- Forrest et al. (2020) Forrest, B., Annunziatella, M., Wilson, G., et al. 2020, The Astrophysical Journal, 890, L1, doi: 10.3847/2041-8213/ab5b9f
- Gallazzi et al. (2005) Gallazzi, A., Charlot, S., Brinchmann, J., White, S. D., & Tremonti, C. A. 2005, Monthly Notices of the Royal Astronomical Society, 362, 41, doi: 10.1111/j.1365-2966.2005.09321.x
- Gargiulo et al. (2016) Gargiulo, A., Saracco, P., Tamburri, S., Lonoce, I., & Ciocca, F. 2016, Astronomy and Astrophysics, 592, 1, doi: 10.1051/0004-6361/201526563
- Genel et al. (2014) Genel, S., Vogelsberger, M., Springel, V., et al. 2014, Monthly Notices of the Royal Astronomical Society, 445, 175, doi: 10.1093/mnras/stu1654
- Glazebrook et al. (2017) Glazebrook, K., Schreiber, C., Labbé, I., et al. 2017, Nature Publishing Group, 544, 71, doi: 10.1038/nature21680
- Gobat et al. (2012) Gobat, R., Strazzullo, V., Daddi, E., et al. 2012, The Astrophysical Journal, 759, L44, doi: 10.1088/2041-8205/759/2/L44
- Grogin et al. (2011) Grogin, N. A., Kocevski, D. D., Faber, S. M., et al. 2011, The Astrophysical Journal Supplement Series, 197, 35, doi: 10.1088/0067-0049/197/2/35
- Guarnieri et al. (2019) Guarnieri, P., Maraston, C., Thomas, D., et al. 2019, Monthly Notices of the Royal Astronomical Society, 483, 3060, doi: 10.1093/mnras/sty3305
- Henriques et al. (2015) Henriques, B. M. B., White, S. D. M., Thomas, P. A., et al. 2015, Monthly Notices of the Royal Astronomical Society, 451, 2663, doi: 10.1093/mnras/stv705
- Hill et al. (2017) Hill, A. R., Muzzin, A., Franx, M., et al. 2017, The Astrophysical Journal, 837, 147, doi: 10.3847/1538-4357/aa61fe
- Hopkins et al. (2014) Hopkins, P. F., Kereš, D., Oñorbe, J., et al. 2014, Monthly Notices of the Royal Astronomical Society, 445, 581, doi: 10.1093/mnras/stu1738
- Horne (1986) Horne, K. 1986, Publications of the Astronomical Society of the Pacific, 98, 609, doi: 10.1086/131801
- Hunter (2007) Hunter, J. D. 2007, Computing in Science and Engineering, doi: 10.1109/MCSE.2007.55
- Husser et al. (2013) Husser, T.-O., Wende-von Berg, S., Dreizler, S., et al. 2013, Astronomy & Astrophysics, 553, A6, doi: 10.1051/0004-6361/201219058
- Jarvis et al. (2013) Jarvis, M. J., Bonfield, D. G., Bruce, V. A., et al. 2013, Monthly Notices of the Royal Astronomical Society, 428, 1281, doi: 10.1093/mnras/sts118
- Jin et al. (2019) Jin, S., Daddi, E., Magdis, G. E., et al. 2019, The Astrophysical Journal, 887, 144, doi: 10.3847/1538-4357/ab55d6
- Juneau et al. (2011) Juneau, S., Dickinson, M., Alexander, D. M., & Salim, S. 2011, The Astrophysical Journal, 736, 104, doi: 10.1088/0004-637X/736/2/104
- Kauffmann et al. (2003) Kauffmann, G., Heckman, T. M., White, S. D. M., et al. 2003, Monthly Notices of the Royal Astronomical Society, 341, 54, doi: 10.1046/j.1365-8711.2003.06292.x
- Kawinwanichakij et al. (2020) Kawinwanichakij, L., Papovich, C., Ciardullo, R., et al. 2020, The Astrophysical Journal, 892, 7, doi: 10.3847/1538-4357/ab75c4
- Kennicutt (1998) Kennicutt, R. C. 1998, Annual Review of Astronomy and Astrophysics, 36, 189, doi: 10.1146/annurev.astro.36.1.189
- Kewley et al. (2013) Kewley, L. J., Dopita, M. A., Leitherer, C., et al. 2013, The Astrophysical Journal, 774, 100, doi: 10.1088/0004-637X/774/2/100
- Koekemoer et al. (2011) Koekemoer, A. M., Faber, S. M., Ferguson, H. C., et al. 2011, The Astrophysical Journal Supplement Series, 197, 36, doi: 10.1088/0067-0049/197/2/36
- Kriek et al. (2009) Kriek, M., van Dokkum, P. G., Labbé, I., et al. 2009, The Astrophysical Journal, 700, 221, doi: 10.1088/0004-637X/700/1/221
- Kriek et al. (2011) Kriek, M., van Dokkum, P. G., Whitaker, K. E., et al. 2011, The Astrophysical Journal, 743, 168, doi: 10.1088/0004-637X/743/2/168
- Kriek et al. (2015) Kriek, M., Shapley, A. E., Reddy, N. A., et al. 2015, The Astrophysical Journal Supplement Series, 218, 1, doi: 10.1088/0067-0049/218/2/15
- Kriek et al. (2019) Kriek, M., Price, S. H., Conroy, C., et al. 2019, The Astrophysical Journal, 880, L31, doi: 10.3847/2041-8213/ab2e75
- Kubo et al. (2018) Kubo, M., Tanaka, M., Yabe, K., et al. 2018, The Astrophysical Journal, 867, 1, doi: 10.3847/1538-4357/aae3e8
- Labbé et al. (2006) Labbé, I., Bouwens, R. J., Illingworth, G. D., & Franx, M. 2006, The Astrophysical Journal, 649, L67, doi: 10.1086/508512
- Labbé et al. (2005) Labbé, I., Huang, J., Franx, M., et al. 2005, The Astrophysical Journal, 624, L81, doi: 10.1086/430700
- Ma et al. (2015) Ma, J., Gonzalez, A. H., Spilker, J. S., et al. 2015, The Astrophysical Journal, 812, 88, doi: 10.1088/0004-637X/812/1/88
- Marchesini et al. (2010) Marchesini, D., Whitaker, K. E., Brammer, G., et al. 2010, The Astrophysical Journal, 725, 1277, doi: 10.1088/0004-637X/725/1/1277
- Marrone et al. (2018) Marrone, D. P., Spilker, J. S., Hayward, C. C., et al. 2018, Nature, 553, 51, doi: 10.1038/nature24629
- Marsan et al. (2017) Marsan, Z. C., Marchesini, D., Brammer, G. B., et al. 2017, The Astrophysical Journal, 842, 21, doi: 10.3847/1538-4357/aa7206
- Marsan et al. (2015) —. 2015, The Astrophysical Journal, 801, 133, doi: 10.1088/0004-637X/801/2/133
- Martis et al. (2016) Martis, N. S., Marchesini, D., Brammer, G. B., et al. 2016, The Astrophysical Journal, 827, L25, doi: 10.3847/2041-8205/827/2/L25
- Mauduit et al. (2012) Mauduit, J.-C., Lacy, M., Farrah, D., et al. 2012, Publications of the Astronomical Society of the Pacific, 124, 1135, doi: 10.1086/668290
- McCracken et al. (2012) McCracken, H. J., Milvang-Jensen, B., Dunlop, J., et al. 2012, Astronomy & Astrophysics, 544, A156, doi: 10.1051/0004-6361/201219507
- McLean et al. (2010) McLean, I. S., Steidel, C. C., Epps, H., et al. 2010in , 77351E. http://proceedings.spiedigitallibrary.org/proceeding.aspx?doi=10.1117/12.856715
- McLean et al. (2012) McLean, I. S., Steidel, C. C., Epps, H. W., et al. 2012in . http://proceedings.spiedigitallibrary.org/proceeding.aspx?doi=10.1117/12.924794
- Mehta et al. (2018) Mehta, V., Scarlata, C., Capak, P., et al. 2018, The Astrophysical Journal Supplement Series, 235, 36, doi: 10.3847/1538-4365/aab60c
- Merlin et al. (2018) Merlin, E., Fontana, A., Castellano, M., et al. 2018, Monthly Notices of the Royal Astronomical Society, 473, 2098, doi: 10.1093/mnras/stx2385
- Merlin et al. (2019) Merlin, E., Fortuni, F., Torelli, M., et al. 2019, Monthly Notices of the Royal Astronomical Society, 490, 3309, doi: 10.1093/mnras/stz2615
- Moustakas et al. (2006) Moustakas, J., Kennicutt, Jr., R. C., & Tremonti, C. A. 2006, The Astrophysical Journal, 642, 775, doi: 10.1086/500964
- Muzzin et al. (2013) Muzzin, A., Marchesini, D., Stefanon, M., et al. 2013, The Astrophysical Journal Supplement Series, 206, 8, doi: 10.1088/0067-0049/206/1/8
- Nelan et al. (2005) Nelan, J. E., Smith, R. J., Hudson, M. J., et al. 2005, The Astrophysical Journal, 632, 137, doi: 10.1086/431962
- Newman et al. (2018) Newman, A. B., Belli, S., Ellis, R. S., & Patel, S. G. 2018, The Astrophysical Journal, 862, 125, doi: 10.3847/1538-4357/aacd4d
- Oke & Gunn (1983) Oke, J. B., & Gunn, J. E. 1983, The Astrophysical Journal, 266, 713, doi: 10.1086/160817
- Oliphant & Millma (2006) Oliphant, T., & Millma, J. k. 2006, A guide to NumPy, doi: DOI:10.1109/MCSE.2007.58
- Pacifici et al. (2016) Pacifici, C., Kassin, S. A., Weiner, B. J., et al. 2016, The Astrophysical Journal, 832, 79, doi: 10.3847/0004-637X/832/1/79
- Pavesi et al. (2018) Pavesi, R., Riechers, D. A., Sharon, C. E., et al. 2018, The Astrophysical Journal, 861, 43, doi: 10.3847/1538-4357/aac6b6
- Pérez & Granger (2007) Pérez, F., & Granger, B. E. 2007, Computing in Science and Engineering, doi: 10.1109/MCSE.2007.53
- Price-Whelan et al. (2018) Price-Whelan, A. M., Sipőcz, B. M., Günther, H. M., et al. 2018, The Astronomical Journal, 156, 123, doi: 10.3847/1538-3881/aabc4f
- Reddy et al. (2018) Reddy, N. A., Shapley, A. E., Sanders, R. L., et al. 2018, The Astrophysical Journal, 869, 92, doi: 10.3847/1538-4357/aaed1e
- Riechers et al. (2013) Riechers, D. A., Bradford, C. M., Clements, D. L., et al. 2013, Nature, 496, 329, doi: 10.1038/nature12050
- Riechers et al. (2017) Riechers, D. A., Leung, T. K. D., Ivison, R. J., et al. 2017, The Astrophysical Journal, 850, 1, doi: 10.3847/1538-4357/aa8ccf
- Riechers et al. (2020) Riechers, D. A., Hodge, J. A., Pavesi, R., et al. 2020, The Astrophysical Journal, 895, 81, doi: 10.3847/1538-4357/ab8c48
- Robitaille et al. (2013) Robitaille, T. P., Tollerud, E. J., Greenfield, P., et al. 2013, Astronomy & Astrophysics, 558, A33, doi: 10.1051/0004-6361/201322068
- Salmon et al. (2015) Salmon, B., Papovich, C., Finkelstein, S. L., et al. 2015, The Astrophysical Journal, 799, 183, doi: 10.1088/0004-637X/799/2/183
- Sanders et al. (2007) Sanders, D. B., Salvato, M., Aussel, H., et al. 2007, The Astrophysical Journal Supplement Series, 172, 86, doi: 10.1086/517885
- Schaye et al. (2015) Schaye, J., Crain, R. A., Bower, R. G., et al. 2015, Monthly Notices of the Royal Astronomical Society, 446, 521, doi: 10.1093/mnras/stu2058
- Schreiber et al. (2018a) Schreiber, C., Glazebrook, K., Nanayakkara, T., et al. 2018a, Astronomy & Astrophysics, 618, A85, doi: 10.1051/0004-6361/201833070
- Schreiber et al. (2018b) Schreiber, C., Labbé, I., Glazebrook, K., et al. 2018b, Astronomy & Astrophysics, 611, A22, doi: 10.1051/0004-6361/201731917
- Shahidi et al. (2020) Shahidi, A., Mobasher, B., Nayyeri, H., et al. 2020, The Astrophysical Journal, 897, 44, doi: 10.3847/1538-4357/ab96c5
- Shapley et al. (2015) Shapley, A. E., Reddy, N. A., Kriek, M., et al. 2015, Astrophysical Journal, 801, 88, doi: 10.1088/0004-637X/801/2/88
- Silverman et al. (2009) Silverman, J. D., Lamareille, F., Maier, C., et al. 2009, Astrophysical Journal, 696, 396, doi: 10.1088/0004-637X/696/1/396
- Smith et al. (2012) Smith, R. J., Lucey, J. R., Price, J., Hudson, M. J., & Phillipps, S. 2012, Monthly Notices of the Royal Astronomical Society, 419, 3167, doi: 10.1111/j.1365-2966.2011.19956.x
- Spitler et al. (2014) Spitler, L. R., Straatman, C. M. S., Labbé, I., et al. 2014, The Astrophysical Journal, 787, L36, doi: 10.1088/2041-8205/787/2/L36
- Straatman et al. (2014) Straatman, C. M. S., Labbé, I., Spitler, L. R., et al. 2014, The Astrophysical Journal, 783, L14, doi: 10.1088/2041-8205/783/1/L14
- Straatman et al. (2016) Straatman, C. M. S., Spitler, L. R., Quadri, R. F., et al. 2016, The Astrophysical Journal, 830, 51, doi: 10.3847/0004-637X/830/1/51
- Strandet et al. (2017) Strandet, M. L., Weiss, A., Breuck, C. D., et al. 2017, The Astrophysical Journal, 842, L15, doi: 10.3847/2041-8213/aa74b0
- Strom et al. (2017) Strom, A. L., Steidel, C. C., Rudie, G. C., et al. 2017, The Astrophysical Journal, 836, 164, doi: 10.3847/1538-4357/836/2/164
- Tanaka et al. (2019) Tanaka, M., Valentino, F., Toft, S., et al. 2019, The Astrophysical Journal, 885, L34, doi: 10.3847/2041-8213/ab4ff3
- Thomas et al. (2005) Thomas, D., Maraston, C., Bender, R., & de Oliveira, C. M. 2005, The Astrophysical Journal, 621, 673, doi: 10.1086/426932
- Thomas et al. (2010) Thomas, D., Maraston, C., Schawinski, K., Sarzi, M., & Silk, J. 2010, Monthly Notices of the Royal Astronomical Society, 404, 1775, doi: 10.1111/j.1365-2966.2010.16427.x
- Toft et al. (2014) Toft, S., Smolčić, V., Magnelli, B., et al. 2014, The Astrophysical Journal, 782, 68, doi: 10.1088/0004-637X/782/2/68
- Treu et al. (2005) Treu, T., Ellis, R. S., Liao, T. X., & van Dokkum, P. G. 2005, The Astrophysical Journal, 622, L5, doi: 10.1086/429374
- Trump et al. (2013) Trump, J. R., Konidaris, N. P., Barro, G., et al. 2013, Astrophysical Journal Letters, 763, 1, doi: 10.1088/2041-8205/763/1/L6
- Valentino et al. (2020) Valentino, F., Tanaka, M., Davidzon, I., et al. 2020, The Astrophysical Journal, 889, 93, doi: 10.3847/1538-4357/ab64dc
- van de Sande et al. (2013) van de Sande, J., Kriek, M., Franx, M., et al. 2013, The Astrophysical Journal, 771, 85, doi: 10.1088/0004-637X/771/2/85
- van der Wel et al. (2014) van der Wel, A., Franx, M., van Dokkum, P. G., et al. 2014, The Astrophysical Journal, 788, 28, doi: 10.1088/0004-637X/788/1/28
- van Dokkum et al. (2009) van Dokkum, P. G., Labbé, I., Marchesini, D., et al. 2009, Publications of the Astronomical Society of the Pacific, 121, 2, doi: 10.1086/597138
- Vanden Berk et al. (2001) Vanden Berk, D. E., Richards, G. T., Bauer, A., et al. 2001, The Astronomical Journal, 122, 549, doi: 10.1086/321167
- Vogelsberger et al. (2014a) Vogelsberger, M., Genel, S., Springel, V., et al. 2014a, Nature, 509, 177, doi: 10.1038/nature13316
- Vogelsberger et al. (2014b) —. 2014b, Monthly Notices of the Royal Astronomical Society, 444, 1518, doi: 10.1093/mnras/stu1536
- Wang et al. (2019) Wang, T., Schreiber, C., Elbaz, D., et al. 2019, Nature, 572, 211, doi: 10.1038/s41586-019-1452-4
- Wellons et al. (2015) Wellons, S., Torrey, P., Ma, C.-P., et al. 2015, Monthly Notices of the Royal Astronomical Society, 449, 361, doi: 10.1093/mnras/stv303
- Whitaker et al. (2011) Whitaker, K. E., Labbé, I., van Dokkum, P. G., et al. 2011, The Astrophysical Journal, 735, 86, doi: 10.1088/0004-637X/735/2/86
- Williams et al. (2019) Williams, C. C., Labbe, I., Spilker, J., et al. 2019, The Astrophysical Journal, 884, 154, doi: 10.3847/1538-4357/ab44aa
- Williams et al. (2009) Williams, R. J., Quadri, R. F., Franx, M., van Dokkum, P., & Labbé, I. 2009, The Astrophysical Journal, 691, 1879, doi: 10.1088/0004-637X/691/2/1879
- Wu et al. (2018) Wu, P.-F., van der Wel, A., Gallazzi, A., et al. 2018, The Astrophysical Journal, 855, 85, doi: 10.3847/1538-4357/aab0a6
- Wuyts et al. (2007) Wuyts, S., Labbe, I., Franx, M., et al. 2007, The Astrophysical Journal, 655, 51, doi: 10.1086/509708
- Zavala et al. (2018) Zavala, J. A., Montaña, A., Hughes, D. H., et al. 2018, Nature Astronomy, 2, 56, doi: 10.1038/s41550-017-0297-8
Appendix A Summary of Observations
Spectra were taken on Keck/MOSFIRE under the program “Ultramassive Galaxies and their Environments at ” (PI: Wilson), which was awarded a total of 11.5 nights over 4 semesters (2018B-2020A). Of these, two nights were lost in their entirety due to weather and a total of about one additional night was lost due to various technical issues and shorter periods of inclement weather. Data from a previous program “Formation of Massive Quiescent Galaxies” (PI: Wilson), which consisted of two half-nights in 2017B were also used in this analysis. We present the observations by individual mask in Table LABEL:T:Obs and by UMG in Table LABEL:T:Obs2.
All individual band exposures were 180s, while band exposures were 120s.
The first seeing value is the estimated seeing from MIRA focusing, while the second is an average of the seeing derived from Gaussian fits to 1D spectra of slit stars on the given mask.
| Field | Observing | Mask Name | Filter | Total Integration | Average | Galaxies |
|---|---|---|---|---|---|---|
| Night | Time (ks)a | Seeing (′′)b | Targeted | |||
| COSMOS-UltraVISTA | 21Nov2017 | COS20173 | K | 8.8 | 0.6 / 0.78 | 15 |
| 22Nov2017 | COS20175 | K | 7.8 | 0.8 / 0.74 | 13 | |
| 27Nov2018 | COS-201999-K1 | K | 7.2 | 1.1 / 0.63 | 21 | |
| 14Dec2018 | COS-201999-H1 | H | 5.8 | 1.2 / 1.49 | 12 | |
| COS-201999-H2 | H | 4.8 | 1.2 / 1.40 | 10 | ||
| 15Dec2018 | COS-84674-H1 | H | 5.3 | 1.2 / 0.95 | 15 | |
| COS-84674-H2 | H | 5.3 | 1.2 / 0.94 | 13 | ||
| 28Feb2019 | COS-195616-K1 | K | 7.9 | 1.3 / 0.89 | 18 | |
| COS-226441-K1 | K | 5.0 | 1.0 / 0.99 | 22 | ||
| 17Mar2019 | COS-160748-K1 | K | 3.6 | 0.5 / 0.66 | 18 | |
| COS-201999-H3 | H | 4.8 | 0.7 / 0.67 | 20 | ||
| COS-201999-H4 | H | 5.8 | 0.6 / 0.61 | 18 | ||
| 14Nov2019 | COS-84674-H3 | H | 6.2 | 0.5 / 0.65 | 16 | |
| 08Dec2019 | COS-79837-K1 | K | 2.9 | 0.5 / 0.74 | 9 | |
| COS-113684-K1 | K | 3.6 | 0.6 / 0.56 | 6 | ||
| COS-258857-K1 | K | 3.6 | 0.6 / 0.80 | 8 | ||
| 02Feb2020 | COS-131925-K1w | K | 4.3 | 1.4 / 0.77 | 25 | |
| COS-111740-K1w | K | 9.4 | 1.4 / 1.40 | 21 | ||
| 03Feb2020 | COS-258857-K12 | K | 3.6 | 1.0 / 0.65 | 8 | |
| COS-79837-H1 | K | 12.5 | 0.8 / 0.87 | 9 | ||
| COS-208070-K1 | K | 3.6 | 0.8 / 0.99 | 14 | ||
| 23Feb2020 | COS-111740-H1 | H | 4.3 | 1.0 / 0.66 | 21 | |
| COS-208070-K2 | K | 4.3 | 1.0 / 0.80 | 16 | ||
| COS-113684-K2 | K | 8.6 | 0.7 / 0.68 | 6 | ||
| XMM-VIDEO | 21Nov2017 | XMM20172 | K | 18.5 | 0.8 / 0.89 | 14 |
| 22Nov2017 | XMM20174 | K | 18.5 | 0.8 / 0.88 | 15 | |
| 27Nov2018 | XMM-2599-K1 | K | 10.8 | 0.6 / 0.69 | 21 | |
| 14Dec2018 | XMM-2599-H1 | H | 8.6 | 0.6 / 0.94 | 14 | |
| XMM-2599-H2f | H | 4.8 | 1.0 / 1.46 | 13 | ||
| 15Dec2018 | XMM-2599-H1f | H | 9.6 | 0.7 / 1.13 | 15 | |
| XMM-2962-K1 | K | 5.0 | 0.6 / 0.70 | 20 | ||
| 14Nov2019 | XMM-3941-H1 | H | 5.3 | 0.5 / 1.21 | 17 | |
| 08Dec2019 | XMM-3941-K1 | K | 5.8 | 0.8 / 1.20 | 17 | |
| XMM-2293-K1 | K | 2.9 | 0.8 / 0.88 | 24 | ||
| 03Feb2020 | XMM-3941-K12 | K | 5.0 | 1.0 / 1.25 | 17 | |
| 23Feb2020 | XMM-270-K1w | K | 0.7 | 1.0 / 1.18 | 10 | |
| \insertTableNotes |
| UMG | masks | Magnitude | Int. Time (ks) | Avg. Seeing (”) | Avg. SNR per Pixel | ||||
|---|---|---|---|---|---|---|---|---|---|
| (, ) | |||||||||
| COS-DR3-160748 | COS-160748* (1,0) | 20.25 | 21.09 | 3.6 | — | 0.7 | — | 3.44 | — |
| COS-DR3-202019 | COS-201999* (1,4) | 20.79 | 21.36 | 5.0 | 21.1 | 0.7 | 0.6-1.5 | 2.04 | 1.92 |
| COS-DR3-131925 | COS-131925* (1,0) | 20.96 | 21.30 | 4.3 | — | 0.8 | — | 0.25 | — |
| COS-DR3-201999 | COS-201999* (1,4) | 21.00 | 21.51 | 7.2 | 21.1 | 0.6 | 0.6-1.5 | 3.01 | 3.73 |
| COS-DR1-79837 | COS-79837* (1,1) | 21.10 | 22.25 | 2.9 | 12.5 | 0.7 | 0.9 | 2.42 | 4.12 |
| COS-DR3-113684 | COS-113684* (2,0) | 21.10 | 22.57 | 12.2 | — | 0.6-0.7 | — | 2.64 | — |
| COS-DR3-111740 | COS-111740* (1,1) | 21.10 | 21.09 | 9.4 | 4.3 | 1.4 | 0.7 | 4.96 | 3.03 |
| COS-DR3-84674 | COS-84674* (0,3) | 21.28 | 21.67 | — | 16.8 | — | 1.2 | — | 4.36 |
| COS-DR3-195616 | COS-195616* (1,0) | 21.64 | 22.34 | 8.1 | — | 1.3 | — | 1.63 | — |
| COS-DR3-226441 | COS-226441* (1,0) | 21.65 | 22.46 | 5.0 | — | 1.0 | — | 0.96 | — |
| COS-DR1-258857 | COS-258857* (2,0) | 21.66 | 22.46 | 7.2 | — | 0.76-0.8 | — | 1.30 | — |
| COS-DR3-208070 | COS-208070* (2,0) | 21.70 | 22.54 | 7.9 | — | 0.8-1.0 | — | 2.18 | — |
| COS-DR3-179370 | COS2017* (2,0) | 22.14 | 23.51 | 16.6 | — | 0.7-0.8 | — | 1.19 | — |
| XMM-VID3-2075 | XMM-2692* (1,0) | 20.79 | 21.94 | 5.0 | — | 0.7 | — | 3.51 | — |
| XMM-VID1-1120 | XMM-2599* (1,3) | 20.97 | 22.44 | 10.8 | 23.0 | 0.7 | 1.0-1.4 | 4.00 | 1.35 |
| XMM-VID1-2399 | XMM20174 (1,0) | 21.10 | 21.09 | 18.4 | — | 0.9 | — | 1.21 | — |
| XMM-VID3-3941 | XMM-3941* (2,1) | 21.33 | 22.47 | 10.8 | 5.3 | 1.02 | 0.5 | 2.23 | 1.59 |
| XMM-VID3-2293 | XMM-2293* (1,0) | 21.35 | 22.47 | 2.9 | — | 0.9 | — | 1.00 | — |
| XMM-VID2-270 | XMM-270* (1,0) | 21.47 | 22.51 | 0.7 | — | 1.0 | — | 0.32 | — |
| XMM-VID3-2457 | XMM-2599* (1,3) | 21.52 | 22.61 | 10.8 | 23.0 | 0.7 | 1.0-1.4 | 3.40 | 1.30 |
| XMM-VID1-2761 | XMM20172 (1,0) | 21.74 | 23.22 | 18.5 | — | 0.9 | — | 1.68 | — |
Appendix B Observations of Unconfirmed Objects
In this work we have presented spectra of 16 UMGs. However, five other UMG candidates were also spectroscopically observed, and these objects are presented here. The associated masks and observations for each UMG are included in Table LABEL:T:Obs and Table LABEL:T:Obs2. SEDs and spectra are presented in Figure B.1.
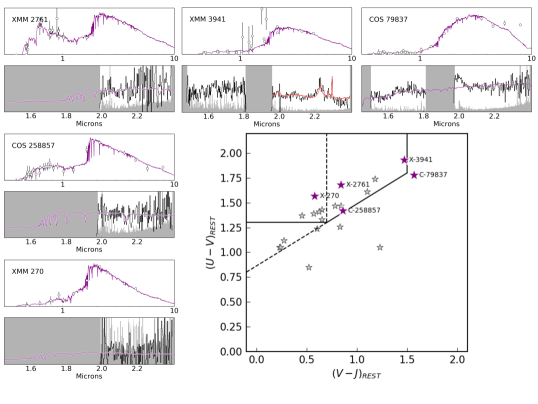
XMM-VID3-3941 has a very red SED, suggesting significant dust obscuration, and its photometry is well fit with a massive, dusty template at . However, it is spectroscopically confirmed to be a quasar at . Comparison of the -band spectrum with the SDSS composite quasar spectrum shows good agreement with broad and H emission, as well as narrow [Oiii] emission (Figure B.1). Given that the quasar potentially contributes a substantial amount to the flux of this galaxy, we refrain from estimating other properties such as stellar mass.
A photometric redshift analysis indicates that COS-DR1-79837 is also a massive, dusty, star-forming galaxy at . Spectra do not reveal clear features to confirm a redshift, though a combined fit to spectra and photometry yields a best-fit . The upturn in flux in the IRAC 3.6 m and 4.5 m channels is also suggestive of AGN activity.
Both of these candidates lie in the upper right corner of the UVJ diagram, nominally the location of dusty star-forming galaxies, and have large photometric stellar mass estimates of . Galaxies in this region are difficult to spectroscopically confirm as many observable line features are expected to be obscured by dust. Further probing of this region is warranted, and will be explored in future work.
COS-DR1-258857 lies on the wedge separating the star-forming and quiescent regions of the UVJ diagram, with . The spectrum shows two significant dips around 2.14 and 2.17 m, though the spectrum is noisy. Assuming one of these is absorption, the redshift is then either or .
The spectrum of XMM1-2761 does not have sufficient signal-to-noise to determine a redshift, though we note this target is very faint ( , ). Photometric detections in the rest-frame UV suggest some ongoing star-formation. The UVJ colors may incorrectly place this galaxy in the quiescent wedge due to photometric contamination by strong emission lines.
XMM-VID2-270 is photometrically a post-starburst similar to a number of others confirmed in this work. Integration time on this object was exceedingly short, taken in a short period after high winds had subsided and before the XMM field set, and no features are apparent in the resulting spectrum.
Appendix C Identification of Sky Line Contamination
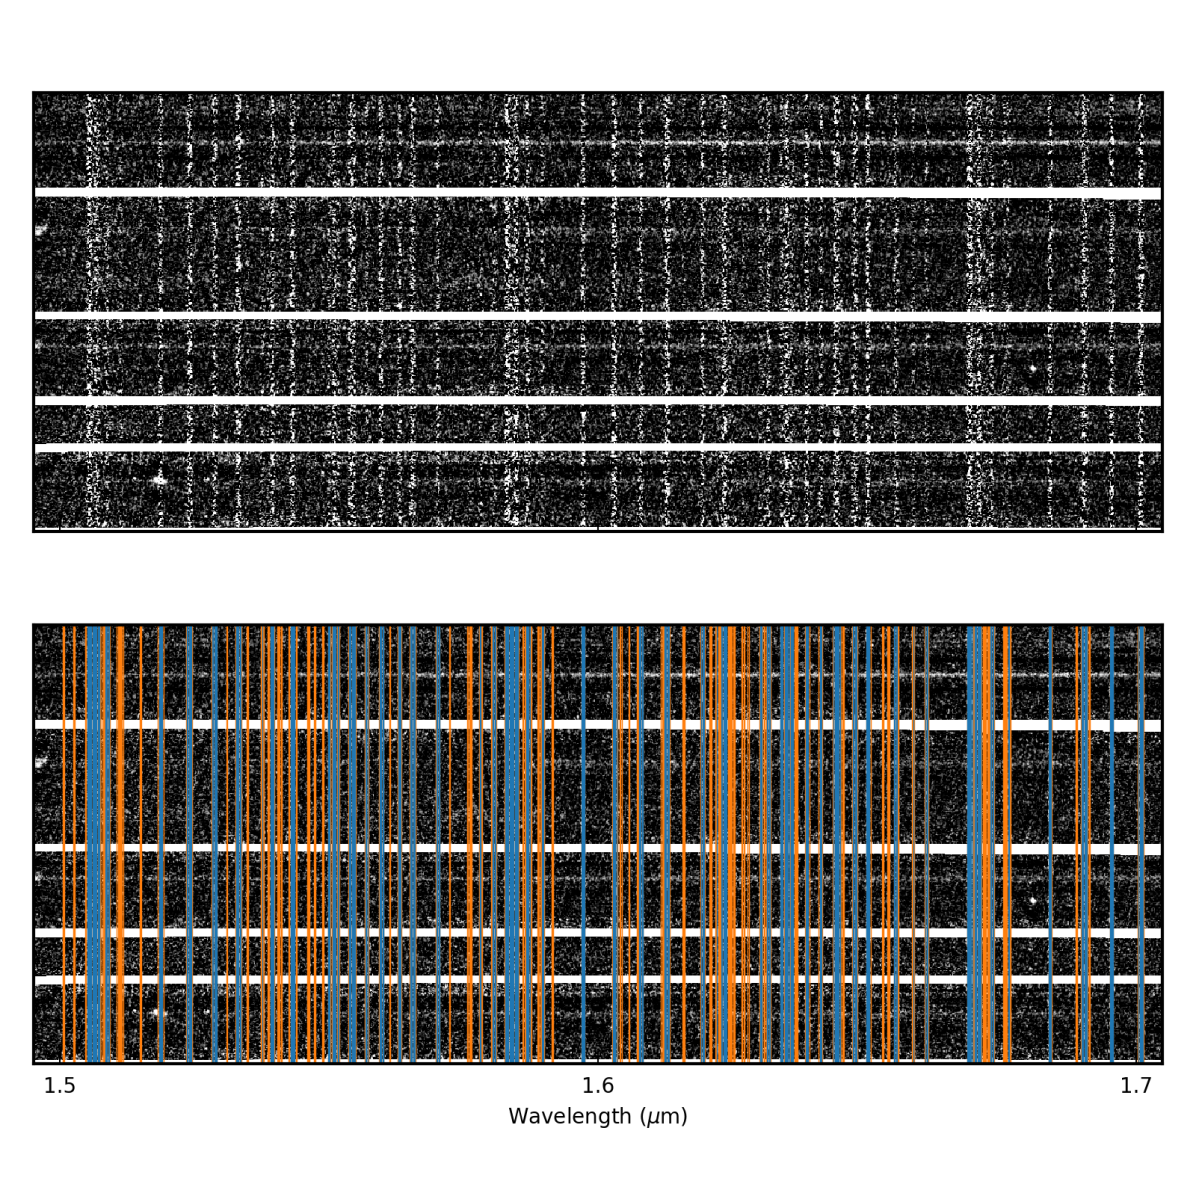
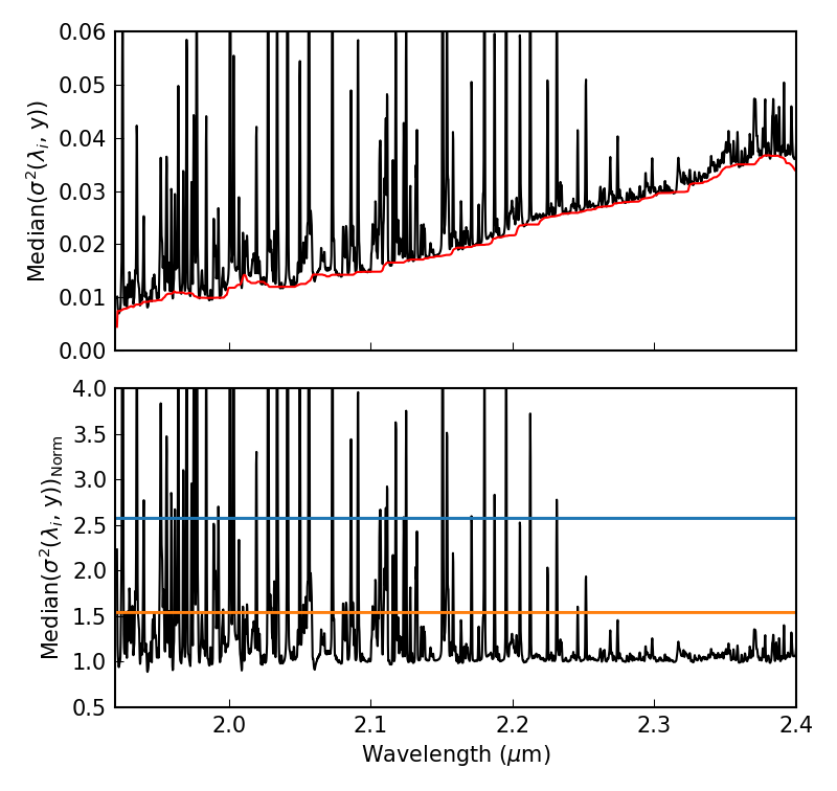
We use the uncertainties on pixel fluxes determined by the DRP, which we refer to below as pixel variance, to identify sky lines. This is done by by comparing the average pixel variance at a given wavelength to the distribution of pixel variances across the entire mask. For each wavelength in a reduced -band mask, we calculate the median variance per pixel on sky in the spatial direction, median(()). This is then compared to the distribution of variances across all sky pixels, (, s). If median(())((, s)), where corresponds to the percentile, then is considered to have sky line contamination. Additionally, if median(())((, s)), then is considered to have contamination from a strong sky line, while between the two thresholds is termed contamination from a weak sky line. Regions with strong lines are masked when doing all fits. We interpolate fluxes over regions with weak lines, but do not change the variance, which is generally higher at these wavelengths. An example from a portion of an -band mask is shown in Figure C.1.
The above method will not work effectively in the -band due to increasing thermal contamination at redder wavelengths. Applying the same method would result in incorrectly identifying a large percentage of pixels at m as sky lines, and failing to identify weak sky lines at bluer wavelengths. In this case we model the background contribution to variance (i.e., not due to sky lines) at by calculating a running (( m)) and take the ratio with spectral uncertainty. We then perform the same calculation as for the -band masks with this ‘normalized’ variance distribution to determine thresholds for sky line identification (see Figure C.2). In the case of both the -band and -band (Figure C.3), these identifications are checked against visual identification and confirmed to be effective at removing sky line contamination.
Appendix D Telluric Correction Comparison
The telluric correction used in this work involved modeling the observed spectra of faint stars on the individual MOSFIRE masks. Slit stars have previously been used successfully for absolute flux calibrations (e.g., Kriek et al., 2015) and telluric correction (e.g., Schreiber et al., 2018a, see Appendix B for details).
On many nights we also took spectra of telluric standard stars, all of which were A-type stars, to provide an alternative telluric correction option. These spectra were processed in the same manner as the science masks (MOSFIRE DRP to obtain 2D spectrum, custom code for 1D extraction). We subsequently masked and interpolated over hydrogen absorption features present in the 1D spectra of these stars and compared the resultant curve to a blackbody with the temperature of the same spectral subtype. The normalized ratio of these two yielded a telluric correction factor which was applied to all the spectra on a given mask.
When compared to the method incorporating the slit stars, this method gave generally similar results. The standard star correction tends to be smoother, which is reasonable considering that one part of the ratio (the blackbody) is itself a smooth curve, and given the higher SNR of the bright standard star relative to the slit star. For masks observed directly before or after a standard star observation, the differences in the telluric corrected spectra between the two methods is small (Figure D.1). However, we find that the corrections tend to be more discrepant as the time between observations of a mask and a standard star increase, almost certainly due to atmospheric changes throughout the night (Figure D.2). For determining redshifts and locations of strong emission and absorption features, these differences are inconsequential.
We note that for science goals requiring high SNR spectra, such differences could become relevant. Also we do not claim that one correction is necessarily better than the other, as this will depend on the targets, observing sequence, and observing conditions.
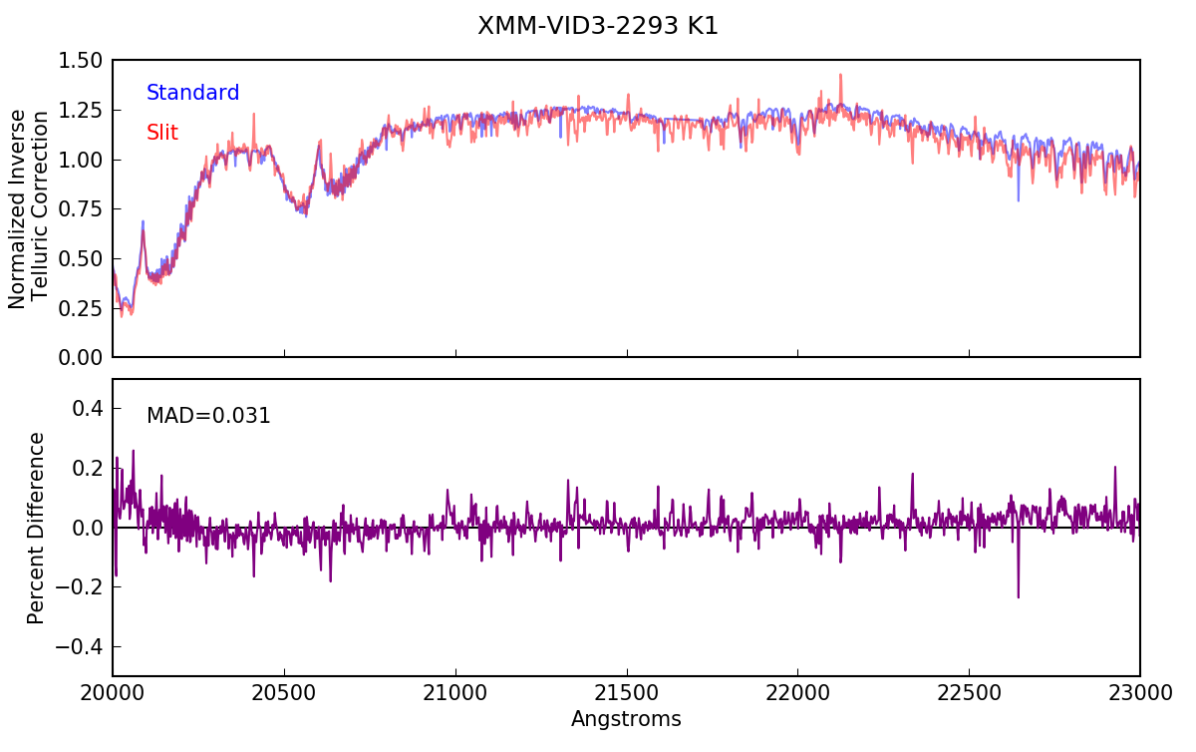
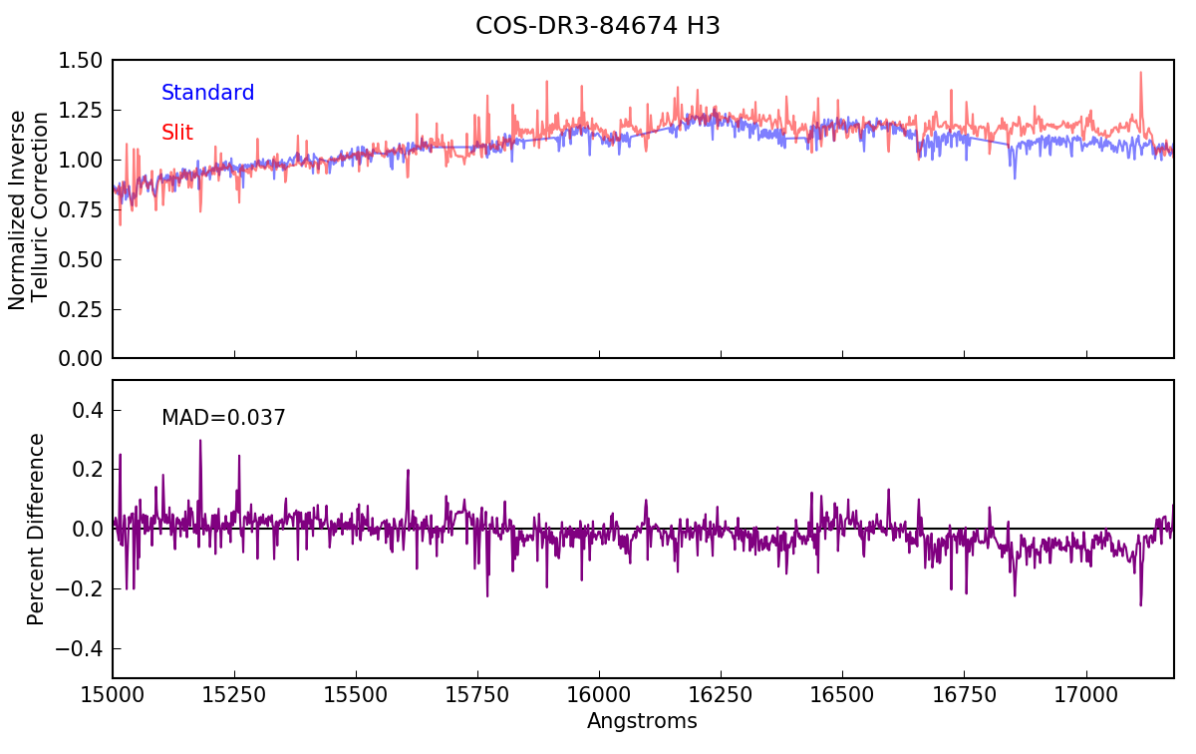
Appendix E On the Existence of a Population of Older UMGs
As we discuss in Sections 5.5 and 5.6, spectroscopically confirmed massive galaxies at lacking evidence of star formation appear to be post-starbursts, i.e., have quenched in the last several hundred Myr. Given that detection of these objects is very near to the limit of what is possible with current instrumentation, we must consider the fact that this is the result of an observational bias. We explore this by calculating how much fainter an older, passive UMG would be at these redshifts.
To accomplish this we construct SEDs at various times along several SFHs (using BC03 SPS models) and compare their luminosities in the -band, assuming a redshift of , the median of the sample. We begin with a SFH consisting of 100 Myr of constant (and vigorous) star formation, followed by a quick decline in star formation with Myr, shown in Figure 11. The time at which this galaxy quenched is taken to be when star formation drops below 10% of the SFR during the constant period of star formation, akin to the value calculated for the UMGs. This SFH is similar to the best-fit SFHs for the UMGs, which have a median starburst period of 122 Myr and steeply declining SFR thereafter. As expected, we find that galaxies which quenched earlier are significantly redder and fainter, in this case over five times fainter for a galaxy which quenched 1 Gyr before observation.
However, this test is somewhat model dependent. The difference in magnitude due to time since quenching decreases with an increase in either the duration of the starburst period (Figure E.1) or the -parameter (Figure E.2). In addition, this limits how long ago the oldest galaxies could have quenched given the young age of the universe (1.9 Gyr at .)