Hidden Order Beyond Hyperuniformity in Critical Absorbing States
Abstract
Disordered hyperuniformity is a description of hidden correlations in point distributions revealed by an anomalous suppression in fluctuations of local density at various coarse-graining length scales. In the absorbing phase of models exhibiting an active-absorbing state transition, this suppression extends up to a hyperuniform length scale that diverges at the critical point. Here, we demonstrate the existence of additional many-body correlations beyond hyperuniformity. These correlations are hidden in the higher moments of the probability distribution of the local density, and extend up to a longer length scale with a faster divergence than the hyperuniform length on approaching the critical point. Our results suggest that a hidden order beyond hyperuniformity may generically be present in complex disordered systems.
The behaviour of long-wavelength density fluctuations and their anomalous suppression - hyperuniformity Torquato2018 ; Torquato2016 , have been a subject of recent interest in the study of disordered systems for they provide an avenue to probe long-range order in problems that do not possess translational or bond-orientational symmetry KlattTorquato2019 ; Torquato2018b ; Hexner2018 ; HexnerLevine2015 ; HexnerLevine2017 ; ChiecoDurian2018 ; Mitra2020 . At the same time, hyperuniformity is also emergent in a diverse variety of naturally occurring or model systems, that range from granular or colloidal materials Torquato2018b ; Hexner2018 ; WilkenChaikin2020 ; WangPaulsen2018 ; TjhungBerthier2015 ; ChremosDouglas2018 to soft biological tissues JiaoTorquato2014 ; ZhengPicaCiamarra2020 ; LiBi2018 . This has led to speculations on its universality KlattTorquato2019 ; HexnerLevine2015 and the need for greater understanding of its causal role in the organization and structure of complex systems.
For a given configuration of points in -dimensional space with the global number density , the local density , defined over a subspace region of some finite length scale is a coarse-grained variable characterized by a discrete probability distribution . In the scenario where is generated randomly by an underlying Poisson point process, of disconnected regions in real space are uncorrelated such that is constrained by the central limit theorem (CLT) and its variance scales as in the limit of . Hyperuniformity is the characterization of density fluctuations that are anomalously suppressed () even in the thermodynamic limit due to the presence of peculiar correlations in physical density fields. For systems that are not (ideally) hyperuniform, is instead suppressed up to a finite length scale, Hexner2018 ; ZhengPicaCiamarra2020 ; ChiecoDurian2018 , which we refer to hereafter as the hyperuniform length scale. Hyperuniformity analyses, therefore, typically focus on characterizing pairwise correlation through and its Fourier equivalent - the structure factor Torquato2016 ; Torquato2018 .
However, the analysis of the density field through the mere investigation of is unable to uncover the presence of additional higher-ordered correlations hidden in the higher moments TorquatoKlatt2020 of the probability distribution . These correlations are especially relevant at intermediate length scales where crucial information of the phase behaviour on the approach to a critical point may often be present IkedaBerthier2015 ; WuTeitel2015 ; TjhungBerthier2015 ; HexnerLevine2015 .
In this Letter, we show that additional many-body correlations are indeed generically hidden in the of absorbing states in the Conserved Lattice Gas (CLG) Lubeck2003 ; Lubeck2004 ; RossiVespignani2000 and the Random Organization (RO) Tjhung2015 models. These models undergo an active-absorbing state transition at a critical density ; In the high density active phase, the fraction of particles deemed active scales as , while dynamical correlations extend up to a length scaling as ; At lower densities, these systems evolve toward an absorbing state where there are no active particles at long but finite times.
These models have been suggested to exhibit a hyperuniformity crossover at the critical point HexnerLevine2015 , where density fluctuations that were suppressed in the absorbing phase up to a length scale diverge. Here, we first demonstrate that density fluctuations in the absorbing phase are in fact only suppressed up to a length scale , with . Furthermore, through the investigation of the higher moments of and real space analyses, we then demonstrate the existence of additional many-body correlations beyond hyperuniformity that extend up to a length scale . The existence of additional correlations that are not captured by fluctuations in density fields uncovers the presence of a new form of hidden correlations beyond hyperuniformity that may prove to be generically present in complex disordered systems, such as with dynamical heterogeneities Berthier2011a that are generically present in systems exhibiting glassy dynamics.
In the CLG model, particles are placed initially at random on an square lattice with mean density . A particle is deemed active if one or more of its immediate neighbouring sites is occupied, and active particles with at least one adjacent empty site move in parallel in each time step, randomly to an adjacent unoccupied site such that the global density of the system is conserved throughout its dynamics RossiVespignani2000 ; Lubeck2003 ; Lubeck2004 ; HexnerLevine2015 . This process mimics short range repulsion in conserved systems. In the RO model Tjhung2015 , disks of diameter occupy a square simulation domain of side length , at volume fraction where overlapping disks are deemed active. At each time step, active disks move by uncorrelated displacements of random orientation and magnitude that is uniformly distributed across the range , in which is considered for this Letter. This RO model is inspired by recent experimental investigations into colloidal suspensions under oscillatory shear Pine2005 ; Corte2008 , that have recently been suggested to be hyperuniform at their active-absorbing transition WilkenChaikin2020 .
For the CLG model, numerical results presented in the entirety of this work are for systems of linear size , if not otherwise stated, and particles. These systems are up to 2 orders of magnitude larger than what has been previously considered in the literature. For the RO model, we consider system sizes of typically disks, which again is well above what has been previously considered in the literature. Such large systems are needed due to the strong influence of size effects on the moments of . All data are averaged over at least 50 independent runs.
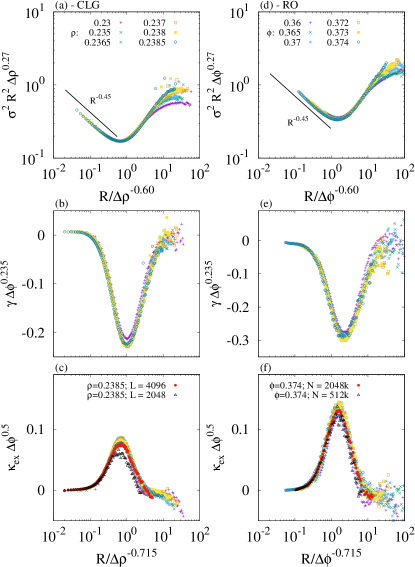
In the absorbing phase, we observe a suppression of the density fluctuations, with and found to be universal across the broader class of two-dimensional random organization models HexnerLevine2015 . This suppression extends up to the hyperuniformity length scale diverging at the critical point, where the scaled fluctuations reach their minimum value. Departing from previous suggestions that HexnerLevine2015 , we find instead that , which in combination with , allows for a collapse of the scaled density fluctuation up to the hyperuniformity length scale, as we show in Fig. 1(a)-(b). We detail the evaluation of and of other critical exponents, alongside corresponding information on the pair correlation and structure factor, in the Supplementary Material (SM) SM .
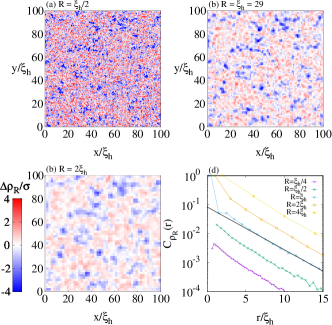
Now, the non-monotonic behavior of the scaled density fluctuations, which themselves do not scale collapse for , is opposed to the behavior observed in fluctuation suppressed states in models of cell tissues ZhengPicaCiamarra2020 , and this suggests the presence of additional correlations in the density field at length scales larger that . Therefore, we expect to not be Gaussian at fluctuation suppressed length scales, but to become Gaussian at much larger lengths. Indeed, we observe in Fig. 2 a non-Gaussian profile for at the hyperuniform length scale (), where a distinctive exponential tail in the low density regime persists that can be approximately described by a universal function,
| (1) |
where and are universal, model independent parameters.
To investigate the approach to the Gaussian limit, we focus on the dependence of the skewness and excess kurtosis . We observe that and have a non-monotonic dependence on the coarse grained length scale, and exhibit respectively, a minimum and maximum at a length diverging with exponent SM . The extreme values of and diverge on approaching the transition, with model independent exponents, as illustrated by the scale collapse of Fig. 1.
To demonstrate that these results are not affected by size-effects, we compare, for the CLG model, data for with results for and - at the highest of densities considered, focusing on the kurtosis and regimes where finite size effects are maximal. Fig. 1c illustrates the good agreement between and , indicating that our results for are not affected by size-effects. Conversely, significant deviations are apparent for . The different reported in Ref. HexnerLevine2015 , which derived results from , may thus be due to finite size effects. Similarly, for the RO model, we find an analogous scenario where results from agree with what is obtained from - at the largest considered value of (Fig. 1d). Hence, size effects only become apparent in systems significantly smaller than the respective largest system sizes of both models that are considered in this Letter.
These results indicate that a sufficiently large system () can be seen as a tessellation of domains of linear size and density distributed in accordance to Eq. 1, within which density fluctuations are suppressed. Furthermore, the behavior of under coarse graining indicates that the coarse-grained density of these domains is spatially correlated, suggesting a hierarchy of self-organization present at different scales. To visualize this, we illustrate in Fig 2c a map of the coarse grained density distribution in a spatial region that spans for a system of size at of the CLG model. The observed patches confirms the existence of correlations beyond . We also note that in Fig. 1f size effects are seen at in a system with , indirectly proving the existence of density correlations extending well beyond .
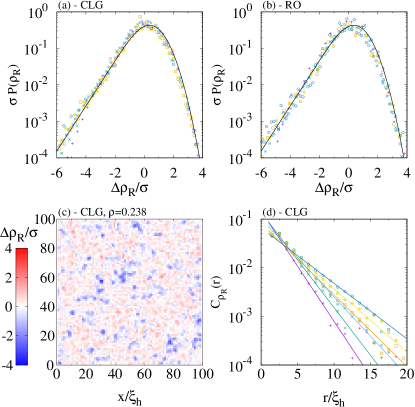
To quantify these additional correlations, we investigate the correlation function of the coarse-grained density at . We discuss in Fig. S3 in the SM SM the dependence of on . Fig. 2d shows that, for the CLG model, this correlation function decays exponentially, , after a sharp decline at short length scales. Data corresponding to different densities do not collapse when plotted against , proving that these observed spatial correlations are a complimentary indication of a hidden additional correlation beyond hyperuniformity. Indeed, we observe in Fig. 3 that, while diverges with the exponent , diverges with the exponent . We stress that the radial correlation function, which we illustrate in Fig. S5 in the SM SM , does not reveal these additional correlations, which implies that they are therefore many-body in nature. These correlations are instead apparent in the two-body correlation function of the coarse grained quantity as they are encoded in , the probability of finding a region of linear size that contains particles.
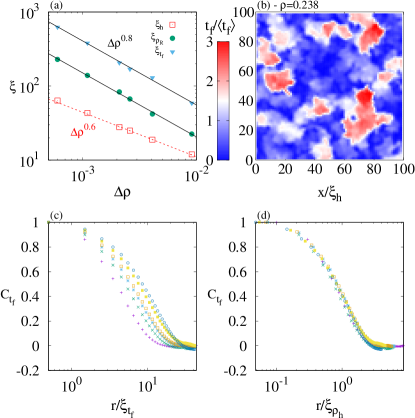
Noticing that , we investigate the physical origin of this novel length scale focusing on the dynamical process leading to the absorbing states. Specifically, we study the coarse grained freezing time cgprocedure , which is defined as the final time at which a particle transitions from an active to passive state. Maps of the coarse grained freezing time, as illustrated in Fig. 3b for the CLG model at , reveal the presence of extended correlations, which we quantify by investigating the correlation function . Fig. 3c shows that the of different densities do not collapse when plotted against , indicating that these correlations are also not set by the hyperuniformity length scale. Instead, we collapse the correlation function in Fig. 3d by plotting them against , where the freezing time correlation length scale is defined by . The length scale diverges on approaching the absorbing phase transition as , as we demonstrate in Fig. 3a, and is therefore proportional to . The additional spatial correlations in the density field beyond hyperuniformity, therefore, reflect the spatial correlation in the dynamics leading to the absorbing state.
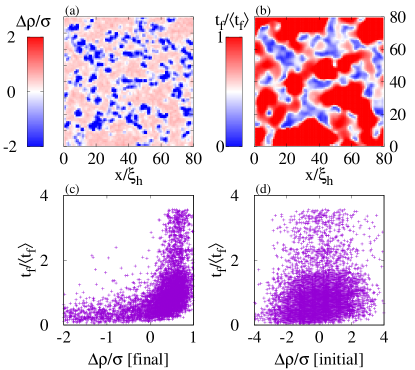
These results prove that a single length scale controls the correlation of the coarse-grained density and that of the freezing time. The correlation between these two quantities, however, is not immediately apparent by a comparison of the coarse-grained density of the final configuration of Fig. 2c and that of the coarse-grained freezing time, Fig. 3b. To unveil these correlations we compare the two maps averaged over 100 runs Harrowell2004 sharing the same initial configurations. These so-called isoconfigurational averages mitigate the effect of dynamical noise. The resulting maps, which we show in Figs. 4a and b, are clearly similar, as regions with a low average coarse-grained density correspond to regions with a low average coarse-grained freezing time. Plotting these quantities against one another in a scatter diagram as in Fig.4c makes their correlation apparent. Importantly, we remark that these correlations do not originate from fluctuations of the coarse-grained density in the initial configuration. Indeed, we show in Fig. 4d that the average coarse-grained freezing time does not correlate with the fluctuations of the coarse-grained density of the initial configuration.
These observations establish an intriguing analogy between the behaviour of the coarse-grained density distribution on increasing , and that of the displacement of the particles of supercooled liquids on increasing the observation time . The fluctuations of are suppressed up to a length scale that diverges at the active-absorbing phase transition, and the convergence to CLT is recovered gradually at larger length scales; Similarly, the fluctuations of are suppressed up to the relaxation time that ideally diverges at the glass transition, the predictions of CLT being progressively recovered at longer timescales. In the CLG and RO models, peaks at lengths that scale diverging at the transition, where the peak height also diverges; Likewise, in supercooled liquids, peaks at a time scaling with , and its peak value diverges at the transition Xu2018 . Furthermore, the heterogeneites of the coarse grained density at observed in RO models, Fig 2c, reflect that of the displacements of the particles at the relaxation time in supercooled liquids Berthier2011a . Finally, in both cases, the correlations between these spatial heterogeneities and the initial configuration of the system are revealed via isoconfigurational averages Harrowell2004 . The systems only differ in their skewness where in liquids as a consequence of the invariance of the equation of motion under time reversal.
In this Letter, we established the existence of hidden many-body correlations, beyond what is captured by the suppression of density fluctuations, in two-dimensional models exhibiting an active-absorbing phase transition. Qualitatively, the scenario here discussed appears to also hold in three dimensions SM . Specifically, density fluctuations are suppressed up to a length scale that diverges at the transition with the exponent while conversely, many-body density correlations extend up to a longer length scale that diverges with the exponent . The presence of similar findings beyond the current context is an exciting avenue that demands further investigation. These explorations may, in turn, provide means for further taxonomy and classification of fluctuation suppressed or hyperuniform disordered systems. Specifically, we envisage a parallel with the taxonomy recently introduced for diffusive systems Wang2012 ; Chechkin2017 , where four main classes are identified based on the behaviour of the second (Fickian/non-Fickian) and higher moments (Gaussian/non-Gaussian) of the displacement field probability distribution. From this perspective, the CLG and RO models are considered hyperunifiorm but non-Gaussian systems, random jammed sphere packings Klatt2016 are (effectively) hyperuniform and Gaussian, while the Voronoi model for cell tissue ZhengPicaCiamarra2020 and Quantizer problems KlattTorquato2019 are (effectively) hyperuniform and Gaussian. Seemingly, non-Gaussian behavior appears to occur in systems exhibiting an absorbing transition while Gaussian behavior exists in jammed solids. Further work in this direction is certainly needed. Future investigations may also consider the possibility of artificially tuning the Gaussian behavior through local particle displacements Klatt2020 .
More generally, these analyses based on the higher moments may provide for additional tools in probing the possible causal role of hyperuniformity in the self-organization of disordered systems by further characterizing the approach to criticality of nonequilibrium phase transitions.
Acknowledgements.
We thank S. Torquato for insightful comments, and acknowledge support from the Singapore Ministry of Education through the Academic Research Fund MOE2017-T2-1-066 (S) and MOE2019-T1-001-03 (S).References
- (1) S. Torquato, Physics Reports 745, 1-95 (2018)
- (2) S. Torquato, Phys. Rev. E 94, 022122 (2016)
- (3) M. A. Klatt, J. Lovrić, D. Chen, S. C. Kapfer, F. M. Schaller, P. W. A. Schönhöfer, B. S. Gardiner, A.-S. Smith, G. E. Schröder-Turk, and S. Torquato, Nat. Commun., 10, 811 (2019)
- (4) S. Torquato, J. Chem. Phys. 149, 020901 (2018)
- (5) D. Hexner, A. J. Liu, and S. R. Nagel, Phys. Rev. Lett. 121, 115501 (2018).
- (6) D. Hexner and D. Levine, Phys. Rev. Lett. 114, 110602 (2015).
- (7) D. Hexner, P. M. Chaikin, and D. Levine, Proc. Natl. Acad. Sci. U.S.A. 114, 4294 (2017).
- (8) A. T. Chieco, M. Zu, A. J. Liu, N. Xu, D. J. Durian, Phys. Rev. E 98, 042606 (2018)
- (9) S. Mitra, G. Foffi, A.D.S. Parmar, P. Leishangthem and S. Sastry, arXiv preprint arXiv:2006.15185 (2020).
- (10) J. Wang, J. M. Schwarz, and J. D. Paulsen, Nature Communications 9, 2836 (2018).
- (11) E. Tjhung and L. Berthier, Phys. Rev. Lett. 114, 148301 (2015).
- (12) S. Wilken, R. E. Guerra, D. J. Pine, and P. M. Chaikin, Phys. Rev. Lett. 125, 148001 (2020).
- (13) A. Chremos, and J. F. Douglas, Phys. Rev. Lett. 121, 258002 (2018).
- (14) Y. Jiao, T. Lau, H. Hatzikirou, M. Meyer-Hermann, J. C. Corbo, S. Torquato, Phys. Rev. E 89, 022721 (2014).
- (15) Y. Zheng, Y.-W. Li, M. P. Ciamarra, Soft Matter, 16, 5942-5950 (2020)
- (16) X. Li, A. Das, D. Bi, Proc Natl Acad of Sci, 115, 6650-6655 (2018).
- (17) S. Torquato, J. Kim, M. A. Klatt, arXiv:2012.02358.
- (18) A. Ikeda, L. Berthier, Phys. Rev. E 92, 012309 (2015).
- (19) Y. Wu, P. Olsson, and S. Teitel, Phys. Rev. E 92, 052206 (2015).
- (20) M. Rossi, R. Pastor-Satorras, and A. Vespignani, Phys. Rev. Lett. 85, 1803 (2000).
- (21) S. Lübeck, Int. J. Mod. Phys. B 18, 3977 (2004).
- (22) S. Lübeck, Phys. Rev. E 64, 016123 (2003).
- (23) L. Berthier, editor, Dynamical Heterogeneities in Glasses, Colloids, and Granular Media (Oxford University Press, Oxford ; New York, 2011).
- (24) L. Wang, N. Xu, W. Wang, and P. Guan, Phys. Rev. Lett. 120, 125502 (2018).
- (25) B. Wang, J. Kuo, S. C. Bae, and S. Granick, Nat. Mater. 11, 481 (2012).
- (26) A. V. Chechkin, F. Seno, R. Metzler, and I. M. Sokolov, Phys. Rev. X 7, 021002 (2017).
- (27) See supplementary material for additional figures S1-S6.
- (28) M. A. Klatt and S. Torquato, Phys. Rev. E 94, 022152 (2016).
- (29) E. Tjhung and L. Berthier, Phys. Rev. Lett. 114, 148301 (2015).
- (30) We evaluate the variable coarse-grained on a length scale , , dividing the system in non overlapping square windows, and averaging within each window.
- (31) M. A. Klatt, J. Kim, and S. Torquato, Phys. Rev. E 101, 32118 (2020).
- (32) D. J. Pine, J. P. Gollub, J. F. Brady, and A. M. Leshansky, Nature 438, 997 (2005).
- (33) L. Corté, C. Corté, P. M. Chaikin, J. P. Gollub, and D. J. Pine, Nat. Phys. 4, 420 (2008).
- (34) A. Widmer-Cooper, P. Harrowell, and H. Fynewever, Phys. Rev. Lett. 93, 135701 (2004).
In this supplementary, we provide additional figures that compliment various results contained in the main text. A summary of figures included are as follows:
I Determination of the critical exponents
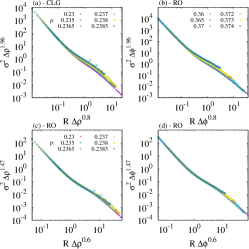
We detail here our evaluation of the exponent that controls the divergence of the hyperuniform length scale at the critical point from the absorbing phase, . We have estimated , a value sensibly different from what has been previously reported in HexnerLevine2015 , .
To estimate the scaling exponents, previous works have considered that since with , in the fluctuation suppressed region, then . Therefore, the value of can be estimated via a data collapse. In Fig. 5(a) and (b) we show that a reasonable data collapse is obtained for in the fluctuation suppressed region, for both models. Panel (c) and (d), however, demonstrate that provides a much better data collapse. This suggests that the exponent estimated in previous works might not be accurate especially considering the small system sizes considered there.
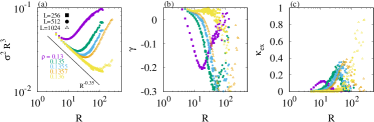
To quantitatively evaluate the critical exponents without resorting to the visual impressions provided by a data collapse, we investigate the coarse-grained dependence of the scaled fluctuations, , as well as the skewness, , and the kurtosis, . It is instructive to focus on as this quantity exhibits a minimum at the value at which the density fluctuations are maximally suppressed, signalling the crossover from the suppressed fluctuation region, , to the central limit theorem scaling, . The non-monotononic dependence on of these quantities, illustrated in Fig. 6, allows the unambiguous identification of the values corresponding to their extremes, which we indicate as where and . We evaluate via polynomial fits close to their extreme values, also illustrated in the figure.
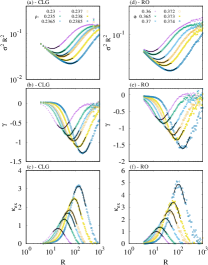
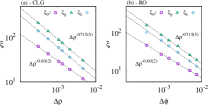
Fig. 7 shows that both for the RO and the CLG models, the length scale diverges at the critical point with exponent . Conversely, the length scales and diverge with critical exponent .
II Correlation of the coarse-grained density
In Fig. 2 of the main text we have extracted a length scale from the decay of the correlation function of the density coarse-grained over a length scale . In Fig. 8(a)-(c) we compare maps of the density coarse-grained at different length scales. Panel (d) shows that the decay length does not critically depend on . The amplitude of the correlation, however, does depend on , so that the amplitude vanishes as decreases.
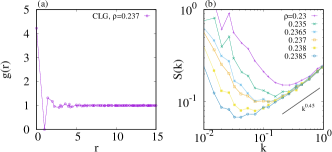
We stress that the correlation length of the coarse-grained density does not reflect correlations in the radial distribution function. Indeed, the radial correlation function attains its limiting value on a length scale much smaller than , and hence of , as apparent from Fig. 9a. Similarly, the structure factor, illustrated in Fig. 9b, suggests suppression of the density fluctuations up to a length scales increasing on approaching the critical point, and not the existence of other characteristic length scales. We note that these results for the structure factor are analogous to those previously observed in HexnerLevine2015 .
III CLG model in thee spatial dimensions
To check the dimensionality dependence of our findings, we have performed simulations of the CLG model in three spatial dimensions. Fig. 10 illustrate the dependence of (a) scaled variance, (b) skewness and (c) excess kurtosis on the coarse-graining length scale. Results are qualitatively analogous to those observed in two dimensions, e.g. Fig. 7(a), (b) and (c), suggesting that the general phenomenology remains the same. We are unable to perform a detailed investigation of the three dimensional results due their huge computational cost. The noisy data in Fig. 10, in fact already involve simulations of systems with 100 millions of particles.
IV Other models
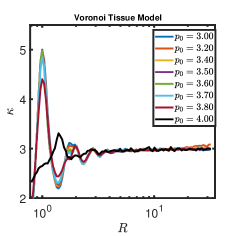
We illustrate in Fig. 11 the dependence of the Kurtosis on the coarse graining length scale for the Voronoi model of cell tissue. In this model, the parameter drives a transition/crossover from a solid to a fluid phase at , in the direction of increasing . The system is known to be effectively hyperuniform at the critical point and in the fluid phase ZhengPicaCiamarra2020 . In the figure, we observe a rapid monotonic decay of the kurtosis to its Gaussian value independent of its distance from the critical point. The kurtosis does not indicate the existence of additional correlations beyond hyperuniformity. The Voronoi model, therefore, is an example of a effectively hyperuniform and Gaussian systems.