Multimodal Joint Attribute Prediction and Value Extraction for E-commerce Product
Abstract
Product attribute values are essential in many e-commerce scenarios, such as customer service robots, product recommendations, and product retrieval. While in the real world, the attribute values of a product are usually incomplete and vary over time, which greatly hinders the practical applications. In this paper, we propose a multimodal method to jointly predict product attributes and extract values from textual product descriptions with the help of the product images. We argue that product attributes and values are highly correlated, e.g., it will be easier to extract the values on condition that the product attributes are given. Thus, we jointly model the attribute prediction and value extraction tasks from multiple aspects towards the interactions between attributes and values. Moreover, product images have distinct effects on our tasks for different product attributes and values. Thus, we selectively draw useful visual information from product images to enhance our model. We annotate a multimodal product attribute value dataset that contains 87,194 instances, and the experimental results on this dataset demonstrate that explicitly modeling the relationship between attributes and values facilitates our method to establish the correspondence between them, and selectively utilizing visual product information is necessary for the task. Our code and dataset are available111https://github.com/jd-aig/JAVE.
1 Introduction
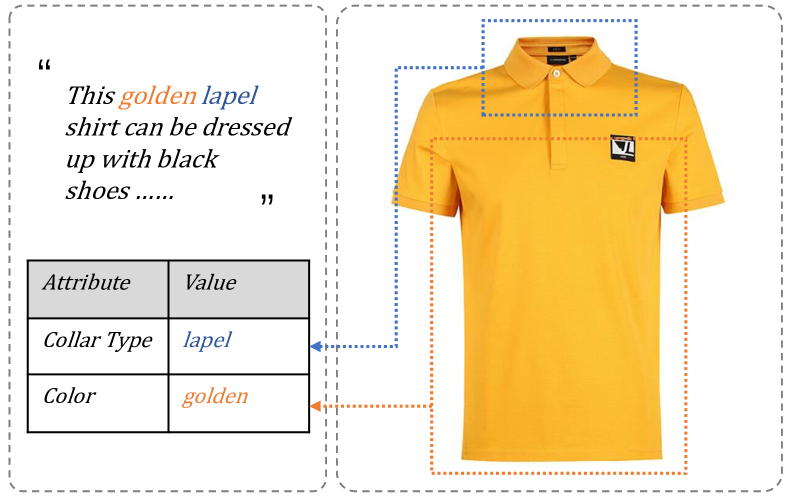
Product attribute values that provide details of the product are crucial parts of e-commerce, which help customers to make purchasing decisions and facilitate retailers on many applications, such as question answering system Yih et al. (2015); Yu et al. (2017), product recommendations Gong (2009); Cao et al. (2018), and product retrieval Liao et al. (2018); Magnani et al. (2019). While product attribute values are pervasively incomplete for a massive number of products on the e-commerce platform. According to our statistics on a mainstream e-commerce platform in China, there are over 40 attributes for the products in clothing category, but the average count of attributes present for each product is fewer than 8. The absence of the product attributes seriously affects customers’ shopping experience and reduces the potential of successful trading. In this paper, we propose a method to jointly predict product attributes and extract the corresponding values with multimodal product information, as shown in Figure 1.
Though plenty of systems have been proposed to supplement product attribute values Putthividhya and Hu (2011); More (2016); Shinzato and Sekine (2013); Zheng et al. (2018); Xu et al. (2019), the relationship between product attributes and values are not sufficiently explored, and most of these approaches primarily focus on the text information. Attributes and values are, however, known to strongly depend on each other, and vision can play a particularly essential role for this task.
Intuitively, product attributes and values are mutually indicative. Given a textual product description, we can extract attribute values more accurately with a known product attribute. We model the relationship between product attributes and values from the following three aspects. First, we apply a multitask learning Caruana (1997) method to predict the product attributes and the values jointly. Second, we extract values with the guidance of the predicted product attributes. Third, we adopt a Kullback-Leibler (KL) Kullback and Leibler (1951) measurement to penalize the inconsistency between the distribution of the product attribute prediction and that of the value extraction.
Furthermore, beyond the textual product descriptions, product images can provide additional clues for the attribute prediction and value extraction tasks. Figure 1 illustrates this phenomenon. Given a description “This golden band collar shirt can be dressed up with black shoes”, the term “golden” can be ambiguous for predicting the product attributes. While by viewing the product image, we can easily recognize the attribute corresponding to “golden” is “Color” instead of “Material”. Moreover, the product image can indicate that the term “black” is not an attribute value of the current product; thus, it should not be extracted. This may be tricky for the model based on purely textual descriptions, but leveraging the visual information can make it easier. In addition, multimodal information shows promising efficiency on many tasks Lu et al. (2016); Li et al. (2017); Anderson et al. (2018); Li et al. (2018); Yu et al. (2019); Li et al. (2019); Tan and Bansal (2019); Liu et al. (2019); Su et al. (2020); Li et al. (2020). Therefore, we propose to incorporate visual information into our task. First, we selectively enhance the semantic representation of the textual product descriptions with a global-gated cross-modality attention module that is anticipated to benefit attribute prediction task with visually grounded semantics. Moreover, for different values, our model selectively utilizes visual information with a regional-gated cross-modality attention module to improve the accuracy of values extraction.
Our main contributions are threefold:
-
•
We propose an end-to-end model to predict product attributes and extract the corresponding values.
-
•
Our model can selectively adopt visual product information by global and regional visual gates to enhance the attribute prediction and value extraction model.
-
•
We build a multimodal product attribute value dataset that contains 87,194 instances, involving various product categories.
2 Model
2.1 Overview
In this work, we tackle the product attribute-value pair completion task, i.e., predicting attributes and extracting the corresponding values for e-commerce products. The input of the task is a “textual product description, product image” pair, and the outputs are the product attributes (there may be more than one attribute in the descriptions) and the corresponding values. We model the product attribute prediction task as a sequence-level multilabel classification task and the value extraction task as a sequence labeling task.
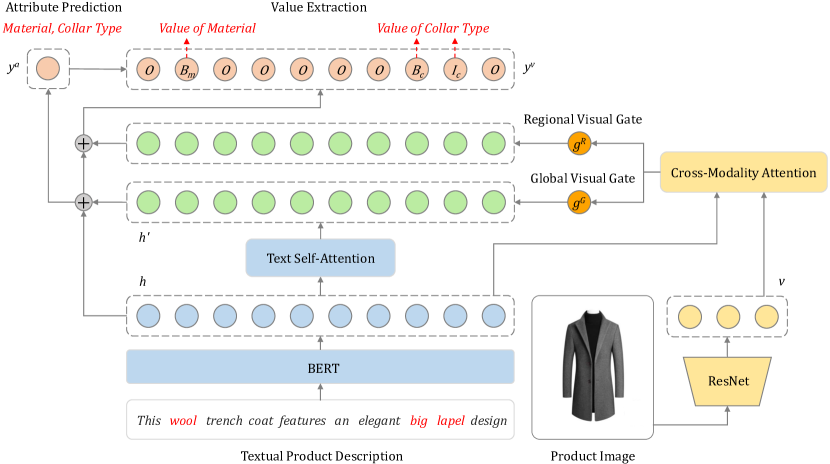
The framework of our proposed Multimodal Joint Attribute Prediction and Value Extraction model (M-JAVE) is shown in Figure 2. The input sentence is encoded by a pretrained BERT model Devlin et al. (2019), and the image is encoded by a pretrained ResNet model He et al. (2016). The global-gated cross-modality attention layer encodes text and image into the multimodal hidden representations. Then, the M-JAVE model predicts the product attributes based on the multimodal representations. Next, the model extracts the values based on the previously predicted product attributes and the multimodal representations obtained through the regional-gated cross-modality attention layer. We apply the multitask learning framework to jointly model the product attribute prediction and value extraction. Considering the constraints between the product attributes and values, we adopt a KL loss to penalize the inconsistency between the distribution of the product attribute prediction and that of the value extraction.
2.2 Text Encoder
The text embedding vectors are encoded by a BERT-base model, which uses a concatenation of WordPiece Wu et al. (2016) embeddings, positional embeddings, and segment embeddings as the input representation. In addition, a special classification embedding () is inserted as the first token, and a special token () is added as the final token. Given a textual product description sentence decorated with two special tokens , BERT outputs an embedding sequence .
2.3 Image Encoder
2.4 Global-Gated Cross-Modality Attention Layer
Intuitively, for a specific product, as different modalities are semantically pertinent, we apply a cross-modality attention module to incorporate the textual and visual semantics into the multimodal hidden representations.
Inspired by the self-attention mechanism Vaswani et al. (2017), we build a cross-modality attention layer capable of directly associating source tokens at different positions of the sentence and different regions of the image, by computing the attention score between each token-token pair and token-region pair, respectively. We argue that what is crucial to the cross-modality attention layer is the ability to selectively enrich the semantic representation of a sentence through the aid of an image. In other words, we need to avoid introducing noises resulted from when the image fails to represent some semantic meaning of words, such as abstract concepts. To achieve this, we design a global visual gate to filter out visual noise for any words that are irrelevant based on the visual signals.
Specifically, we feed the text and image representations and into the global-gated cross-modality attention layer, and then we obtain the enhanced multimodal representation as follows:
| (1) | ||||
| (2) | ||||
| (3) | ||||
| (4) | ||||
| (5) |
where , , , , , are weight matrices, and is the dimension of .
The global visual gate is determined by the representation of the sentence and the image, which are obtained by the text encoder and the image encoder, respectively, as follows:
| (6) |
where and are weight matrices.
2.5 Product Attribute Prediction
For an instance in the dataset, given , where denotes the instance with -th attribute label, to predict the product attributes, we feed the text representation , the multimodal representation , and perceptron (the special classification element in BERT) into a feed-forward layer to output the predicted attribute labels :
| (7) |
where , and are weight matrices.
Then we calculate the loss of the attribute prediction task by binary cross entropy over all labels:
| (8) |
2.6 Product Value Extraction
We regard the value extraction as a sequence labeling task that tags the input with the label sequence in the format, e.g., attribute label “Material” corresponds to tags “B-Material” and “I-Material”.
We argue that the product attributes can provide crucial indications for the attribute values. For example, given a sentence “The red collar and golden buttons in the shirt form a colorful fashion topic” and the predicted product attribute “Color”, it is easy to recognize the value “golden” corresponding to attribute “Color” instead of “Material”. Thus, we incorporate the result of the product attribute prediction to improve the value extraction.
Moreover, for a given product attribute, some regions of the image corresponding are more important than others. Thus, we set a gate for each image region to obtain a weighted visual semantic representation, which aims to use the regional image information more efficiently. Specifically, we feed text representation , multimodal representation , and image representation into a regional-gated cross-modality attention layer and output the value labels :
| (9) |
where , , , and are weight matrices.
The regional visual gate is determined by the regional visual semantics and the product attributes as follows:
| (10) |
where and are weight matrices.
Then we calculate the loss of the value extraction task by cross entropy:
| (11) |
2.7 Multitask Learning
To jointly model product attribute prediction and value extraction, our method is trained end-to-end via minimizing and coordinatively.
Moreover, the outputs of attribute prediction and value extraction are highly correlated, and thus we adopt a KL constraint between the outputs. Given the -th attribute label, we assume that there are two corresponding value extraction tags e.g., attribute label “Material” corresponds to tags “B-Material” and “I-Material”, and their probabilities can be expressed as and . Then the attribute prediction distribution mapped from the output of the corresponding value extraction task can be assigned as , where
| (12) |
The KL loss is:
| (13) |
and the final joint loss function is
| (14) |
3 Dataset
We collect a Multimodal E-commerce Product Attribute Value Extraction (MEPAVE) dataset with textual product descriptions and product images. Specifically, we collect instances from a mainstream Chinese e-commerce platform222https://www.jd.com/. Crowdsourcing annotators are well-experienced in the area of e-commerce. Given a sentence, they are required to annotate the position of values mentioned in the sentence and label the corresponding attributes. In addition, the annotators also need to check the validity of the product text-image from its main page in e-commerce websites, and the unqualified ones will be removed. We randomly select 1,000 instances to be annotated three times to ensure annotation consistency; the consistency rate is 92.83. Finally, we obtained 87,194 text-image instances consisting of the following categories of products: Clothes, Pants, Dresses, Shoes, Boots, Luggage, and Bags, and involving 26 types of product attributes such as “Material”, “Collar Type”, “Color”, etc. The distribution of different product categories and attribute values is shown in Table 1. We randomly split all the instances into a training set with 71,194 instances, a validation set with 8,000 instances, and a testing set with 8,000 instances.
| Category | Product | Instance | Attr | Value |
|---|---|---|---|---|
| Clothes | 12,240 | 34,154 | 14 | 1,210 |
| Shoes | 9,022 | 20,525 | 10 | 1,036 |
| Bags | 3,376 | 8,307 | 8 | 631 |
| Luggage | 1,291 | 2,227 | 7 | 275 |
| Dresses | 4,567 | 12,283 | 13 | 714 |
| Boots | 713 | 2,090 | 11 | 322 |
| Pants | 2,832 | 7,608 | 13 | 595 |
| Total | 34,041 | 87,194 | 26 | 2,129 |
IV et al. (2017) release the English Multimodal Attribute Extraction (MAE) dataset. Each instance in the MAE dataset contains a textual product description, a collection of images, and attribute-value pairs, where the values are not constrained to present in the textual product description. To verify our model on the MAE dataset, we select the instances whose values are in the textual product description, and we label the values by exactly matching. We denote this subset of the MAE dataset as MAE-text and the rest as MAE-image (values can be only inferred by the images).
4 Experiment
We compare our proposed methods with the following baselines: WSM is the method that uses attribute values in the training set to retrieve the attribute values in the testing set by word matching. Sep-BERT is the pretrained BERT model with feed-forward layers to perform these two subtasks separately. RNN-LSTM Hakkani-Tür et al. (2016), Attn-BiRNN Liu and Lane (2016), Slot-Gated Goo et al. (2018), and Joint-BERT Chen et al. (2019) are the models to address intent classification and slot filling tasks, which are similar to the attribute prediction and value extraction, and we adopt these models to our task. RNN-LSTM and Attn-BiRNN use a bidirectional LSTM and an attention-based model for joint learning, respectively. Slot-Gated introduces a gate-based mechanism to learn the relationship between these two tasks. Joint-BERT finetunes the BERT model with joint learning. ScalingUp Xu et al. (2019) adopts BiLSTM, CRF, and attention mechanism for introducing hidden semantic interaction between attribute and text.
We report the results of our text-only and multimodal models, i.e., JAVE and M-JAVE. In addition, to eliminate the influences of different text encoders, we also conduct experiments with BiLSTM as the text encoder. Details about hyper-parameters are shown in Table 2.
| Item | Value |
|---|---|
| Text Hidden Size | 768 |
| Image Hidden Size | 2048 |
| Image Block Number | 49 (7*7) |
| Attention Vector Size | 200 |
| Max Sequence Length | 46 |
| Learning Rate | 0.0001 |
| Activation Function | sigmoid |
| Lambda for KL Loss | 0.5 |
| Batch Size | 128 |
| Epoch Number | 50 |
| Model Size | 112M |
| GPU | 1x NVIDIA Tesla P40 |
| Training Time | 50 minutes |
| Model | Attribute | Value |
|---|---|---|
| WSM | 77.20 | 72.52 |
| Sep-BERT | 86.34 | 83.12 |
| RNN-LSTM Hakkani-Tür et al. (2016) | 85.76 | 82.92 |
| Attn-BiRNN Liu and Lane (2016) | 86.10 | 83.28 |
| Slot-Gated Goo et al. (2018) | 86.70 | 83.35 |
| Joint-BERT Chen et al. (2019) | 86.93 | 83.73 |
| ScalingUp Xu et al. (2019) | - | 77.12 |
| JAVE (LSTM based) | 87.88 | 84.09 |
| JAVE (BERT based) | 87.98 | 84.78 |
| M-JAVE (LSTM based) | 90.19 | 86.41 |
| M-JAVE (BERT based) | 90.69 | 87.17 |
4.1 Main Results
We evaluate our model on two subtasks, including attribute prediction and value extraction. The main results in Table 3 show that our proposed M-JAVE model based on the BERT and the Bidirectional LSTM (BiLSTM) both outperform the baselines significantly (paired t-test, p-value ), which proves an excellent generalization ability of our methods. From the results of our proposed M-JAVE and JAVE models, we can observe that the BERT is advantageous over the LSTM and visual product information improves the performance. The M-JAVE model achieves the best performance of 90.69 and 87.17 scores on two subtasks.
Moreover, experimental results demonstrate the superiority of our JAVE model (either based on LSTM or BERT) against the models of WSM, RNN-LSTM, Sep-BERT, and joint-learning based models including Attn-BiRNN, Slot-Gated and Joint-BERT, indicating that the strategies for integrating the relationship between attributes and values into our models are necessary for the tasks. We evaluate the ScalingUp model to predict the value for each given attribute on our dataset, and the result is unsatisfactory. With the in-depth study, we found that it can be ascribed to identifying values that do not correspond to the given attribute. Over 34.52 of the predicted values are not the actual values for the input attributes, whereas this number is only 16.51 for our JAVE model. As a result, the ScalingUp model obtains a higher recall score (93.78) while a lower precision score of (65.48) than our model (89.82 for recall score and 80.27 for the precision score). We argue that explicitly modeling the relationship between attributes and values facilitates our methods to establish the correspondence between them.
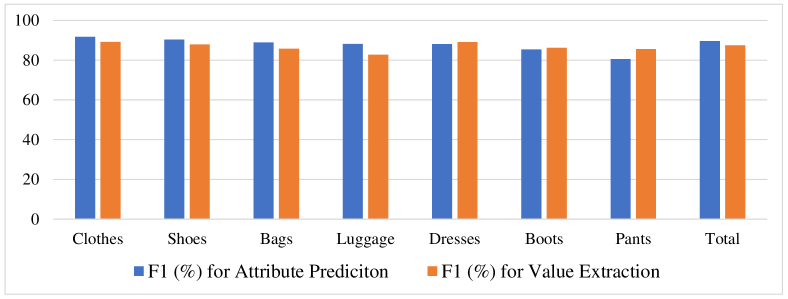
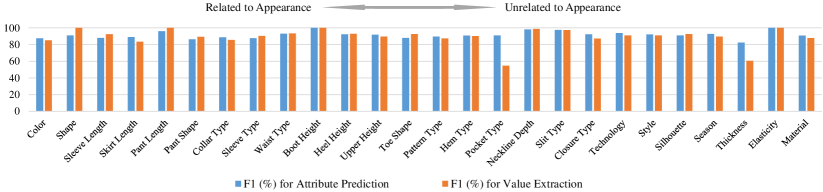
More details including the results for each product category and for each type of attribute are shown in Figure 3 and 4. We can find that our proposed method achieves satisfactory results for every category, and is not only suitable for simple attributes related to appearance, such as “Color” and “Pant Length”, but also can deal with complex attributes, such as “Elasticity” and “Material”.
To verify the adaptability of our proposed models, we conduct experiments on the English MAE dataset IV et al. (2017). The model proposed along with the MAE dataset takes textual product descriptions, visual information, and product attributes as input and treats the attribute value extraction task as predicting the value for a given product attribute. Thus, we compare our M-JAVE model with the MAE-model only on the value extraction task.
| Model | MAE | MAE-text | MAE-image |
|---|---|---|---|
| MAE-model | 59.48 | 72.96 | 52.11 |
| M-JAVE (LSTM) | - | 74.41 | - |
| M-JAVE (BERT) | - | 75.01 | - |
As shown in Table 4, on the MAE-text subset, our M-JAVE (LSTM) and M-JAVE (BERT) models outperform the MAE-model with 1.45 and 2.05 accuracy gains, respectively. On the original MAE and MAE-image subset, the accuracy scores of the MAE-model are 59.48 and 52.11, respectively, which are much lower than that on the MAE-text subset. We argue that it may be risky to predict the product values that do not appear in the textual product descriptions, and defining the value prediction as an extractive-based task is more reasonable for practical applications.
4.2 Ablation Study
We perform ablation studies to confirm the effectiveness of the main modules of our models.
| Model | Attribute | Value |
|---|---|---|
| JAVE | 87.98 | 84.78 |
| JAVE w/o MTL | 87.36 | 83.99 |
| JAVE w/o AttrPred | 86.74 | 83.90 |
| JAVE w/o KL-Loss | 87.24 | 84.26 |
| JAVE (UpBound of Attribute Task) | 89.03 | 100.0 |
| JAVE (UpBound of Value Task) | 100.0 | 88.72 |
4.2.1 Modeling the Relationship between Product Attributes and Values
We explore the relationship between attributes and values from three aspects, including 1) applying the multitask learning to jointly predict the product attributes and values, 2) extracting values based on the predicted product attributes, and 3) introducing a KL loss to penalize the inconsistency between the results of product attributes and values.
Based on our text-only model, i.e., JAVE, we conduct experiments to evaluate the effectiveness of modeling the relationship by ablating the modules corresponding to the above three aspects.
Furthermore, we get the upper bound of attribute prediction training with the ground-truth values (Eq. 13); we get the upper bound of value extraction training with the ground-truth attributes (Eq. 9 and 13).
Table 5 shows a comparison of the JAVE model concerning the ablations. We can see that the JAVE model achieves the best performance. The results of the method “JAVE w/o MTL”, “JAVE w/o AttrPred”, and “JAVE w/o KL loss” drop the scores by 0.62, 1.24, and 0.74 respectively for product attribute prediction, and drop the scores by 0.79, 0.88 and 0.52 respectively for value extraction, showing the effectiveness of modeling the relationship between product attributes and values. The results for the upper bound study shows the strong correlation between product attribute prediction and value extraction.
| Model | Attribute | Value |
|---|---|---|
| M-JAVE | 90.69 | 87.17 |
| M-JAVE w/o Visual Info (JAVE) | 87.98 | 84.78 |
| M-JAVE w/o Global-Gated CrossMAtt | 88.52 | 85.90 |
| M-JAVE w/o Regional-Gated CrossMAtt | 88.29 | 85.38 |
| M-JAVE w/o Global Visual Gate | 87.27 | 80.32 |
| M-JAVE w/o Regional Visual Gate | 87.66 | 82.54 |
4.2.2 Integrating Visual Product Information
Our model mainly utilizes visual information of products from two aspects, including 1) predicting product attributes with a global-gated cross-modality attention module, and 2) extracting values with a regional-gated cross-modality attention module. We evaluate the effectiveness of visual product information as follows.
-
•
w/o Visual Info is the model without utilizing visual information (i.e., JAVE).
-
•
w/o Global-Gated CrossMAtt is the model without the global-gated cross-modality attention (i.e., remove the right part in Eq. 5).
-
•
w/o Regional-Gated CrossMAtt is the model without the regional-gated cross-modality attention (i.e., remove the right-most part in Eq. 9 inside the softmax function).
-
•
w/o Global Visual Gate is the model without the global visual gate (i.e., remove in Eq. 5).
-
•
w/o Regional Visual Gate is the model without the regional visual gate, (i.e., remove in Eq. 9).
From Table 6, we can see that removing global-gated or regional-gated cross-modality attention modules degrades the performances on both subtasks, proving the effectiveness of visual information for our task.
Moreover, for the models with cross-modality attention modules while without global or regional visual gates, i.e., M-JAVE w/o Global Visual Gate and M-JAVE w/o Regional Visual Gate, respectively, the performances are worse than that of M-JAVE significantly. Remarkably, the models of M-JAVE w/o Global Visual Gate and M-JAVE w/o Regional Visual Gate underperform the models thoroughly removing visual-related modules.
To sum up, using the visual product information indiscriminately poses detrimental effects on the model, and selectively utilizing visual product information with global and regional visual gates are essential for our tasks. Further experiment about the visual information is in the Appendices.
4.3 Adversarial Evaluation of Attribute Prediction and Value Extraction
To further verify whether the visual product information can improve the performance of product attribute prediction and value extraction, we adopt an adversarial evaluation method (Elliott, 2018) that measures the performance variation when our model is presented with a random incongruent image.
The awareness score of a model on an evaluation dataset is defined as follows:
| (15) |
Where denotes the image awareness. x, y denote the the text and the values of the product, respectively. v, denote the congruent image and the incongruent image, respectively.
We use the score to calculate awareness score for a single instance:
| (16) |
Under this definition, the output of the evaluation performance measure should be higher in the presence of the congruent data than incongruent data, i.e., . If this is the case, on average, then the overall image awareness of a model is positive. This can only happen when model outputs are evaluated more favourably in the presence of the congruent image data than the incongruent image data.
To determine if a model passes the proposed evaluation, we conduct the statistical test using the pairs of values that are calculated in the process of computing the image awareness scores (Eq. 16)
Table 7 shows the evaluation results of product attribute prediction and value extraction. We find that, on both subtasks, the scores with incongruent images are much lower than that with the congruent images, and is significant positive. Moreover, we use separate p values from each test based on Fisher’s method, and get =6790.80, 0.0001 in product attribute prediction and =780.80, 0.0001 in value extraction, which proves that the incongruent image significantly degrades the model’s performance. We can conclude that the visual information make substantial contribution to the attribute prediction and value extraction tasks.
| C | I | ||
|---|---|---|---|
| Value | 87.48 | 78.570.23 | 11.260.18 |
| Attribute | 89.57 | 86.640.13 | 3.20.08 |
4.4 Domain Adaptation
To verify the robustness of our models, we conduct an evaluation on the out-of-domain data. The source domain is our formal product information (PI) mentioned in Section 3. The target domain is the oral Question-Answering (QA), where the textual description consists of QA pairs about the product in the real e-commerce customer service dialogue, and the visual information is from the image of product mentioned in the dialogue. We directly apply the JAVE and M-JAVE models trained on PI to test on the QA testing set containing 900 manually annotated instances.
As shown in Table 8, on the QA testing set, M-JAVE outperforms JAVE with 4.31 and 5.70 scores on the attribute prediction and value extraction tasks, respectively. For the attribute prediction task, the gap between the results on the PI and QA testing reduces from 14.58 to 12.98 when using the visual information. Similarly, the gap reduces from 14.31 to 11.00 for the value extraction task. This demonstrates that visual product information makes our model more robust.
| Attribute | Value | |||||
|---|---|---|---|---|---|---|
| Models | PI | QA | PI | QA | ||
| JAVE | 87.98 | 73.40 | 14.58 | 84.78 | 70.47 | 14.31 |
| M-JAVE | 90.69 | 77.71 | 12.98 | 87.17 | 76.17 | 11.00 |
4.5 Low-Resource Evaluation
| % of data | 100% | 80% | 60% | 40% | 20% |
|---|---|---|---|---|---|
| Attribute | |||||
| JAVE | 87.98 | 86.830.31 | 84.810.64 | 76.892.81 | 72.133.64 |
| M-JAVE | 90.69 | 88.480.21 | 86.140.52 | 81.231.66 | 78.702.92 |
| Value | |||||
| JAVE | 84.78 | 82.770.45 | 78.810.82 | 74.122.42 | 66.574.24 |
| M-JAVE | 87.17 | 86.610.28 | 83.880.67 | 79.671.87 | 74.633.23 |
To further verify the robustness of our model, we evaluate our models trained with subsets of the whole training set in different proportions. For each proportion, we randomly sample the training data three times, and we report the mean and standard deviation in Table 9. It illustrates that visual product information brings considerable advantages on the robustness when few training instances are available.
4.6 Visualization
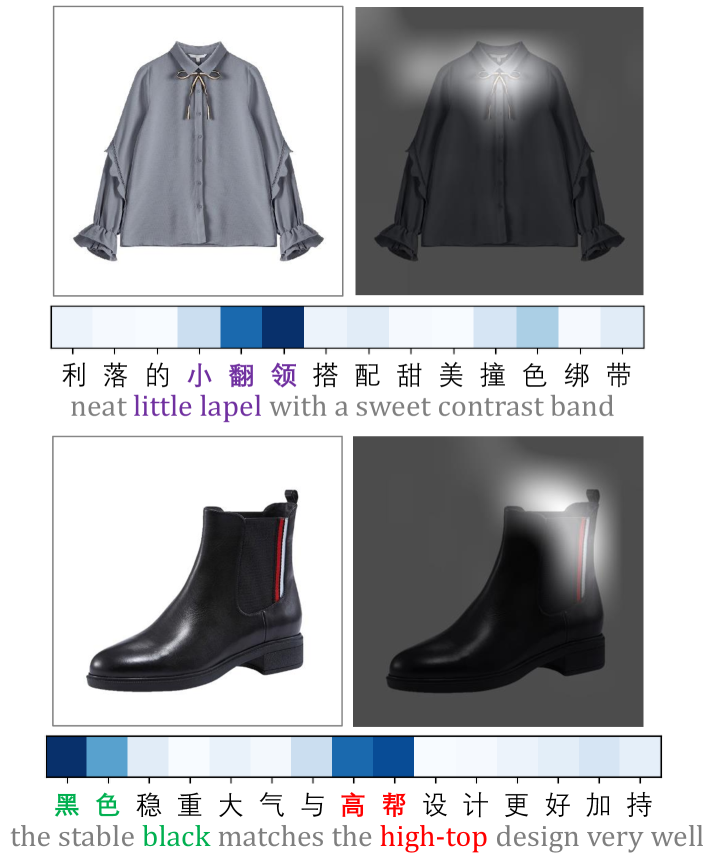
To evaluate the global and regional visual gates qualitatively, we visualize these gates for different attribute values with the M-JAVE model. The results are shown in Figure 5. For the blocks above the text, the deeper color denotes the larger value for the global visual gate , i.e., more visual information is used for enhancing the semantic meaning of the text. We can find that the global visual gates are positively related to the relevance between the text and the image. For the product image on the right, the lighter color denotes the larger value for the regional visual gate , i.e., more visual information is drawn for extracting values. The results demonstrate that the regional visual gate successfully captures useful parts of the product image.
5 Related Work
Recent approaches related to the attribute value pair completion task can be classified as the following two categories.
1) Predicting integral attribute-value tags. Putthividhya and Hu (2011) and Zheng et al. (2018) introduce a set of entity tags for each attribute (e.g., “B-Material” and “I-Material” for the attribute “Material”). Putthividhya and Hu (2011) adopt a NER system with bootstrapping to predict values, and Zheng et al. (2018) apply a Bi-LSTM-CRF model with the attention mechanism. It may be challenging to handle the massive amounts of attributes in the real world.
2) Predicting values for given attributes. Ghani et al. (2006) treat the task as a value classification task and create a specific text classifier for each given attribute. More (2016) and Xu et al. (2019) formulate the task as a special case of NER Bikel et al. (1999); Collobert et al. (2011) task that predicts the values for each attribute. More (2016) combines CRF and structured perceptron with a curated normalization scheme to predict values, and Xu et al. (2019) regard attributes as queries and adopt BIO tags for any attributes, making it applicable for the large-scaled attribute system. However, our experimental results show that the model of Xu et al. (2019) may be insufficient to identify which attribute a value corresponds to.
In this paper, we propose a third category of method: jointly predicting attributes and extracting values. The attribute prediction module provides guidance and constraints for the value extraction module, which adapts our model to fit large-scaled attribute applications. Moreover, we explicitly model the relationship between attributes and values, which helps to establish the correspondence between them effectively.
6 Conclusion
We jointly tackle the tasks of e-commerce product attribute prediction and value extraction from multiple aspects towards the relationship between product attributes and values, and we prove that the models can benefit a lot from visual product information. The experimental results show that the correlations between product attributes and values are valuable for this task, and visual information should be selectively used.
References
- Anderson et al. (2018) Peter Anderson, Xiaodong He, Chris Buehler, Damien Teney, Mark Johnson, Stephen Gould, and Lei Zhang. 2018. Bottom-up and top-down attention for image captioning and visual question answering. In 2018 IEEE Conference on Computer Vision and Pattern Recognition, CVPR 2018, Salt Lake City, UT, USA, June 18-22, 2018, pages 6077–6086.
- Bikel et al. (1999) Daniel M. Bikel, Richard M. Schwartz, and Ralph M. Weischedel. 1999. An algorithm that learns what’s in a name. Mach. Learn., 34(1-3):211–231.
- Cao et al. (2018) Min Cao, Sijing Zhou, Honghao Gao, and Youhuizi Li. 2018. A novel hybrid collaborative filtering approach to recommendation using reviews: The product attribute perspective (S). In The 30th International Conference on Software Engineering and Knowledge Engineering, Hotel Pullman, Redwood City, California, USA, July 1-3, 2018, pages 7–10.
- Caruana (1997) Rich Caruana. 1997. Multitask learning. Machine learning, 28(1):41–75.
- Chen et al. (2019) Qian Chen, Zhu Zhuo, and Wen Wang. 2019. BERT for joint intent classification and slot filling. CoRR, abs/1902.10909.
- Collobert et al. (2011) Ronan Collobert, Jason Weston, Léon Bottou, Michael Karlen, Koray Kavukcuoglu, and Pavel P. Kuksa. 2011. Natural language processing (almost) from scratch. J. Mach. Learn. Res., 12:2493–2537.
- Deng et al. (2009) Jia Deng, Wei Dong, Richard Socher, Li-Jia Li, Kai Li, and Fei-Fei Li. 2009. ImageNet: A large-scale hierarchical image database. In 2009 IEEE Computer Society Conference on Computer Vision and Pattern Recognition (CVPR 2009), 20-25 June 2009, Miami, Florida, USA, pages 248–255.
- Devlin et al. (2019) Jacob Devlin, Ming-Wei Chang, Kenton Lee, and Kristina Toutanova. 2019. BERT: Pre-training of deep bidirectional transformers for language understanding. In Proceedings of the 2019 Conference of the North American Chapter of the Association for Computational Linguistics, pages 4171–4186, Minneapolis, Minnesota.
- Elliott (2018) Desmond Elliott. 2018. Adversarial evaluation of multimodal machine translation. In Proceedings of the 2018 Conference on Empirical Methods in Natural Language Processing, Brussels, Belgium, October 31 - November 4, 2018, pages 2974–2978.
- Ghani et al. (2006) Rayid Ghani, Katharina Probst, Yan Liu, Marko Krema, and Andrew E. Fano. 2006. Text mining for product attribute extraction. SIGKDD Explorations, 8(1):41–48.
- Gong (2009) SongJie Gong. 2009. Employing user attribute and item attribute to enhance the collaborative filtering recommendation. JSW, 4(8):883–890.
- Goo et al. (2018) Chih-Wen Goo, Guang Gao, Yun-Kai Hsu, Chih-Li Huo, Tsung-Chieh Chen, Keng-Wei Hsu, and Yun-Nung Chen. 2018. Slot-gated modeling for joint slot filling and intent prediction. In Proceedings of the 2018 Conference of the North American Chapter of the Association for Computational Linguistics: Human Language Technologies, Volume 2 (Short Papers), pages 753–757, New Orleans, Louisiana.
- Hakkani-Tür et al. (2016) Dilek Hakkani-Tür, Gökhan Tür, Asli Çelikyilmaz, Yun-Nung Chen, Jianfeng Gao, Li Deng, and Ye-Yi Wang. 2016. Multi-domain joint semantic frame parsing using bi-directional RNN-LSTM. In Interspeech 2016, 17th Annual Conference of the International Speech Communication Association, San Francisco, CA, USA, September 8-12, 2016, pages 715–719.
- He et al. (2016) Kaiming He, Xiangyu Zhang, Shaoqing Ren, and Jian Sun. 2016. Deep residual learning for image recognition. In 2016 IEEE Conference on Computer Vision and Pattern Recognition, CVPR 2016, Las Vegas, NV, USA, June 27-30, 2016, pages 770–778.
- IV et al. (2017) Robert L. Logan IV, Samuel Humeau, and Sameer Singh. 2017. Multimodal attribute extraction. In 6th Workshop on Automated Knowledge Base Construction, AKBC@NIPS 2017, Long Beach, California, USA, December 8, 2017.
- Kullback and Leibler (1951) Solomon Kullback and Richard A Leibler. 1951. On information and sufficiency. The annals of mathematical statistics, 22(1):79–86.
- Li et al. (2020) Haoran Li, Peng Yuan, Song Xu, Youzheng Wu, Xiaodong He, and Bowen Zhou. 2020. Aspect-aware multimodal summarization for chinese e-commerce products. In The Thirty-Fourth AAAI Conference on Artificial Intelligence, AAAI 2020, pages 8188–8195.
- Li et al. (2018) Haoran Li, Junnan Zhu, Tianshang Liu, Jiajun Zhang, and Chengqing Zong. 2018. Multi-modal sentence summarization with modality attention and image filtering. In Proceedings of the Twenty-Seventh International Joint Conference on Artificial Intelligence, IJCAI 2018, July 13-19, 2018, Stockholm, Sweden, pages 4152–4158.
- Li et al. (2017) Haoran Li, Junnan Zhu, Cong Ma, Jiajun Zhang, and Chengqing Zong. 2017. Multi-modal summarization for asynchronous collection of text, image, audio and video. In Proceedings of the 2017 Conference on Empirical Methods in Natural Language Processing, pages 1092–1102, Copenhagen, Denmark.
- Li et al. (2019) Haoran Li, Junnan Zhu, Cong Ma, Jiajun Zhang, and Chengqing Zong. 2019. Read, watch, listen, and summarize: Multi-modal summarization for asynchronous text, image, audio and video. IEEE Transactions on Knowledge and Data Engineering, 31(5):996–1009.
- Liao et al. (2018) Lizi Liao, Xiangnan He, Bo Zhao, Chong-Wah Ngo, and Tat-Seng Chua. 2018. Interpretable multimodal retrieval for fashion products. In 2018 ACM Multimedia Conference on Multimedia Conference, MM 2018, Seoul, Republic of Korea, October 22-26, 2018, pages 1571–1579.
- Liu and Lane (2016) Bing Liu and Ian Lane. 2016. Attention-based recurrent neural network models for joint intent detection and slot filling. In Interspeech 2016, 17th Annual Conference of the International Speech Communication Association, San Francisco, CA, USA, September 8-12, 2016, pages 685–689.
- Liu et al. (2019) Xiaojing Liu, Feiyu Gao, Qiong Zhang, and Huasha Zhao. 2019. Graph convolution for multimodal information extraction from visually rich documents. In Proceedings of the 2019 Conference of the North American Chapter of the Association for Computational Linguistics: Human Language Technologies, Volume 2 (Industry Papers), pages 32–39, Minneapolis, Minnesota.
- Lu et al. (2016) Jiasen Lu, Jianwei Yang, Dhruv Batra, and Devi Parikh. 2016. Hierarchical question-image co-attention for visual question answering. In Advances in Neural Information Processing Systems 29: Annual Conference on Neural Information Processing Systems 2016, December 5-10, 2016, Barcelona, Spain, pages 289–297.
- Magnani et al. (2019) Alessandro Magnani, Feng Liu, Min Xie, and Somnath Banerjee. 2019. Neural product retrieval at walmart.com. In Companion of The 2019 World Wide Web Conference, WWW 2019, San Francisco, CA, USA, May 13-17, 2019, pages 367–372.
- More (2016) Ajinkya More. 2016. Attribute extraction from product titles in ecommerce. CoRR, abs/1608.04670.
- Putthividhya and Hu (2011) Duangmanee Putthividhya and Junling Hu. 2011. Bootstrapped named entity recognition for product attribute extraction. In Proceedings of the 2011 Conference on Empirical Methods in Natural Language Processing, pages 1557–1567, Edinburgh, Scotland, UK.
- Shinzato and Sekine (2013) Keiji Shinzato and Satoshi Sekine. 2013. Unsupervised extraction of attributes and their values from product description. In Proceedings of the Sixth International Joint Conference on Natural Language Processing, pages 1339–1347, Nagoya, Japan.
- Su et al. (2020) Weijie Su, Xizhou Zhu, Yue Cao, Bin Li, Lewei Lu, Furu Wei, and Jifeng Dai. 2020. VL-BERT: pre-training of generic visual-linguistic representations. In 8th International Conference on Learning Representations, ICLR 2020, Addis Ababa, Ethiopia, April 26-30, 2020.
- Tan and Bansal (2019) Hao Tan and Mohit Bansal. 2019. LXMERT: Learning cross-modality encoder representations from transformers. In Proceedings of the 2019 Conference on Empirical Methods in Natural Language Processing and the 9th International Joint Conference on Natural Language Processing (EMNLP-IJCNLP), pages 5100–5111, Hong Kong, China.
- Vaswani et al. (2017) Ashish Vaswani, Noam Shazeer, Niki Parmar, Jakob Uszkoreit, Llion Jones, Aidan N. Gomez, Lukasz Kaiser, and Illia Polosukhin. 2017. Attention is all you need. In Advances in Neural Information Processing Systems 30: Annual Conference on Neural Information Processing Systems 2017, 4-9 December 2017, Long Beach, CA, USA, pages 5998–6008.
- Wu et al. (2016) Yonghui Wu, Mike Schuster, Zhifeng Chen, Quoc V. Le, Mohammad Norouzi, Wolfgang Macherey, Maxim Krikun, Yuan Cao, Qin Gao, Klaus Macherey, Jeff Klingner, Apurva Shah, Melvin Johnson, Xiaobing Liu, Lukasz Kaiser, Stephan Gouws, Yoshikiyo Kato, Taku Kudo, Hideto Kazawa, Keith Stevens, George Kurian, Nishant Patil, Wei Wang, Cliff Young, Jason Smith, Jason Riesa, Alex Rudnick, Oriol Vinyals, Greg Corrado, Macduff Hughes, and Jeffrey Dean. 2016. Google’s neural machine translation system: Bridging the gap between human and machine translation. CoRR, abs/1609.08144.
- Xu et al. (2019) Huimin Xu, Wenting Wang, Xin Mao, Xinyu Jiang, and Man Lan. 2019. Scaling up open tagging from tens to thousands: Comprehension empowered attribute value extraction from product title. In Proceedings of the 57th Annual Meeting of the Association for Computational Linguistics, pages 5214–5223, Florence, Italy.
- Yih et al. (2015) Wen-tau Yih, Ming-Wei Chang, Xiaodong He, and Jianfeng Gao. 2015. Semantic parsing via staged query graph generation: Question answering with knowledge base. In Proceedings of the 53rd Annual Meeting of the Association for Computational Linguistics and the 7th International Joint Conference on Natural Language Processing (Volume 1: Long Papers), pages 1321–1331, Beijing, China.
- Yu et al. (2017) Mo Yu, Wenpeng Yin, Kazi Saidul Hasan, Cicero dos Santos, Bing Xiang, and Bowen Zhou. 2017. Improved neural relation detection for knowledge base question answering. In Proceedings of the 55th Annual Meeting of the Association for Computational Linguistics (Volume 1: Long Papers), pages 571–581, Vancouver, Canada.
- Yu et al. (2019) Zhou Yu, Jun Yu, Yuhao Cui, Dacheng Tao, and Qi Tian. 2019. Deep modular co-attention networks for visual question answering. In IEEE Conference on Computer Vision and Pattern Recognition, CVPR 2019, Long Beach, CA, USA, June 16-20, 2019, pages 6281–6290.
- Zheng et al. (2018) Guineng Zheng, Subhabrata Mukherjee, Xin Luna Dong, and Feifei Li. 2018. Opentag: Open attribute value extraction from product profiles. In Proceedings of the 24th ACM SIGKDD International Conference on Knowledge Discovery & Data Mining, KDD 2018, London, UK, August 19-23, 2018, pages 1049–1058.