Upgraded GMRT observations of the Coma cluster of galaxies: The observations
Abstract
We have used the upgraded Giant Metrewave Radio Telescope to map the Coma cluster of galaxies at 250–500 MHz and 1050–1450 MHz bands. These 626 and 218 resolutions observations allow detailed radio structures to be determined of all detected radio sources that show both discrete pointlike and extended morphologies. We present images of a subset of 32 brightest ( 30 mJy) and dominant sources, and several sources show discrete pointlike radio morphologies. We find the steepening of the spectra consistent with synchrotron cooling in the majority of sources and the median for spectral indices is 0.78, suggesting that 59% sources have steep spectra. The nature and the statistical properties of the radio sources in the Coma cluster will be discussed in subsequent papers.
Subject headings:
Active galaxies (17); Radio jets (1347); Radio active galactic nuclei (2134); Coma cluster (270); Radio continuum emission (1340); Galaxy clusters (584)1. Introduction
The largest hierarchical units of the distribution of matter in the universe, called clusters are asymmetric structures, located at the intersecting nodes of the filamentary structure of the cosmic web. They are constantly evolving and growing by accreting matter from the surrounding large-scale structures. Beyond radio sources in galaxy clusters, a fraction of merging clusters host cluster-wide diffuse emission, implying the existence of relativistic electrons and a large-scale magnetic field, called the radio halos. These continue to be the topic of much current research. Therefore, probing the gaseous medium in galaxy clusters through the study of radio emission of “halo sources” reveals important information on physical processes in clusters. Of particular interest is the origin of both the relativistic particles and the associated magnetic field, which are required to generate the observed diffuse synchrotron emission.
The prototype cluster, the Coma cluster of galaxies (Abell 1656; = 0.0235 Struble & Rood, 1999) contains more than 30 cluster radio galaxies, of different radio morphologies and of different optical morphological types (Venturi, Giovannini & Feretti, 1990; Waldram et al., 1996; Brown & Rudnick, 2011; Miller, Hornschemeier & Mobasher, 2009; Bonafede et al., 2015). Moreover, the Coma cluster is permeated by giant diffuse radio halo emission (Willson, 1970), which is not identified with any individual galaxy and makes the Coma cluster exceptional in the radio domain. In addition, the two dominant galaxies, NGC 4874 (the brightest cluster galaxy, BCG) and NGC 4889 have a velocity difference of 700 km s-1 between them. Taken together with the presence of radio halo, this suggests that the Coma cluster has undergone a major merger (Fitchett & Webster, 1987; Adami et al., 2005; Okabe, Okura & Futamase, 2010).
Neumann et al. (2001) using XMM-Newton further suggests that NGC 4839 group, located towards the south is also merging with the Coma cluster. This nearby cluster is a strong, X-ray bright and hot (8 keV) source (see, e.g. Simionescu et al., 2013, and references therein), which deviates significantly from spherical symmetry (Eckert et al., 2012), and is a dynamically active, non-cool core system (Edge et al., 1990; Vikhlinin, Forman & Jones, 1999; Neumann et al., 2001).
| Obs_band | Obs. Date | Cal. | No. of Ch. | tint. | FWHM | rms | |
| (MHz) | (hour) | () | (Jy beam-1) | ||||
| (1) | (2) | (3) | (4) | (5) | (6) | (7) | (8) |
| uGMRT array | |||||||
| 250–500 MHz | 2017 Apr 28 | 3C 286 | 200 | 4096 | 1.8 | 6.655.90, 76.39 | 21.1 |
| 1050–1450 MHz | 2017 Apr 26 | 3C 286 | 400 | 8192 | 1.5 | 2.431.95, 69.51 | 12.7 |
The sources at the center of the Coma cluster, both the BCG and NGC 4874, along with the extended radio halo emission are known collectively as Coma C (Willson, 1970). Here, in this paper, the first in the series, we present observations from the upgraded Giant Metrewave Radio Telescope (uGMRT) project targeted at the enigmatic Coma cluster. We aim to make use of the high sensitivity and high resolution of the uGMRT in order to investigate for the first time the detailed radio structures of radio sources in the Coma cluster. Our images have the advantage of high positional accuracy and sensitivity at low radio frequencies.
We assume a CDM cosmology with = 0.27, = 0.73, and = 70 km s-1 Mpc-1. At the redshift of the cluster, 1′ corresponds to 28 kpc. Throughout, positions are given in J2000 coordinates. We define spectral index, , as ; where is the flux density at frequency, . We present our observations and data analysis in Sec. 2 and Sec. 3, respectively. We present our observational results in Sec. 4, and we also discuss radio spectra and luminosities (Sec. 4.2). Sec. 5 summarizes our conclusions and future directions.
2. Observations
The GMRT (Swarup et al., 1991) has been recently upgraded with a completely new set of receivers at frequencies 1500 MHz. This upgrade provides the telescope (nearly) seamless frequency coverage from 50 to 1500 MHz (Gupta et al., 2017).
The Coma cluster of galaxies was re-observed (proposal ddtb270) at band-3 (250–500 MHz band) and band-5 (1050–1450 MHz) of the uGMRT because of increased bandwidth (and hence enhanced () coverage), higher antenna gain, and a lower system temperature of receivers, which all contribute to much improved sensitivity. This enables it to image high resolution structures along with diffuse, low surface brightness extended structures with good angular resolution and with good sensitivity. The time sampling of the data was 2.67 s, which is sufficient to sample the phase fluctuations of the ionosphere and to avoid time smearing for sources at the outer edge of the field of view. The GMRT Wide-band Backend was used as the correlator, spanning the frequency range of 300–500 MHz and 1050–1450 MHz at the 250–500 MHz band and the 1050–1450 MHz band, respectively in two polarizations, RR and LL. A summary of the observational setup is detailed in Table 1.
3. Data Reduction
The data reduction used in this paper follows standard imaging methodologies; however, as uGMRT data reduction is a relatively new process, we summarize below the procedure.
-
(i)
Periodic observations of calibration source 3C 286, once every 30 minutes at the 250–500 MHz band and every 20 minutes at the 1050–1450 MHz band were used to correct for the flux density scale and bandpass shape and to perform phase calibration. The data analysis, including editing of bad data, and gain and bandpass calibrations were carried out using “classic” aips.
-
(ii)
We used the default, revised flux density scale for low frequencies using the coefficients for 3C 286 in the aips task setjy
where is the spectral flux density and is the frequency in GHz (see also Perley & Butler, 2017).
-
(iii)
After the initial calibration, steps (i) and (ii), the 200 MHz of 300–500 MHz data and the 400 MHz of 1050–1450 MHz data were split into five 40 MHz and eight 50 MHz sub-bands, respectively. These sub-bands were analyzed separately with no averaging of the spectral channels.
-
(iv)
Areas of 9 deg2 and 1 deg2 were imaged for 300–500 MHz data and 1050–1450 MHz data, respectively; they are just bigger than the first null of the primary beam to image sources far from the phase center and to correct for antenna based gains.
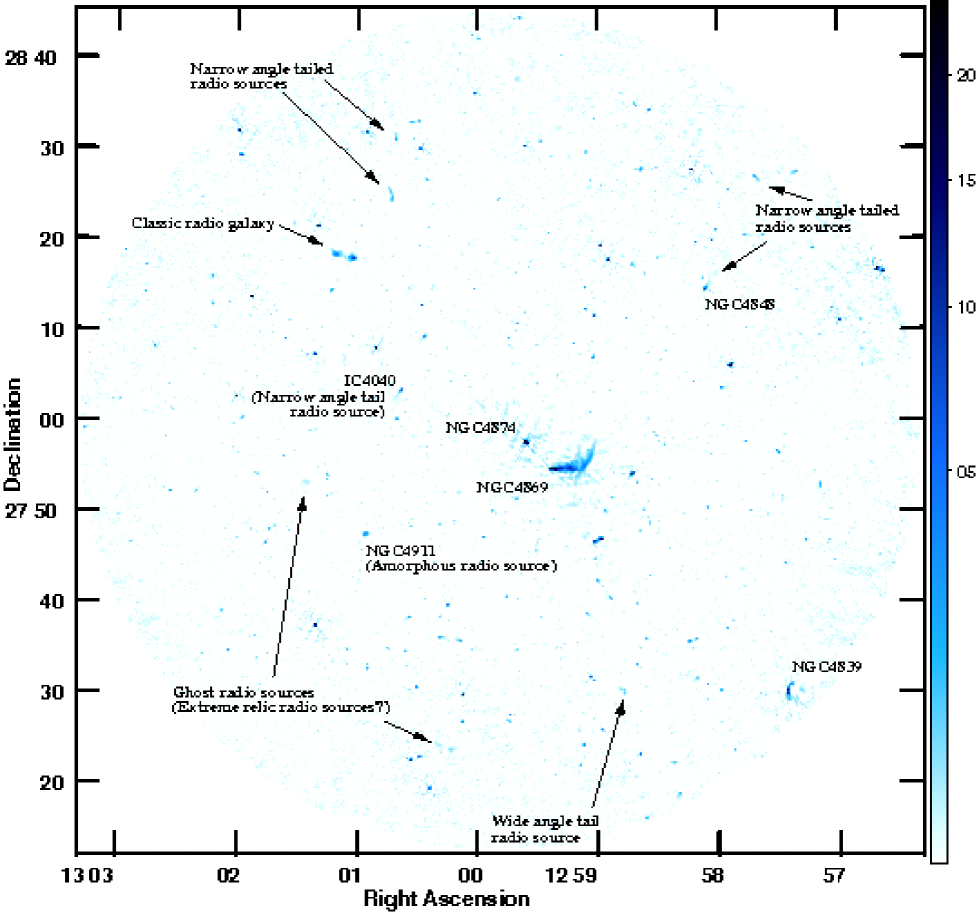
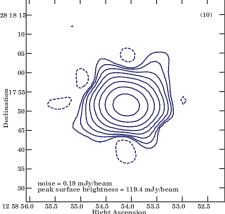
Figure 1.— Image of the Coma cluster of galaxies at the 250–500 MHz band of the uGMRT. The phase center is RA = 12h59m 29s and decl. = 27d55m48s and the radius (or the field of view) is 45′, corresponding to the center frequency, 400 MHz. The synthesized beam is 665 590 at a P.A. of 7639, the peak surface brightness is 114.5 mJy beam-1 and the rms noise is 21 Jy beam-1 (see also Sec 3 for a discussion). The vertical gray scale bar is in units of mJy beam-1. Representative members of the cluster, including BCG NGC 4874 along with representative radio sources, candidate extreme relic radio sources, etc., are labeled, showing a variety in radio morphologies. -
(v)
A standard self-calibration procedure and the method of peeling111First, determine the gains for brightest 5–10 radio sources over the imaged region and subtract these gains from the observed data. Next, image the residual visibilities after flagging whenever needed. These two steps were repeated 10–20 times depending on the frequency of the sub-band, which provided us with the gains for 100 directions over the imaged region. In addition to these brightest ( 30 mJy) and dominant 32 sources discussed here, we only determined the gains in the directions of strong ( 10 mJy) compact sources. We do not perform these steps for the complex/diffuse weak sources, where too many degrees of freedom might add to the problem, and avoid the problem of overfitting (Bhatnagar et al., 2008). were performed in aips on each sub-band of 300–500 MHz data to correct for direction-dependent errors. We aimed to obtain the best possible model of all detected sources in the imaged field. Therefore, we modeled 100, both extended and pointlike, radio sources that are (nearly) uniformly distributed, providing us with the gains for each direction in the sky at this band. This peeling step was useful in removing the direction-dependent gains, including the calibration of ionospheric effects, and hence was employed only for 300–500 MHz data; however, only self-calibration procedure was performed for 1050–1450 MHz data.
-
(vi)
The calibrated data for five 40 MHz and eight 50 MHz sub-bands at the two uGMRT bands were further joined to form full 200 and 400 MHz calibrated visibility data. The combined visibilities were imaged using tclean. In order to ensure image fidelity over the full field and band, we used 3D imaging (gridder = ‘widefield’), two Taylor coefficients (nterms = 2), and Briggs weighting (robust = 0.5) in task tclean.
-
(vii)
Using the model from (vi), a final amplitude and phase self-calibration with a solution interval equal to length of observation was then carried out using gaincal and applycal tasks in casa. The two polarizations, RR and LL were combined to obtain final total intensity image using tclean task in casa as detailed above in step (vi). We built a task wbpbugmrt using the coefficients of an eighth order polynomial fit to the antenna primary beam for the different bands of the uGMRT222uGMRT primary beams:
www.ncra.tifr.res.in/ncra/gmrt/gmrt-users/observing-help/ugmrt-primary-beam-shape, similar to widebandpbcor task in casa. It computes Taylor-coefficient images that represent the primary beam shape of the GMRT antennas and applies them to the output images from tclean task to produce primary beam corrected images.
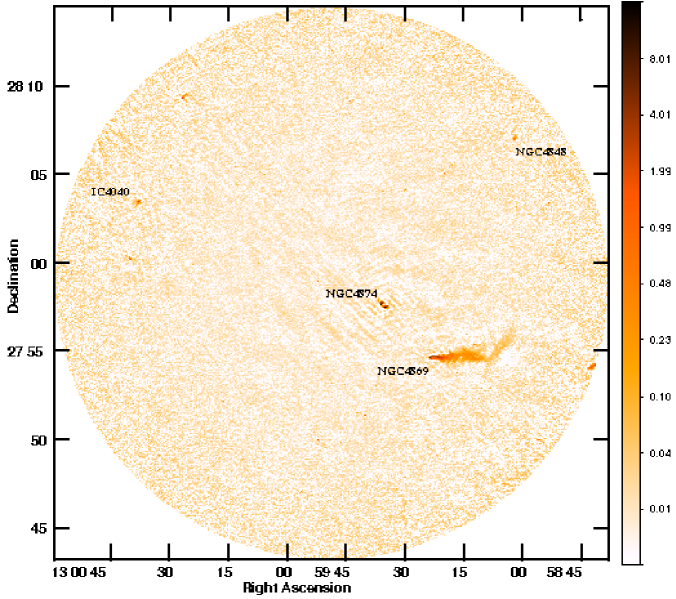
The final images corrected for the primary beam shape of the GMRT antennas for the two bands, shown in Fig. 1 and Fig. 2, have an rms noise of 21 Jy beam-1 and 13 Jy beam-1 at the half power point and a dynamic range of 5300 and 1700, respectively. The error in the estimated flux density, both due to calibration and due to systematic, is 4%. The rms noise is a factor of 1.8–2.1 higher close to the phase center where two dominant radio sources and an extended radio source, NGC 4874, the BCG and NGC 4869, are present. Subsequent analyses of the integrated spectra of all these sources shows that our flux densities measurements are consistent with the literature data (see also Sec. 4.2).
 |
4. Results
The large scale radio morphology of the Coma cluster at the 250–500 MHz band and the 1050–1450 MHz band of the uGMRT is shown in Fig. 1 and Fig. 2, respectively. These are the deepest GMRT images after its upgrade (at the 250–500 MHz band) to our knowledge. Fig. 3 shows images of a subset of the 32 brightest ( mJy) and dominant sources at the 250–500 MHz band and the majority of these show discrete pointlike radio morphologies. Similarly, Fig. 4 shows images of 5 (out of 32) sources imaged in the 156 field of view at the 1050–1450 MHz band. The flux density is determined using aips task jmfit for pointlike, symmetric sources and using aips task tvstat for all extended (source sizes 15′′) irregularly shaped radio sources. The error bars in Table 3 are based on the local rms noise as evaluated in a circle of 5′ in diameter centered on the source position; this is also the error associated with the peak flux density measurement. Table 2 lists these 32 modeled, brightest ( 30 mJy), and both pointlike and extended radio sources present in the field of view (90′ 4′) at 250–500 MHz band after correcting for the primary beam shape. The columns are as follows: (1) source ID; (2 and 3) likely radio core position (R.A. and decl.) at 400 MHz; (4) redshift of source, from NED; and (5) comments on the source structure at the 250–500 MHz band.
4.1. Notes on the dominant radio sources
Salient features of radio morphologies of these brightest ( mJy) and dominant radio sources are presented in Table 2. Below we provide additional notes on our interpretation of the radio morphologies for these radio sources in the order presented in Table 2. We also include notes of the radio morphologies for five sources, Source_IDs, 01, 02, 09, 17 and 20, that were imaged at the 1050–1450 MHz band.
 |
 |
 |
 |
 |
 |
 |
 |
 |
 |
 |
 |
 |
 |
 |
 |
-
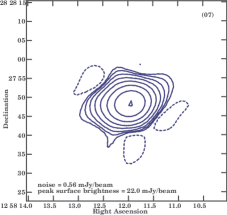
01.
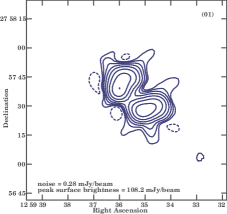
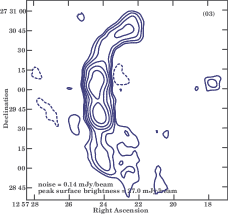
NGC 4874 The dominant BCG of the Coma cluster (Baier & Tiersch, 1990) that is located close to the peak of the distributions of galaxies and X-ray gas. The optical host is a regular low brightness elliptical galaxy (Capetti et al., 2000) located at = 0.02394. It is also a strong radio source with a wide-angle tail (WAT) radio morphology and its projected maximum angular extension is 30′′, corresponding to 15 kpc. We detect the radio core and two radio jets forming a wide angle between them in our uGMRT 250–500 MHz band image.
The source is a dominant cD radio galaxy, where the local thermal noise is a factor of 2.1 higher than at the half power point. In the vicinity of this dominant source, the dynamic range is smallest leading to residual deconvolution (and hence phase calibration) errors (1%) at the 1050–1450 MHz band
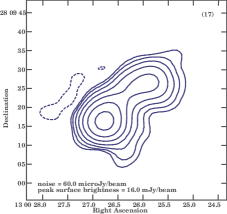
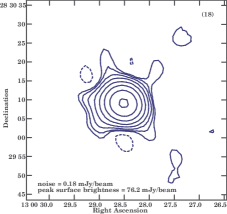
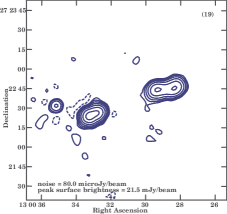
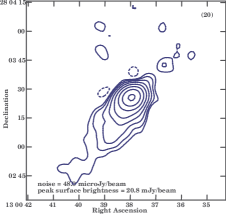
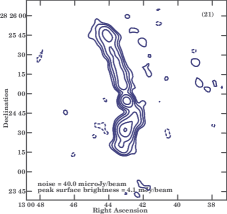
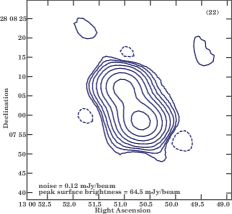
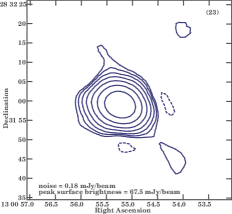
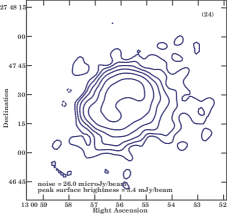
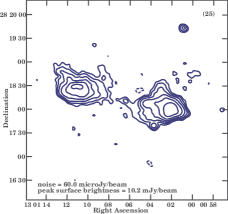
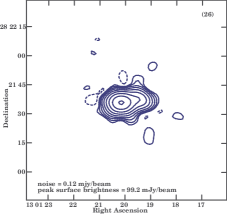
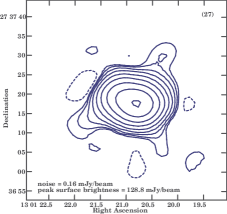
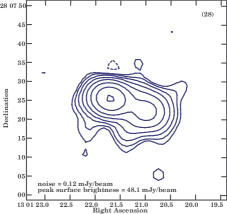
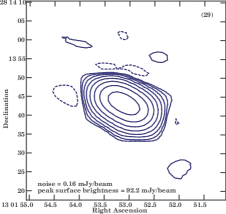
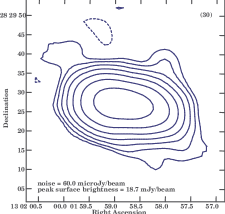
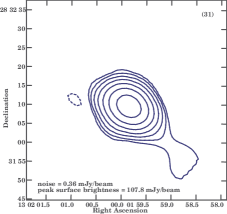
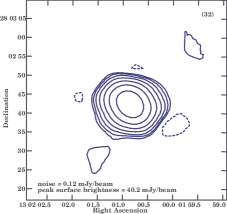
Figure 3.— Continued -
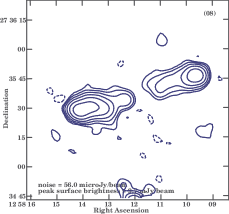
02.
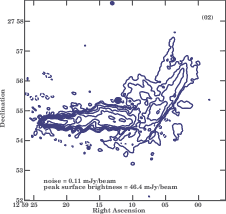
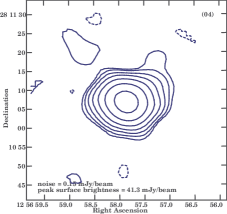
NGC 4869 Another member of the Coma cluster lies well outside the cluster core: 40′ away to the southwest of NGC 4874. The radio source is hosted by an elliptical host (Venturi, Giovannini & Feretti, 1990). The structure of this source is typical of a head-tail, narrow angle tail (NAT, e.g., 3C 129: Lal & Rao, 2004) radio source with a weak unresolved radio core, two oppositely directed radio jets, and a long-low surface brightness tail pointing away from the cluster center. The tailed-jet has a conical shape centered on the nucleus and it initially expands and then recollimates. Subsequently, the radio jet bends by 70 deg with respect to the initial direction of propagation. There is also the presence of diffuse extensions toward the inner edge and sharpness in surface brightness toward the outer edge of the radio source, possibly due to the motion of this head-tail radio source around the dark matter potential.
Our 1050–1450 MHz band uGMRT image again shows a head-tail radio source. We detect the weak radio core, with two narrow angle radio jets pointing away from the radio core forming a long tail. The conical shaped jet centered on the nucleus expands, recollimated and then bends by 70 deg as is seen in our uGMRT 250-500 MHz band image, which is also reported by Feretti et al. (1990). The high surface brightness outer edge is seen, whereas the low surface brightness, diffuse extensions toward the inner edge seen in our low-frequency 250–500 MHz band image are not seen in our high-frequency 1050–1450 MHz band image, probably because of synchrotron cooling (Feretti et al., 1990).
-
03.
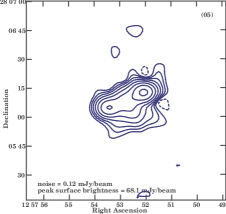
NGC 4839 This is the compact dominant galaxy of the NGC 4839 group and lies in a peripheral Coma cluster region. The optical host is a low/average surface brightness, disk-dominated galaxy (Oemler, 1976). It is located at nearly the same 0.02456 of the Coma cluster. A two-sided radio jet with slight distortions emerging in P.A. 0∘ with a bow shock-like a feature with indications of ram pressure stripping, which suggests that the NGC 4839 group is falling into the Coma cluster (Neumann et al., 2001). The integrated flux density, (= 316.7 mJy; Kim et al., 1994) is a factor of 1.6 higher than our measurement. This is because the radio source is also a relic source lying at the edge of the field of view, where our ability to map low surface brightness diffuse emission is poor.
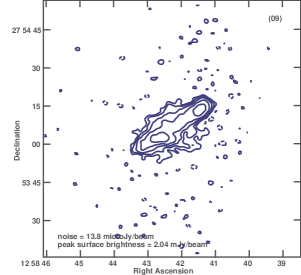
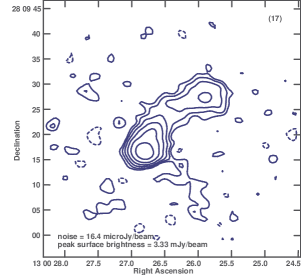
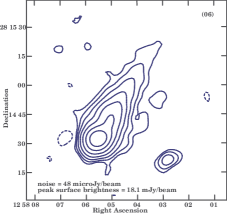
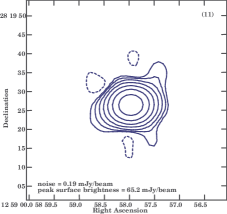
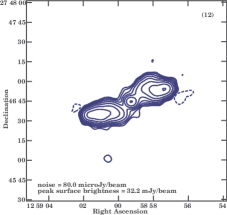
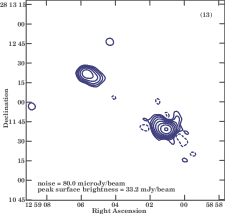
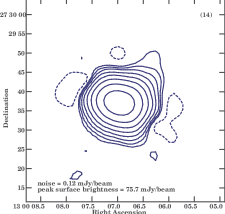
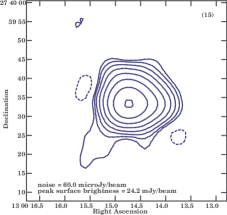
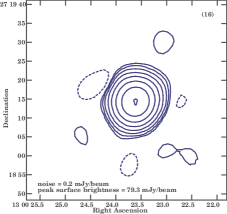
Figure 4.— Images of the five of 32 brightest ( 30 mJy) and dominant, both pointlike and extended radio sources in the Coma cluster detected in a small field of view at the 1050–1450 MHz band of the uGMRT. These radio sources are in the order presented in Table 2. The lowest radio contour plotted is three times the local rms noise and increasing by factors of 2. The local rms noise and continuum peak surface brightness of the source are denoted in each panel (lower-left corner) along with its Source_ID (upper-right corner). - 06.
-
09.
5C 4.70 The uGMRT 1050–1450 MHz band image shows a classic double source FR II radio morphology (Fanaroff & Riley, 1974) consisting of edge-brightened, diffuse lobe emission with clear hot spots at the end of the source.
-
12.
WISEA J125859.32274644.9 A classic two-sided double radio source of FR II radio morphology. The radio core is well detected.
-
13.
SDSS J125903.80281145.6 This again is a classic radio galaxy of FR II radio morphology, though the southwest radio lobe is associated with 5C 4.77 radio source.
-
14.
WISEA J130006.87272936.8 An unresolved radio source, which is 4′′ away from Abell 1656:[EF2011] 1595 (NED classification) source. This NED classified source has a photometric redshift of 0.22001.
Table 2A short summary of the nature of dominant sources in the Coma cluster field at 400 MHz using the uGMRT. Source ID Position at 400 MHz Salient feature of radio morphology R.A. Decl. (1) (2) (3) (4) (5) 01. NGC 4874 12:59:35.71 27:57:33.37 0.02394 The BCG of Coma cluster; 5C 4.85, C1B127 02. NGC 4869 12:59:23.36 27:54:41.73 0.02288 An NAT radio source; 5C 4.81, C1B903 03. NGC 4839 12:57:24.36 27:29:52.14 0.02456 The cD galaxy of NGC 4839 group; 5C 4.51, C1C904 04. WISEA J125656.53281101.4 12:56:57.84 28:11:07.32 A discrete point source that is 19′′ away from 5C 4.45 05. WISEA J125752.93280609.4 12:57:52.74 28:06:08.26 0.45360 An FR II radio galaxy; 5C 4.54, C1B012 06. NGC 4848 12:58:05.54 28:14:32.30 0.02351 An NAT radio source; 5C 4.58, C1A020 & C1A021 07. SDSS J125811.97282748.6 12:58:12.00 28:27:48.87 3.17688 An unresolved radio source; C1A026 08. WISEA J125812.36273534.7 12:58:12.26 27:35:34.11 0.44673 An FR II radio galaxy; C1C042, C1C047 & C1C049 09. 5C 4.70 12:58:42.24 27:54:06.17 A double radio source; C1B065 10. WISEA J125854.14281752.3 12:58:54.12 28:17:52.78 0.38160 Point-like, unresolved radio source; C1A056 11. WISEA J125858.10281924.6 12:58:58.08 28:19:27.41 A discrete point source; 5C 4.75, C1A060 12. WISEA J125859.32274644.9 12:58:59.52 27:46:45.00 0.02300 An FR II radio galaxy; 5C 4.74, C1C61 13. SDSS J125903.80281145.6 12:59:03.43 28:12:01.46 An FR II radio galaxy; C1A061 14. WISEA J130006.87272936.8 13:00:06.84 27:29:37.33 An unresolved source; C1C151 15. SDSS J130014.76273932.8 13:00:14.76 27:39:34.39 0.37984 Amorphous, high surface brightness radio source 16. NVSS J130023271915 13:00:23.76 27:19:14.51 A discrete point and an unresolved source; 5C 4.97 17. WISEA J130026.68280920.0 13:00:26.35 28:09:21.74 A double radio source; 5C 4.102, C1B187 18. FBQS J13002830 13:00:28.44 28:30:10.34 0.64709 A pointlike radio quasar source; 5C 4.105, C1A138 19. SDSS J130030.76272239.4 13:00:31.12 27:22:36.31 A bent wide-angle (triple) radio source 20. IC 4040 13:00:38.16 28:03:24.25 0.02615 An NAT radio source; 5C 4.108, C1B904 21. WISEA J130043.86282458.8 13:00:42.98 28:24:55.23 0.02095 A WAT radio source; 5C 4.113, C1A152, C1A153, C1A156, C1A922 & C1A923 22. WISEA J130050.84280803.6 13:00:50.88 28:08:04.07 A double radio source with core-jet morphology; 5C 4.114 23. SDSS J130055.21283205.7 13:00:55.08 28:32:00.41 A discrete point source 24. NGC 4911 13:00:56.08 27:47:27.02 0.02663 An amorphous, diffuse radio source; 5C 4.117, C1B901 25. WISEA J130106.38281813.0 13:01:06.27 28:18:11.57 0.37339 A radio galaxy; 5C 4.122, C1A169, C1A910 & C1A911 26. HB89 1258286 NED02 13:01:19.92 28:21:37.58 1.37176 A pointlike radio source; 5C 4.127, C1A177 & C1A178 27. WISEA J130120.88273718.4 13:01:21.00 27:37:18.56 An unresolved source; 5C 4.128, C1C205 & C1C206 28. WISEA J130121.84280726.7 13:01:21.36 28:07:25.62 2.26500 A double radio source; 5C 4.129, C1B244 & C1B245 29. WISEA J130153.05281344.0 13:01:53.04 28:13:44.49 An unresolved source; 5C 4.134, C1A187 & C1A188 30. WISEA J130158.70282928.7 13:01:58.80 28:29:28.56 A pointlike dumbbell radio source; 5C 4.137 31. WISEA J130159.77283210.1 13:01:59.88 28:32:11.14 A pointlike source with an extension; 5C 4.138 32. WISEA J130200.78280247.3 13:02:00.96 28:02:43.45 A discrete pointx and an, unresolved source; 5C 4.140, C1B276 -
17.
WISEA J130026.68280920.0 The uGMRT 1050–1450 MHz band image shows a double source of FR II radio morphology, which consists of an edge-brightened, diffuse radio lobe emission with clear hot spots at the end of the source. The two jets have bent after emanating from the radio core, probably because of ram pressure.
-
19.
SDSS J130030.76272239.4 We have classified it to be a triple source because the 2.5 times the rms noise contour shows three bright peaks as a single connected contiguous radio source and the SDSS optical source is located at the center. If our understanding is correct, it is possibly a WAT radio galaxy.
-
20.
IC 4040 A NAT radio source hosted by CGCG 160252 galaxy of spiral or an irregular morphological type. It appears to be undergoing ram pressure stripping (see also Chen et al., 2020).
This NAT source does not show a similar extent in the 1050–1450 MHz band image as compared to the 250–500 MHz band image, probably because of synchrotron cooling.
Table 3The total intensity and spectral index for all dominant sources the Coma cluster field along with radio luminosity for 17 sources with known spectroscopic redshifts. Source ID L (mJy) (mJy) (mJy) (mJy) (mJy) (mJy) (erg s-1 Hz-1) (1) (2) (3) (4) (5) (6) (7) (8) (9) 01. NGC 4874 900 81b 476.6 2.3 454.4 22.7 296.9 2.3 206.3 0.2a 84.0 12.6d 0.67 0.08 6.2 1030 02. NGC 4869 2780 208b 1381.0 5.7 1387.0 69.4 584.1 3.6 402.0 0.7a 108.0 16.2d 0.99 0.20 1.7 1031 03. NGC 4839 660 71.9b 196.9 2.1 316.7 10.4 77.0 0.5a 33.0 5.0d 0.73 0.07 3.0 1030 04. WISEA J12562811 75.9 0.2 10.4 0.5e 1.59 0.02 05. WISEA J12572806 390 58.5b 206.7 0.7 205.0 7.3 75.3 0.4a 30.0 4.5d 0.79 0.05 1.5 1033 06. NGC 4848 90 12.0c 57.4 0.3 54.2 5.0 14.7 0.2a 1.09 0.02 0.7 1030 07. SDSS J12582827 311.8 0.2 88.9 0.4a 1.00 0.02 2.9 1035 08. WISEA J12582735 37.8 0.3 15.8 0.3a 0.70 0.02 2.5 1032 09. 5C 4.70 310 69.4b 134.8 0.4 53.1 0.2 32.9 0.2a 1.13 0.06 10. WISEA J12582817 490 88.7b 210.0 0.5 74.8 0.2a 35.0 5.3d 0.79 0.08 1.1 1033 11. WISEA J12582819 82.6 0.2 68.0 6.8 20.4 0.1a 1.12 0.02 12. WISEA J12582746 590 88.5b 233.9 0.7 69.4 0.2a 15.6 0.8h 1.00 0.08 2.8 1030 13. SDSS J12592811 54.7 0.2 12.9 0.1a 1.15 0.02 14. WISEA J13002729 138.1 0.7 58.4 0.2a 0.69 0.02 15. SDSS J13002739 49.1 0.2 21.9 0.5e 0.64 0.02 2.2 1032 16. NVSS J13002719 103.9 0.2 124.6 28.1 28.6 1.3e 1.03 0.02 17. WISEA J13002809 50 12.0c 29.9 0.3 20.4 0.1 15.3 0.1a 0.53 0.02 18. FBQS J13002830 70 12.0c 91.2 0.2 103.6 12.7 117.2 0.4a 188.0 28.2d 0.31 0.04 8.7 1032 19. SDSS J13002722 76.6 0.3 37.9 0.5e 0.56 0.02 20. IC 4040 110 12.0c 53.3 0.1 48.3 5.0 24.7 0.2 18.3 1.6a 0.85 0.02 0.8 1030 21. WISEA J13002824 60 12.0c 31.3 0.1 9.4 0.2a 0.96 0.02 0.3 1030f 22. WISEA J13002808 240 12.0c 118.1 0.3 113.7 11.4 48.6 1.9e 14.9 0.7h 0.77 0.04 23. SDSS J13002832 100.1 0.2 40.8 0.5e 0.72 0.02 24. NGC 4911 70 12.0c 50.6 0.2 55.7 15.3 19.1 0.3a 0.39 0.02 0.5 1030 25. WISEA J13012818 350 71.1b 209.7 0.4 197.7 10.5 79.5 0.6a 0.77 0.08 1.0 1034 26. HB89 1258286 350 54.6b 182.1 0.6 173.9 11.8 84.7 0.1a 73.0 11.0d 0.44 0.07 1.3 1034 27. WISEA J13012737 207.6 0.5 204.7 20.5 70.5 0.1a 0.86 0.03 28. WISEA J13012807 110 12.0c 82.6 0.6 72.4 7.2 41.9 0.1a 0.54 0.02 3.4 1034 29. WISEA J13012813 390 55.4b 165.7 0.6 181.4 6.7 54.6 0.3a 0.89 0.06 30. WISEA J13012829 76.9 0.7 242.9 8.4g 17.1 1.0e 1.20 0.03 31. WISEA J13012832 150.6 0.9 242.9 8.4g 57.2 0.4e 0.77 0.03 32. WISEA J13022802 120 12.0c 66.4 0.1 88.5 5.2 25.8 0.5a 0.75 0.03 -
21.
WISEA J130043.86282458.8 A WAT radio source with a radio core at the center, which coincides with the WISE source. The northern radio jet seems to be moving straight, whereas the southern jet has been bent. The radio morphology also suggests it to be of a “hybrid”, with the northern jet to be of FR I type and southern jet to be of FR II type. Two jets show varying projected radio sizes, but the southern jet may have encountered more cluster gas, and hence the ram pressure, as compared to the northern jet. The flux density at 1400 MHz = 9.4 0.2 mJy (corresponds to C1A923; Miller, Hornschemeier & Mobasher, 2009), which makes spectral index (400–1400 MHz) = 0.96 0.02. The apparent steep spectrum could possibly be due to extended emission from this WAT source that is resolved at high frequency. (Miller, Hornschemeier & Mobasher, 2009) report that the source deblends with C1A922 and possibly adjoins C1A152, C1A153, and C1A156 as well. Condon et al. (1998) note = 9.2 1.1 mJy (the NVSS survey image), which is consistent with flux density of C1A923 (Miller, Hornschemeier & Mobasher, 2009).
-
23.
SDSS J130055.21283205.7 An unresolved radio source, which is 9′′ away from the WISEA J130055.69283200.8 (NED classification) source. This NED classified WISE source has a photometric redshift of 0.25737.
-
24.
NGC 4911 The host galaxy is a very bright giant early spiral of an Sb morphological type. The source is possibly interacting with its neighbor DRCG 27–62 (Bravo-Alfaro et al., 2000).
-
25.
WISEA J130106.38281813.0 A classical two-sided radio galaxy showing double lobe FR II morphology. The radio lobe toward the west seems to be approaching us since the unresolved radio core and the associated jet are linked to it.
-
26.
HB89 1258286 NED02 A marginally resolved flat spectrum ( = 0.44 0.03) quasar source. In addition to a bright nucleus, the source shows core-jet morphology or a weak extension in the east-west direction. It is a background source and not part of the Coma cluster of galaxies.
-
30.
WISEA J130158.70282928.7 A marginally resolved compact radio source. It seems that the integrated flux density, (= 242.9 mJy; Kim et al., 1994) is a factor of 3.2 higher than our measurement. The Kim et al. (1994) measurement includes flux densities for 5C 4.137 (Source_ID 30) and for 5C 4.138 (Source_ID 31) sources, and hence their combined measurement is consistent within errors with our measurement for these two sources.
-
31.
WISEA J130159.77283210.1 An unresolved radio source with a possible extension toward the southeast. As stated above (see notes on Source_ID 30), the Kim et al. (1994) measurement is consistent within errors with our measurement.
4.2. Integrated radio spectra and luminosities
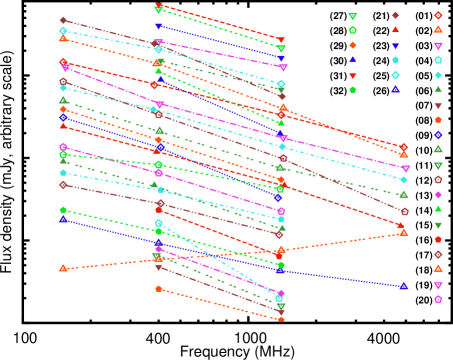
We made comparisons of our measurements to earlier measurements, which provides a good check of our calibration. Table 3 (Cols. 2–7) lists integrated flux densities at frequencies along with error bars in the measurements and hence the integrated spectra (Col. 8, see also Fig. 5) for 32 brightest and dominant, both pointlike and extended, radio sources. Qualitatively, the radio spectra are classified as (i) straight; (ii) curved, both concave and convex; and (iii) complex (Laing& Peacock, 1980). The two mechanisms that are most likely to produce curvature in the spectrum of radiation from an electron energy distribution initially of the power-law form are (e.g. Miley, 1980): (i) synchrotron energy losses, which cause downward curvature at high frequencies, and (ii) self-absorption of radiation from regions of high brightness temperatures, e.g, compact sources. We see in Fig. 5 that within the errors, all our uGMRT measurements and data from the literature fall nearly along with a ‘straight’ power law with some hint of energy losses from synchrotron cooling. This suggests that our flux densities measurements are consistent with the literature data, providing confidence in our data calibration and its reduction methodologies.
Almost all sources, except FBQS J13002830 (Source_ID 18), show steep spectra, an effect attributed to the presence of extended diffuse structures. The spectra for total flux density via. best-fitting regression to data for all sources is reported in Table 3 (Col. 8). The mean and median of these sources are 0.83 and 0.78, respectively, suggesting that 59% sources have steep spectra ( 0.7). Of the sources, seven sources have relatively steep spectra (1.0 1.3) and one source has a very steep spectrum ( 1.3). This very steep spectrum source, WISEA J125752.93280609.4 (Source_ID 04), = 1.59 0.02 could be a possible candidate for a high-redshift radio galaxy (Saxena et al., 2018). The infrared colors are not known to deviate from the predicted relations with redshift for a standard giant elliptical galaxy spectrum. The source (WISEA J125752.93280609.4) is a 13.81 mag source in (NED: 2MASS extended objects, final release), makes it unlikely to be a high-redshift radio galaxy from the - relation for radio galaxies (Lilly & Longair, 1984).
Of the sources, 17 sources have known spectroscopic redshifts (Table 2). Luminosities were evaluated at 400 MHz for the radio emission (Col. 8, Table 3). This frequency was chosen because very accurate flux densities are available, and contributions from compact cores are small. The radio powers have been -corrected to the rest frame of each source (Lal & Ho, 2010).
5. Conclusions
 |
In this first paper of the series, we have presented in the preceding sections details of the observations, data reduction, and performance assessment for the 250–500 MHz band and the 1050–1450 MHz band using uGMRT for the Coma cluster of galaxies. An image of a single field of the 1.75 deg2 and 0.21 deg2 areas have been presented up to the rms noises of 21 Jy beam-1 and 13 Jy beam-1 with 63 and 22 angular resolutions at the 250–500 MHz band and the 1050–1450 MHz band, respectively, representing the deepest uGMRT image at the 250–500 MHz band. We also provide descriptions of radio morphologies and spectra of 32 brightest and dominant, both pointlike and extended, radio sources in the field.
We are undertaking an uGMRT study at 125–250 MHz (band-2), 250–500 MHz (band-3), and 550–850 MHz (band-4) of several clusters to make precise flux density measurements of all detected radio sources and model them, thereby aiming to provide exact estimates of the radio halo emission and statistics. The data presented here along with a wealth of multiwavelength data available is being used to investigate the head-tail radio galaxy, NGC 4869 (Source_ID 02, which will form paper II of this series), to study radio luminosity function, to build a sample of ultra-steep spectrum sources, etc.
D.V.L. thanks the anonymous referee for his/her contributions that considerably improved the manuscript. He also thanks Tiziana Venturi and Dave Green for useful discussions, Ishwara-Chandra C.H. for discussions on some aspects of this project, and Sushan Konar for careful reading of the manuscript. He acknowledges the support of the Department of Atomic Energy, Government of India, under project No. 12-R&D-TFR-5.02-0700. We thank the staff of the GMRT who made these observations possible. The GMRT is run by the National Centre for Radio Astrophysics of the Tata Institute of Fundamental Research. This research has made use of the NED, which is operated by the Jet Propulsion Laboratory, Caltech, under contract with the NASA, and NASA’s Astrophysics Data System.
References
- Adami et al. (2005) Adami, C., Biviano, A., Durret, F. & Mazure, A. 2005, A&A, 443, 17
- Baier & Tiersch (1990) Baier, F. W. & Tiersch, H. 1990, In Proceedings of the ESO Workshop on Extranuclear Activity in Galaxies, Editors, E. J. A. Meurs & R. A. E. Fosbury, Garching, bei Munchen: European Southern Observatory, P. 111
- Becker, White & Edwards (1991) Becker, R. H., White, R. L. & Edwards, A. L. 1991, ApJS, 75, 1
- Bhatnagar et al. (2008) Bhatnagar, S., Cornwell, T. J., Golap, K. & Uson, J. M. 2008, A&A, 487, 419
- Bonafede et al. (2015) Bonafede, A. 2015, In Proceedings of The many facets of extragalactic radio surveys: towards new scientific challenges, Bologna, PoS (EXTRA-RADSUR2015), P. 63.
- Bonafede et al. (2010) Bonafede, A., Feretti, L., Murgia, M., et al. 2010, A&A, 513, A30
- Bravo-Alfaro et al. (2000) Bravo-Alfaro, H., Cayatte, V., van Gorkom, J. H. & Balkowski, C. 2000, AJ, 119, 580
- Brown & Rudnick (2011) Brown, S. & Rudnick, L. 2011, MNRAS, 412, 2
- Capetti et al. (2000) Capetti, A., de Ruiter, H. R., Fanti, et al. 2000, A&A, 362, 871
- Chen et al. (2020) Chen, H., Sun, M., Yagi, M. et al. 2020, MNRAS, 496, 4654
- Condon et al. (1998) Condon, J. J., Cotton, W. D., Greisen, E. W., et al. 1998, AJ, 115, 1693
- Cordey (1985) Cordey, R. A. 1985, MNRAS, 215, 437
- Eckert et al. (2012) Eckert, D., Vazza, F., Ettori, S., et al. 2012, A&A, 541, A57
- Edge et al. (1990) Edge, A. C., Stewart, G. C., Fabian, A. C. & Arnaud, K. A. 1990, MNRAS, 245, 559
- Fanaroff & Riley (1974) Fanaroff B. L. & Riley J. M., 1974, MNRAS, 167, 31
- Feretti et al. (1990) Feretti, L., Dallacasa, D., Giovannini, G. & Venturi, T. 1990, A&A, 232, 337
- Fitchett & Webster (1987) Fitchett, M. & Webster, R. 1987, ApJ, 317, 653
- Gupta et al. (2017) Gupta, Y., Ajithkumar, B., Kale, H., et al. 2017, Current Science, 113, 707
- Kim et al. (1994) Kim, K.-T., Kronberg, P. P., Dewdney, P. E. & Landecker, T. L. 1994, ApJS, 105, 385
- Laing& Peacock (1980) Laing, R. A. & Peacock, J. A. 1980, MNRAS, 190, 903
- Lal & Ho (2010) Lal, D. V. & Ho, L. C. 2010, AJ, 139, 1089
- Lal & Rao (2004) Lal, D. V. & Rao, A. P. 2004, A&A, 420, 491
- Lilly & Longair (1984) Lilly, S. J. & Longair, M. S. 1984, MNRAS, 211, 833
- Miley (1980) Miley, G. K. 1980, ARA&A, 18, 165
- Miller, Hornschemeier & Mobasher (2009) Miller, N. A., Hornschemeier, A. E. & Mobasher, B. 2009, AJ, 137, 4436
- Neumann et al. (2001) Neumann, D. M., Arnaud, M., Gastaud, R., et al. 2001, A&A, 365, L74
- Oemler (1976) Oemler, A. 1976, ApJ, 209, 693
- Okabe, Okura & Futamase (2010) Okabe, N., Okura, Y. & Futamase, T. 2010, ApJ, 713, 291
- Perley & Butler (2017) Perley, R. A. & Butler, B. J. 2017, ApJS 230, 7
- Saxena et al. (2018) Saxena, A., Marinello, M., Overzier, R. A., et al. 2018, MNRAS, 480, 2733
- Simionescu et al. (2013) Simionescu, A., Werner, N., Urban, O., et al. 2013, ApJ, 775, 4
- Struble & Rood (1999) Struble, M. F. & Rood, H. J. 1999, ApJS, 125, 35
- Swarup et al. (1991) Swarup, G., Ananthakrishnan, S., Kapahi, V. K., et al. 1991, Current Science, 60, 95
- Venturi, Giovannini & Feretti (1990) Venturi, T., Giovannini, G. & Feretti, L. 1990, AJ, 99, 1381
- Vikhlinin, Forman & Jones (1999) Vikhlinin, A., Forman, W. R. & Jones, C. 1999, ApJ, 525, 47
- Waldram et al. (1996) Waldram, E. M., Yates, J. A., Riley, J. M. & Warner, P. J. 1996, MNRAS, 282, 779
- Willson (1970) Willson, M. A. G. 1970, MNRAS, 151, 1