VVV Survey Microlensing: Candidate Events with Source in the Far Disk
Abstract
The VVV microlensing search has recently surveyed the region of the Galactic plane at within deg. in the near-infrared (IR), discovering hundreds of microlensing events. In this paper we explore the microlensing events with background sources that might be located in the far disk of the Galaxy, beyond the bulge. We discuss the possible configurations for the microlensing lenses and sources located at different places within the Galactic plane. Then we search for these events using the local red clump centroids of the VVV near-IR color-magnitude diagrams. According to the estimated distances and proper motions, events may have sources located in the far disk. The candidates for far-disk sources show on average longer timescales ( days) than the mean of the timescale distribution for the bulge red clump sources ( days). We conclude that the population of microlensing events in the region , deg. contains a non-negligible number of events with candidate far-disk sources (). Our results are relevant in view of the future microlensing plans with the Roman Space Telescope (formerly WFIRST) in the near-IR.
Subject headings:
Galaxy structure; Galactic bulge; Gravitational lensing; Gravitational microlensing; Interstellar extinction; Near infrared astronomy; Surveys; Microlensing event rate; Microlensing optical depth1. Introduction
††footnotetext: Corresponding author: mariagabriela.navarrouniroma1.itIn the framework of the study of gravitational lenses within the Galaxy, Milky Way (MW) microlensing models and observations are incomplete, because previously they did not take into account or detect the other half of the Milky Way, beyond the Galactic bulge. Distant sources for the microlensing events were considered only for the case of sources in the Sgr dwarf galaxy (e.g. Alcock et al. (1997); Cseresnjes & Alard (2001)), but sources located in the far disk of the MW, lying beyond the bulge (with distances kpc), have been largely ignored. These events in the far disk may be numerous in the MW plane, but current optical microlensing searches are relatively insensitive to them because they explore higher Galactic latitudes.
In fact, the existing models (e.g. Han & Gould (1995, 2003); Wood & Mao (2005); Ryu et al. (2008); Penny et al. (2013, 2019); Henderson et al. (2014); Awiphan et al. (2016); Henderson & Shvartzvald (2016); Poleski (2016); Wegg et al. (2016)) do not consider the events with sources in the far disk of the Milky Way. This is understandable because previous microlensing surveys were carried out at optical wavelengths, exploring regions relatively far from the Galactic plane (where dust obscuration blinds their search). However, the maximum number of microlensing events is expected to occur in the Galactic plane, including in particular the microlensing events with sources in the far disk, which would be located at very low latitudes, where crowding and extinction are also maximal.
The detection of microlensing events with sources in the far disk and the subsequent analysis of the frequency of these events with respect to events with sources in the Galactic bulge is especially interesting for studies of Galactic structure and dynamics.
Near-infrared (IR) microlensing surveys have the potential to observe through the dust in the Galactic plane at and reach far beyond the Galactic bulge. An encouraging development in this vein was the first discovery of a microlensing event with a source on the other side of the Galaxy beyond the Galactic bulge, which was recently made by the UKIRT microlensing survey (Shvartzvald et al., 2018). Likewise, Bennett et al. (2018) reported the discovery of a microlensing event at low latitude. One of the possible configurations discussed in this article is that the star is a subgiant star located on the other side of the Galactic bulge.
Ground-based near-IR microlensing surveys like the UKIRT (Shvartzvald et al., 2017), and the VVV (Navarro et al., 2017, 2018, 2020b) are well-suited for piercing through the Milky Way disk, unveiling its unexplored most distant regions. As argued by Shvartzvald et al. (2017) and Navarro et al. (2017, 2018, 2020b), these near-IR ground-based surveys are pathfinders for the future Nancy Grace Roman Space Telescope (hereafter Roman), formerly known as the Wide-Field InfraRed Survey Telescope or the WFIRST microlensing survey (Spergel et al. (2015); Bennett et al. (2018); Penny et al. (2019)).
The VVV survey in particular has been mapping the inner bulge and southern disk since 2010, and the near-IR photometry and the image resolution are good enough to see structures well beyond the bulge even at low latitudes (Gonzalez et al., 2018), and also to search for microlensing events with sources in the far disk.
The VVV survey microlensing project started searching the Galactic center region (tiles , , and ), finding events (Navarro et al., 2017). We then expanded the area searching for events across the plane at Galactic latitude deg., finding events (of which are red clump events) between Galactic longitudes deg. (Navarro et al., 2018, 2020b). We found asymmetry in the distribution across Galactic longitudes, in the sense that there are about more events at positive longitudes. This asymmetric effect was predicted by the existing models (e.g. Han & Gould (2003)), as a consequence of the barred bulge. In Navarro et al. (2020a) we explored the latitude dependence of microlensing, finding new events along the Galactic minor axis with latitudes deg. We found a steep increase in the number of events toward the Galactic plane at deg., much steeper than any expectations from the previous optical surveys and models. We suggested that this may be due to the presence of far-disk microlensing events.
In this paper we explore the distance distribution of the microlensing sources in more detail, using red clump (RC) giants as tracers. First, we define the different kinds of events with sources in the far disk that have different spatial distributions and kinematics (Section 2). Then we identify specific candidates from the RC sample of Navarro et al. (2018, 2020b) that could correspond to far-disk sources (Section 3). In Section 4 we discuss the different models and detections related to this population. We discuss the results, and we suggest a new strategy for the future Roman Space Telescope observations (Section 5). We present our conclusions are presented in Section 6.
2. Definition of events
In the past it was standard to consider three types of Galactic microlensing events toward the bulge (e.g. Gould (1995)):
Bulge – disk events: with sources in the bulge ( kpc, Dékány et al. (2013)) and lenses in the foreground disk ( kpc);
Disk – disk events: with nearby sources and lenses ( kpc) located in the Galactic disk; and
Bulge – bulge events: with sources and lenses located in the Galactic bulge ( kpc).
Past and present microlensing optical surveys did not need to be concerned about distant Galactic sources located beyond the bulge, because the fields explored were at larger . For example, at deg. in the line of sight beyond the bulge (at a distance kpc), the height below the plane is kpc, and the expected density of disk stars is negligible for a MW disk scale height of kpc. The exceptions to this are the microlensing events with sources in the Sgr dwarf galaxy, located beyond the MW disk (Alcock et al., 1997; Cseresnjes & Alard, 2001).
In fact, previous works discussed the dependence of disk lenses and bulge lenses on the estimated source distance. This is highly ambiguous when the the detection of sources beyond the Galactic bulge becomes a reality.
The VVV survey near-IR photometry allows us to observe very low latitude fields and detect sources well beyond the bulge. In fact, Gonzalez et al. (2018) detected the RC of the spiral arm behind the bulge. Therefore, we consider new families of microlensing events for distant Galactic disk sources, classifying them on the basis of their different positions and kinematics (Navarro et al., 2019):
Far-disk – near-disk events: where far-disk sources are those with distances beyond the Galactic bulge ( kpc) and with disk kinematics, and lenses in the foreground disk ( kpc). These should have very high relative transverse velocities ( km/s)
Far-disk – bulge events: with sources located in the far disk ( kpc) and lenses located in the Galactic bulge ( kpc). These are expected to be the most numerous events with far-disk sources in our data because the stellar density along the line-of-sight peaks in the bulge. The microlensing event recently detected by Shvartzvald et al. (2018) would be classified as a far-disk – bulge event.
Far-disk – far-disk events: with sources and lenses located in the far disk ( kpc). Even though these sources would be faint and reddened, the number of these events would be non-negligible in our data because the effective area of the Galaxy sampled is larger.
Out of these three new families of microlensing events with sources in the far disk discussed here, the far-disk – bulge events would be the most numerous. In fact, this is the most advantageous configuration for the characterization of the microlensing events, because the source distance can be estimated from the photometry/spectroscopy, and the lens distance can be assumed to be in the bulge because the density along the line of sight is always higher in the bulge (according to star counts and all Galactic models).
3. Identifying Candidates
Far-disk sources would be systematically fainter and redder than bulge stars. For example, a typical RC star in the bulge has mag and mag in a low-extinction field like the Baades window with mag, mag. A similar RC star would have mag and mag at the Galactic center field where the extinction is much higher ( mag, mag).
Detecting these sources may be possible. For example, Shvartzvald et al. (2018) detected the first microlensing event in the far disk. They estimated a distance between and kpc depending on the method they adopt. Also, Navarro et al. (2018, 2020b) argued that the observed distribution of VVV microlensing sources may be contaminated by far-disk events.
The best way to prove that we have observed far-disk sources is to estimate source distances accurately. This can be done for RC stars, which are good distance indicators (Paczyński & Stanek, 1998) or using spectroscopy. Additionally, we can argue that there are a few ways to select good candidates of microlensing sources from our sample that may be located in the far disk:
1. The color-magnitude and color-color diagrams (hereafter CMDs and CCDs, respectively) can be used to probe the distant sources (especially for the RC stars), which should be fainter and more reddened than the Galactic bulge RC.
2. The proper motions (PMs) of the microlensing sources (especially the RC stars) should help to detect good candidates of sources that are located in the far disk because they should have systematically different PMs than local disk stars.
3. The microlensing event timescales with sources in the far disk might be different in general depending on the lens locations.
Regarding the CCD and CMD analysis, Gonzalez et al. (2018) detected the RC from the spiral arm behind the bulge using VVV photometry. These RC stars from the spiral arm in the far disk are fainter and more reddened than the bulge giants. The magnitude difference depends on Galactic longitude, because the barred bulge is inclined with respect to the line of sight. For example, if the far-disk arm is located at a distance of about 12 kpc on average, the difference in distance modulus in magnitudes with the bulge should be mag at deg., mag at deg., and mag at deg., respectively (assuming kpc). Adopting a larger distance to the far-disk arm kpc, these numbers change to , and mag, respectively. These are very large magnitude differences, readily measurable with the VVV photometry. We select the most likely candidate microlensing sources from the far disk taking into account these expected magnitude differences as a function of Galactic longitude. In addition, if there is dust extinction between the bulge and the far arm, the distant sources would appear more reddened and even fainter.
The main problem with detecting the far-disk candidates is the differential reddening (Alonso-García et al., 2017). In order to account for this effect, the RC sources should be identified relative to their local RC centroids. With these points in mind, we proceed to select candidates from the RC sample of Navarro et al. (2018) following a four-step procedure.
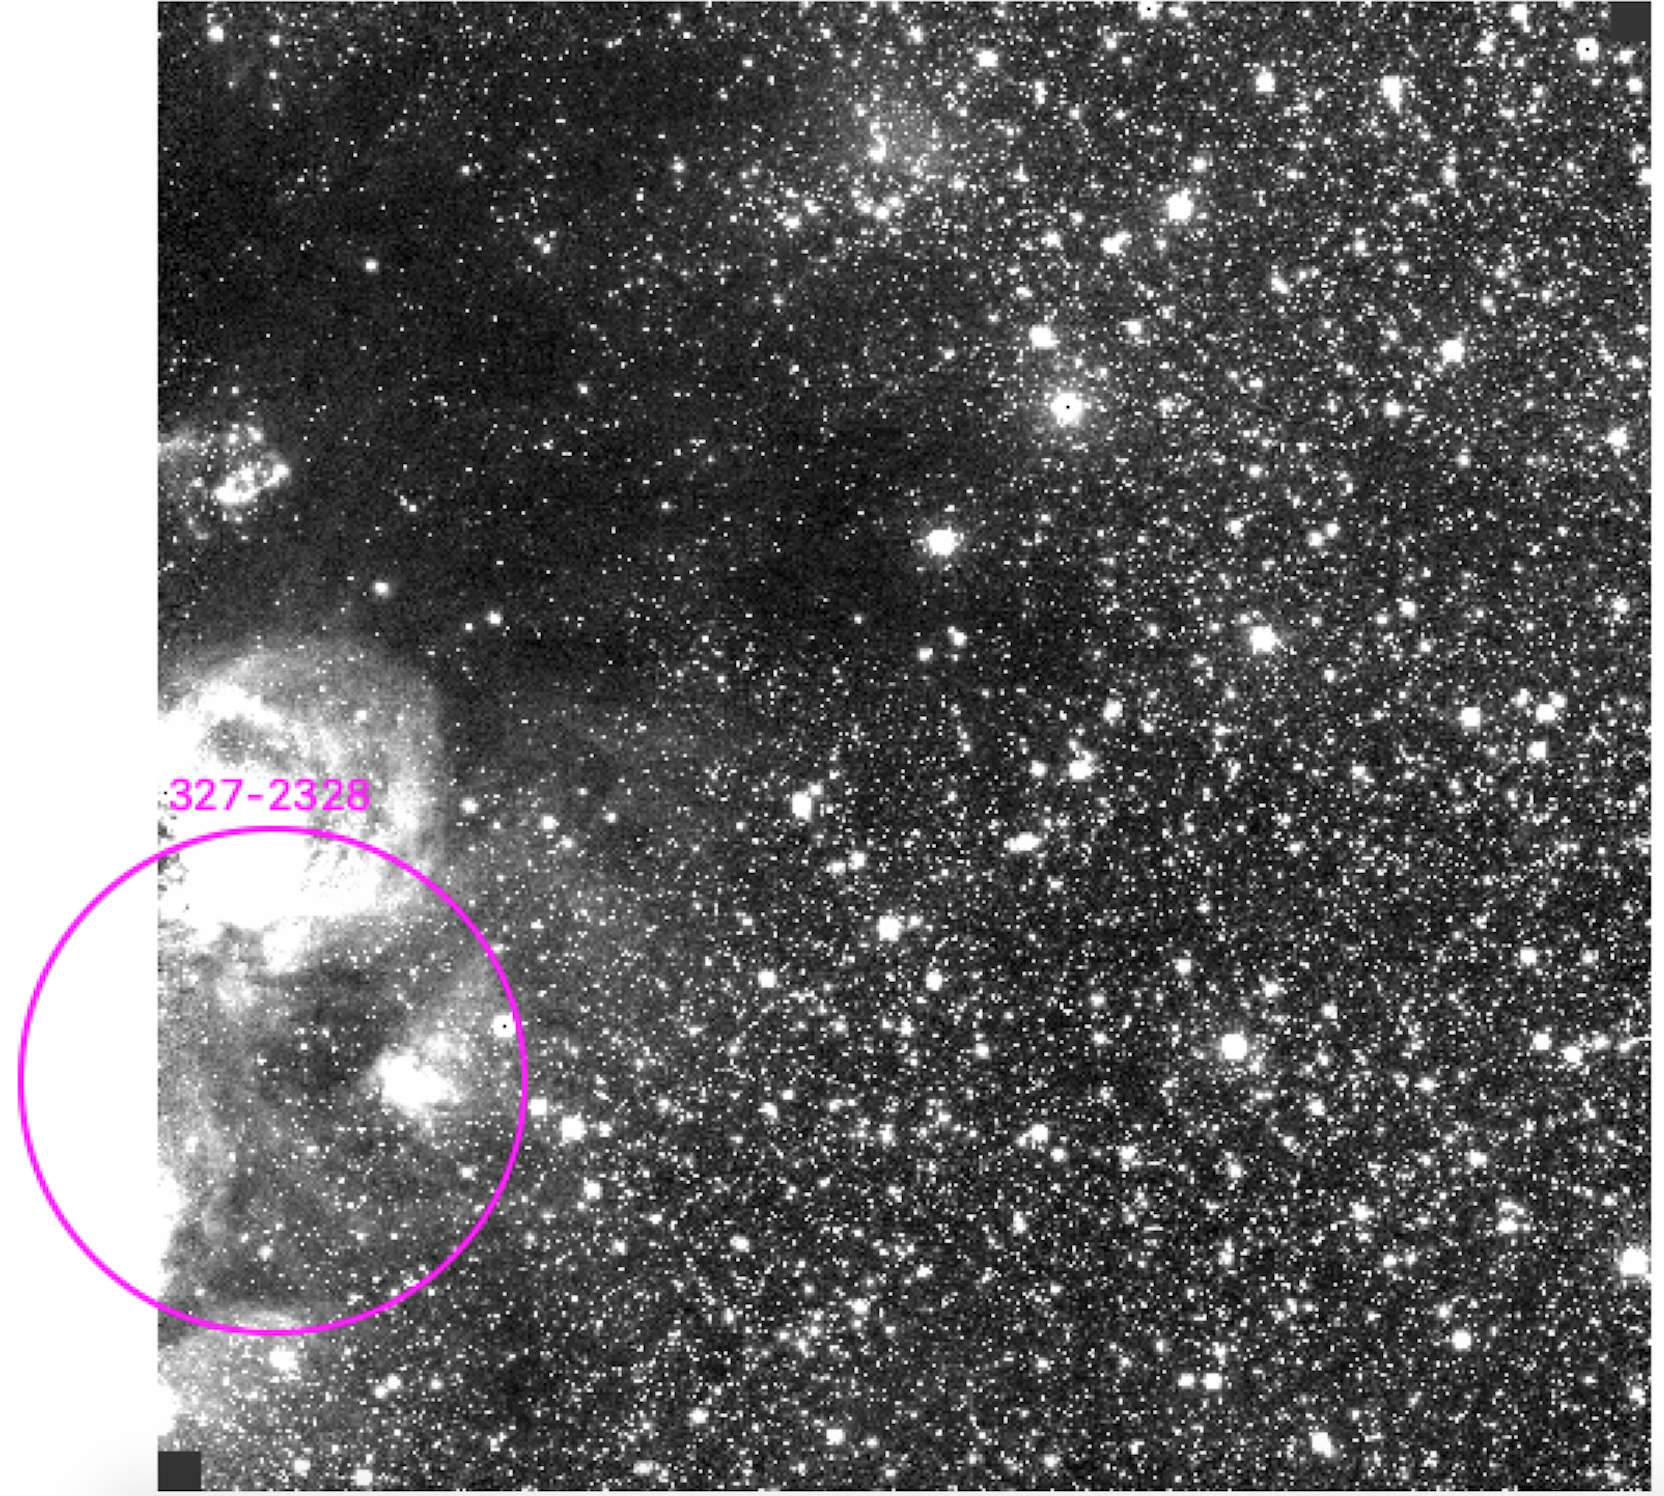
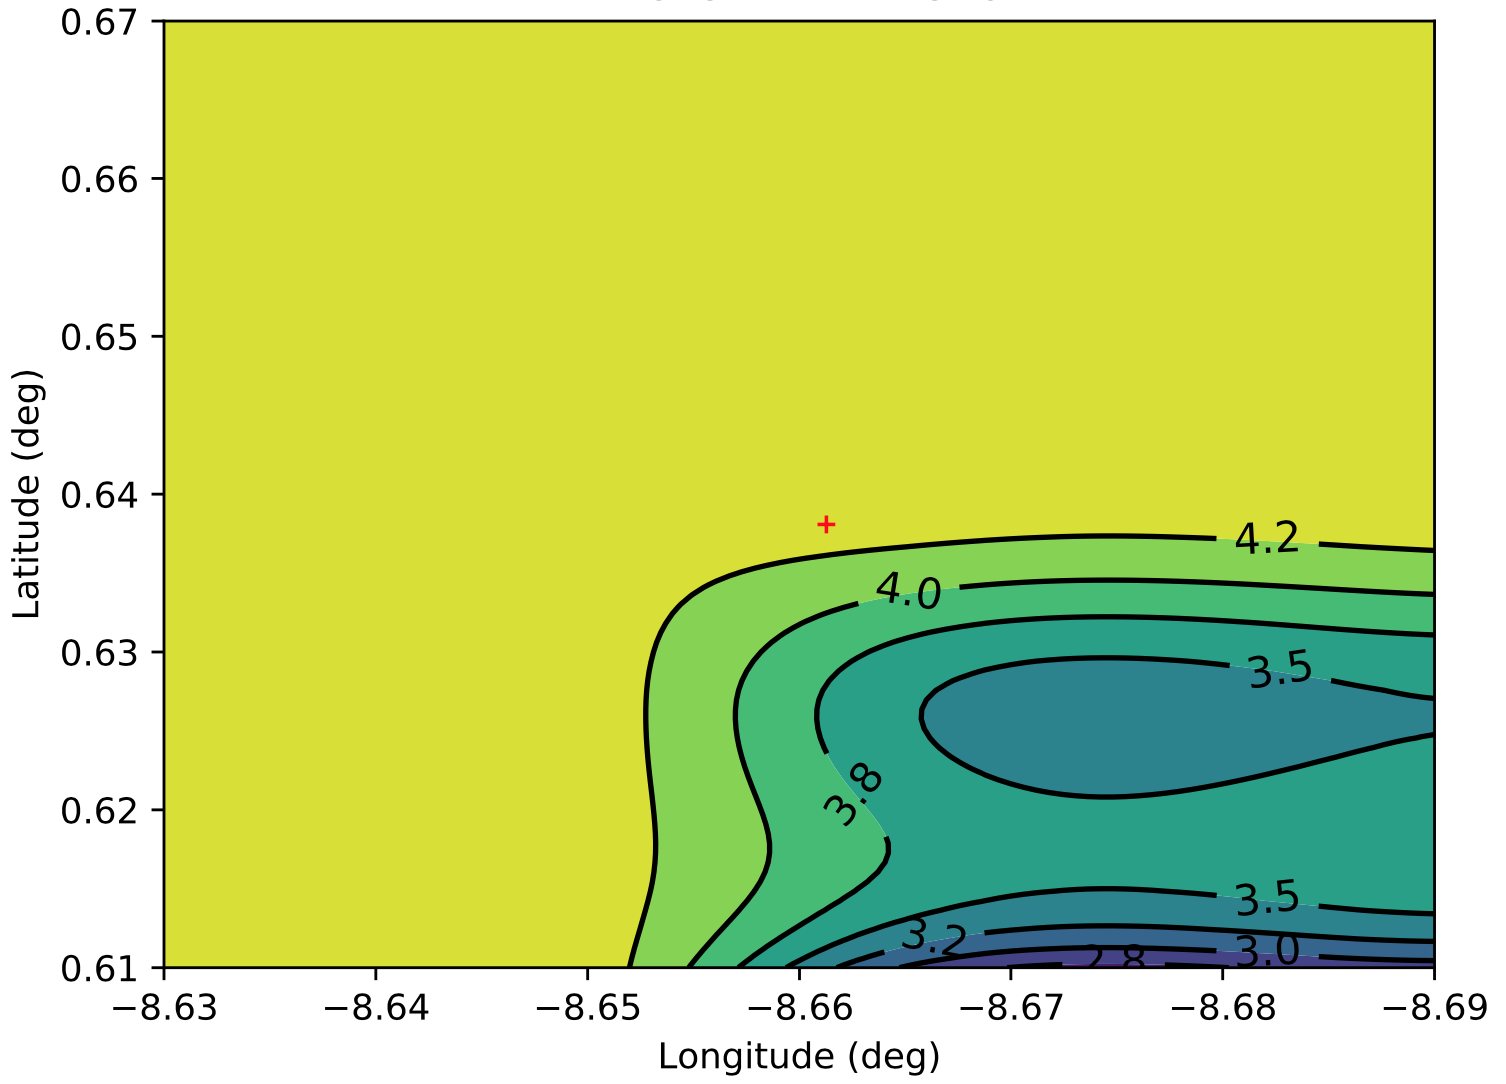
The first step consisted on using the CMD to single out the stars that are fainter than the bulge RC. We follow a procedure similar to that used in Sumi et al. (2013) for selecting the local RC. We limit the area around the events with circles of radius from to . In most of the cases the CMD remained the same but had fewer stars when we used smaller areas. In some cases, especially in the Galactic plane, the variation of the extinction changes on scales of . Therefore, to deal properly with special cases of strong differential reddening or the presence of strong dust lanes, we check all the VVV images. An example of strong dust lanes is shown in Figure 1. In these cases we used the contour maps obtained from an interpolation of the extinction maps presented in Gonzalez et al. (2012) (Figure 2) and computed the CMD of the stars located in areas with similar extinction values.
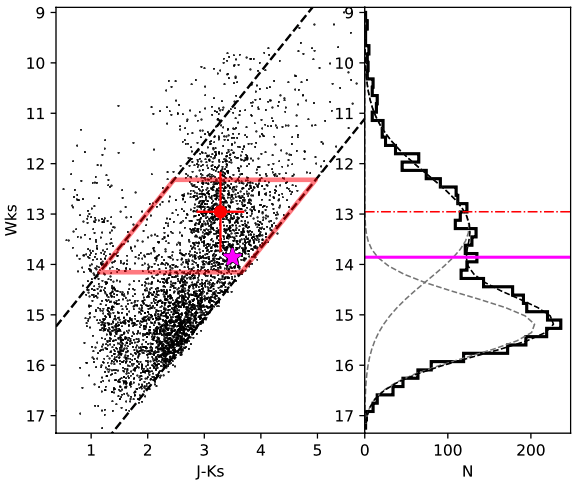
Then we select the area of interest where the RC stars are located. For this we limited the area of the CMD with a box centered in the RC region (Figure 3). The diagonal boundaries (black dashed lines of Figure 3) were computed using the distribution of stars along stripes of different widths along the red color edge, then we fitted a double gaussian and selected the best strip width as the distribution with the smallest and highest difference between the peaks, representing the main sequence and RC populations. This procedure gave us, in some cases, the slope of the local extinction ratio. Although we obtain different local extinction ratios for each CMD, the values varied from from to , for simplicity we computed the centroid using the the Wesenheit magnitude defined as
| (1) |
We obtained the histogram of the strip along with a double-Gaussian fit. The limits in magnitudes are defined as the area of fainter/brighter than the peak of the distribution ( boundaries of the box in Figure 3). Then we measured the centroid and dispersion of the local RC using the stars located in the area within the box.
The far-disk RC sources are expected to appear as outliers of the bulge RC. Therefore, if the far-disk population is detectable in the field we might identify a small overdensity of stars on the fainter and redder side of the RC. This overdensity should be detected as a bump in the magnitude distribution of stars. To highlight the double bump (RC and far-disk RC) we limit the analysis to the strip computed in the previous step that excluded the near disk population, limited by the black dashed lines of Figure 3. In the cases when the far-disk RC is detectable, we expect to find it mag fainter than the main bulge RC, depending on the Galactic longitude and within the 3 interval in magnitude (Gonzalez et al., 2018). The double bump is more evident when the CMD is corrected by extinction, therefore we used the magnitude distribution. In cases of highly extincted fields, we are not able to detect far-disk stars, so the bump was not detected.
Then, to detect the far-disk source candidates we used the prior for the centroid based on two criteria. First, we selected the CMDs with an evident presence of a far-disk population. If we expect to find a far-disk source in the small area we should detect other distant stars, and therefore the small bump. We do not consider the sources with nondetectable bumps in the CMD good far-disk candidates, although the source was located on the faint side of the RC. In fact, the double bump, and therefore the candidates, are detected in the most central tiles that have a higher number of observations () than the most external ones. Second, we search for sources fainter and redder than the local RC, i.e. the extinction-corrected magnitude () that lies within the bump of the far-disk RC and is redder than the bulge RC centroid color . Due to the double peak of these cases the magnitude of the bulge RC centroid was overestimated, therefore the last step consisted of recomputing the centroid of the local RC of the bulge and its dispersion, excluding the peak of the far-disk RC stars. Figure 3 shows an example of the limits selection, centroid computed, and far-disk candidate ID 70134 located in tile 337. A total of events were selected in this step.
We calculate the individual reddening values for the different fields on the RC centroid as using the RC centroids of each CMD assuming the mean intrinsic color of the bulge RC giant stars to be mag (Alves et al., 2002). Note that these individual reddenings cannot be assumed to be those listed in the reddening maps of Gonzalez et al. (2012), because their mean reddening values were computed for sources located at the distance of the bulge. As we are trying to determine which of the sources studied here are located on the far disk, we have to consider that their reddening values should be larger in principle, due to the presence of dust located beyond the bulge.
Armed with these individual reddening values, the second step is to estimate the far-disk RC star distances assuming that the extinction ratio on the far side of the disk is similar to the ratio for the dust between us and the bulge. We adopt the mean absolute magnitude of the Galactic bulge RC as from Alves et al. (2002). We also use the extinction ratios measured by Alonso-García et al. (2017): .
We propagated the errors in every step of the calculations. The uncertainty in reddening mag is obtained using the color error mag (Alves et al., 2002) and the mean error for the centroid color mag. Assuming that the uncertainty in extinction ratio from Alonso-García et al. (2018) is , we obtain mag. The absolute magnitude error is mag and using that the photometric errors are mag (Saito et al., 2012; Contreras Ramos et al., 2017; Alonso-García et al., 2018). Lastly, for the distance we obtain kpc.
In this step we limit the sample to the RC stars with kpc. Then the distance of each event was analyzed depending on its location, because as mentioned above, the barred bulge is angled with respect to the line of sight so the and mean distance to the bulge depend on the Galactic longitude. Therefore the distance cut for far-disk sources also depends on the longitude of the source.
As an aside, we have also estimated the reddening and distances using the new mean magnitudes and colors for the Galactic bulge RC giants from Gaia and 2MASS: , and (Riuz-Dern, 2018). This produces a slight shift with respect to the mean distances estimated using the respective mean RC values from Alves et al. (2002), but does not change our conclusions at all.
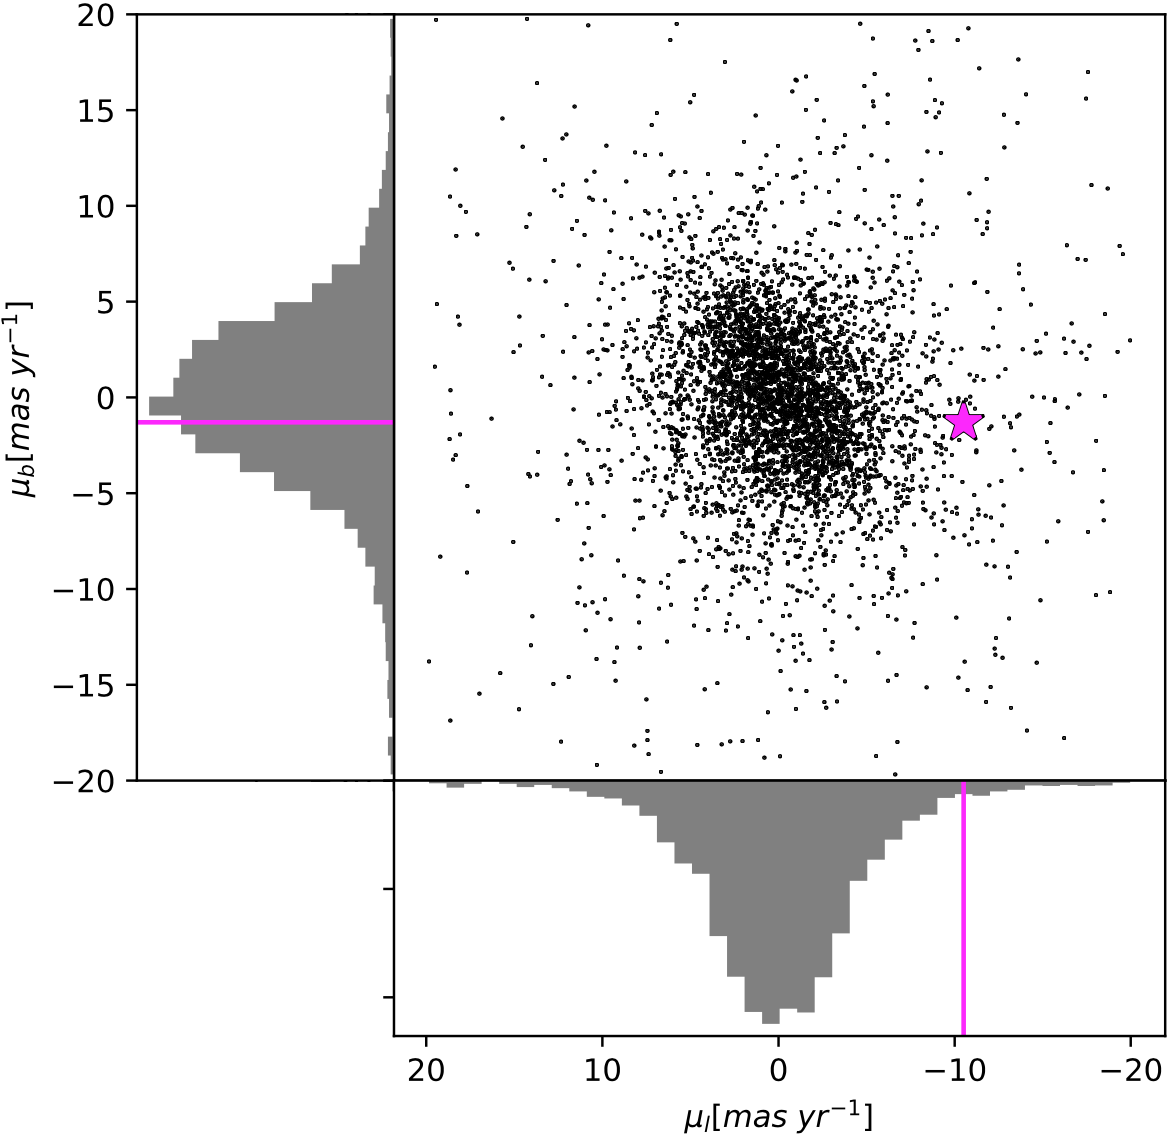
The third step is the proper motion analysis. The proper motions that we expect for far-disk sources candidates follow . Additionally, as the disk source motion is dominated by the rotation of the Galaxy, we expect a low velocity in the Galactic latitude direction, therefore we limit the sample to the events with (). We selected them in order to reject the very faint and red sources that can be present in the near disk and can contaminate our sample. To account for random motions of nearby or bulge stars that can also meet the requirements defined above, we computed the VPD for the nearby stars () and compared them with the proper motion of the source. In this step the sample was reduced to 28 events. Figure 4 shows one example of the local VPD around candidate ID 90309 located in tile 334.
For the catalog presented in Navarro et al. (2018, 2020b), when the source magnitude was not well constrained from the photometry, we used the baseline magnitude of the light curve (far from the peak). Additionally, when the mag was not well constrained, we used the red edge of each CMD to define the magnitude upper limit. The fourth step for the analysis for far-disk candidates consisted of rejecting those events to avoid false positives. Using the same argument, we exclude from the sample the cases in which the colors and magnitudes obtained from the fitting and from the photometry were different. Additionally, we excluded binaries and events showing parallax effect and the PSPL events that do not have well-constrained parameters or high values for the blending parameter (), which affects the source flux estimation and the distance estimation.
To be consistent with this procedure and to compute a more accurate frequency estimation we redo the RC selection of Navarro et al. (2018, 2020b) considering the differential extinction, i.e., computing the RC centroids for the local CMDs around the sources. RC stars were selected as the sources located at 3 within the Gaussian fit (around 1 mag away from the main magnitude), with blending parameters consistent with zero and well constrained parameters from the standard microlensing model. The final sample contains sources.
Finally, selecting the stars that meet all the requirements mentioned above for good candidates yields RC sources that could be located in the far disk. Compared with the new sample of RC stars ( events), the fraction of candidates for far-disk sources reaches of the sample ( sources).
The final list of the best candidate RC stars from the far disk is presented in Table LABEL:tab:table1 along with the Galactic coordinates, magnitudes, and microlensing parameters. Table LABEL:tab:table2 includes the proper motions, the centroid of the local field, the extinction ratio, and distances.
On the one hand, the strict and conservative selection criteria applied in this procedure to obtain the candidates could suggest that this number is a lower limit, but on the other hand there are alternative scenarios where the sources can also meet the requirements and act as false positives. However, the most important factors, such as anomalous extinction, blending, random motions, and the requirement of the detectable presence for the far-disk RC, were included in the analysis simultaneously. Therefore, we can conclude that for the final sample of candidates the most plausible explanation is that the source is located in the far disk and that this type of microlensing event configuration is in fact numerous at low Galactic latitudes. This is as expected, since the Galactic volume explored is much larger that the near disk area sampled in front of the bulge.
In order to estimate what timescales should be expected, we use Equation. 17 of Mao (2012):
| (2) | |||
where is the lens mass, is the relative transverse velocity, and and are the lens and source distances, respectively.
Then, for a typical far-disk source at kpc and a lens in the near disk at kpc, we have km s-1, and
| (3) |
On the other hand, for a typical far-disk source at kpc and a lens in the bulge at kpc, we have km s-1, and
| (4) |
However, for microlensing events with both the source and lens located in the far disk we expect longer timescales. For example, a far-disk source at kpc and a lens in the bulge at kpc, we have km s-1, and
| (5) |
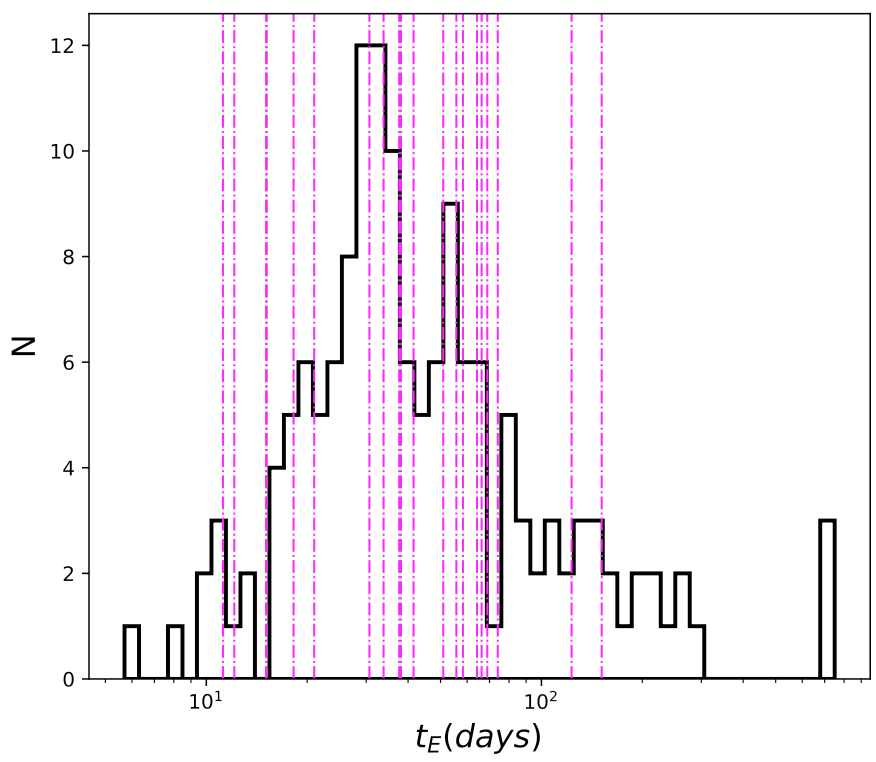
In this study, the final sample of far disk source candidates gives a mean timescale of days. The standard error is large due to the small statistics, but this value is higher than the mean and the peak of the Gaussian fit obtained for the RC sample used in this analysis ( days and respectively). Figure 5 shows the bulge RC timescale distribution ( stars) and the timescale of the far-disk candidate events shown as vertical lines. From Figure 5 is clear that, on average, far-disk candidates have longer timescales compared to the mean bulge RC distribution.
Gaussian fit for the
4. Existing models and detections
Microlensing optical depths for the Galactic bulge have been estimated from the optical surveys by assuming that most of the sources are located in the bulge (e.g. Popowski et al. (2005); Hamadache et al. (2006); Sumi et al. (2006)). Likewise, different theoretical predictions of microlensing optical depth for the Galactic bulge have been computed by Han & Gould (1995, 2003); Wood & Mao (2005); Ryu et al. (2008); Kerins et al. (2009); Penny et al. (2013, 2019); Henderson et al. (2014); Wegg et al. (2016); Henderson & Shvartzvald (2016) and Poleski (2016), among others, also assuming that the majority of the sources are located within the bulge. Understandably, the possible presence of sources in the far disk has not been considered so far because the optical surveys avoid the high extinction regions.
The event rates in the innermost Galactic fields are unknown because these regions have not been accessible to the optical surveys, which are confined to the less reddened regions. The predictions from the various models for the most extincted fields in the Galactic plane show significant dispersion (Penny et al., 2019). Therefore, near-IR observations are required, such as the UKIRT (Shvartzvald et al., 2017) and VVV surveys that can provide the first glance of this unexplored region of the Galaxy.
The microlensing models of Wegg et al. (2016) suggest that the inner Milky Way has a low dark matter content and a near maximal disk. The maximal disk hypothesis says that the luminous disk alone is responsible for the circular velocity in the inner region of the rotation curve of spiral galaxies like the Milky Way (Van Albada & Sancisi, 1986; Sackett, 1997). However, none of the existing microlensing models consider the possibility of events with sources beyond the bulge. The detection of events with sources in the far disk should be important to constrain the maximal disk models and to study the Galactic structure and dynamics. Now that the near-IR surveys can reach the plane of the Galaxy, and therefore the far disk, new models are needed to contrast with our observations. The future models need to consider the different types of events with sources in the far disk, namely far-disk – near-disk events, far-disk – bulge events, and far-disk –far-disk events. These models need to account for the different density distributions along the line of sight and also for the different kinematics.
In the past the most common assumption was to place the sources at the distance of the bulge (at kpc), and the lenses anywhere (in the foreground disk or in the bulge) along the line of sight. As a specific example, for the microlensing events located at deg., the stellar density along the line of sight peaks at the tip of the bar, at a distance of kpc. This is where the lenses are going to be preferentially located if we are interested in sources situated in the far disk. But for deg. the far disk sources are located at kpc, which is nearly twice the distance of the lenses, where the lensing is most favorable.
For example, Yee et al. (2015) and Calchi Novati et al. (2015) estimated the distances for 22 lenses in total toward the bulge, assuming that the all sources are located at kpc. The majority of them are located in the disk, with distances kpc, while only eight of them are located in the bulge, with kpc. In this specific case, are bulge-disk events, while are bulge-bulge events.
Particularly interesting are the microlensing events with high relative lens-source proper motions, because future high-resolution images can directly reveal the lens. The microlensing events with sources in the far disk are more likely to exhibit high relative PMs. Among these, the far-disk–near-disk events are preferred, because their relative PMs would be the highest, but also the far-disk–bulge events would have high PMs at positive Galactic longitudes. There is an interesting effect expected with the longitude dependence of the relative source-lens PMs that could be studied with better resolution and a greater coverage of the area in the longitude axis. The far-disk–bulge events would have high relative PMs at positive longitudes, while for the bulge–near-disk events the opposite is true: they would have high relative PMs at negative longitudes. Relative proper motions can be measured only in cases where the lens is detected and therefore should be reasonably bright compared to the source.
5. The Future with the Nancy Grace Roman Space Telescope
Even though the detection of microlensing events in the far disk counts as another achievement of the ground-based microlensing searches, the observations could also be improved, and in this regard a near-IR microlensing campaign from space with the Nancy Grace Roman Space Telescope, formerly known as the Wide-Field InfraRed Survey Telescope or WFIRST is noteworthy (Spergel et al., 2015; Penny et al., 2019). The US Decadal Survey recommended the Roman Space Telescope as the top space mission (Blandford et al., 2010).
The present findings suggest a strategy for a Roman microlensing campaign that could complement and augment current ground-based microlensing surveys. The total area of the Roman footprint is similar to the area covered by VIRCAM at VISTA, which has been able to map efficiently the whole MW bulge and southern disk. We suggest that a similar mapping pattern be applied across the Galactic plane, covering an area with deg. and repeatedly. The cadence should be frequent during the first season (three observations per day per field). Also, it is of utmost importance that the Roman coverage is extended to the band, as suggested by Stauffer (2018).
If we consider an RC star in the far disk of the Galaxy, at the “Galactic antipodes” with kpc and kpc from the Sun, a reasonable guess would be a total extinction of mag, mag. Such a star would have mag, and apparent magnitude mag. While this is just beyond the detection range for the VVV survey, which has a limiting magnitude mag typically, it would be readily accessible with the Roman owing to its higher resolution and sensitivity (Spergel et al., 2015; Penny et al., 2019). In fact, if the observations are done at , the Roman Telescope offers the possibility of mapping microlensing through the Galactic plane. If the Roman observations are limited to , the rest of the Galaxy will remain hidden and unexplored.
Microlensing observations at low Galactic latitudes are important also to find planets in the bulge. Henderson et al. (2014) and Henderson & Shvartzvald (2016) predicted the planet detection fraction as a function of distance considering sources in the bulge, but as an outcome most of the planets would be located in the near disk, with very few of them in the bulge. The ability of the near-IR surveys, such as VVV, to see the far-disk sources suggests that the Roman Telescope would efficiently allow discovery of numerous planetary lenses in the bulge.
Note that VIRCAM at the VISTA telescope will be decommissioned after 2020, well before the launch of the Roman Space Telescope, severely hampering the ground-based observational efforts to conduct a microlensing campaign in the near-IR.
In this respect, we have stressed the importance of extending the Roman filter coverage out to (at the band). Apparently, current plans do not consider any such near-IR filters (Green et al., 2012; Spergel et al., 2015; Penny et al., 2019). This limits the Roman Telescope’s vision into the Galactic plane, making it unable to reach microlensing events in the far disk. The gain with longer wavelengths is enormous; a difference of only one magnitude beyond the bulge provides vast real estate for microlensing in the far disk of our Galaxy.
Also, if we were to see events with sources in the far disk, their relative motions would be larger, and it may be easier in some cases to separate the lens from the source after only a few years. This would allow direct detection of the lens, and better measurement of its physical parameters (Alcock et al., 2001; Gould, 2004).
6. Conclusions
We have identified candidate microlensing events with sources in the far disk located in the Galactic plane. We studied in detail the PMs and CMD of the local areas around the RC sources events using the near-IR photometry from the VVV survey. Out of the total sample of RC events, we present a list of the best candidate far-disk events, with sources potentially located well beyond the bulge ( kpc). We estimated reddenings and distances for the far-disk RC microlensing event candidates.
This result suggests that as many as of RC sources may be located beyond the bulge, in the far disk of our Galaxy. Our major conclusion is that the events from the far disk could account for a good fraction of the total population of microlensing events in the Galactic plane (in the region , deg.).
The mean of the timescale distribution for the far-disk candidates is on average longer ( days) than the value obtained for the Gaussian fit of the bulge RC sources ( days). Larger samples such as those likely to be obtained with the Roman Space Telescope in the future would help to confirm this trend.
To accurately measure distances to confirm these candidates we need spectroscopy and higher-resolution observations that can be obtained with ground-based telescopes with adaptive optics and with the next generation of space telescopes.
We have argued that two major improvements are needed to unveil the structure of the inner MW with microlensing. First are the models, which need to consider the contribution of events from the far disk. Second are the observations, which could also be improved, the most promising of which are a near-IR campaign from space with the Nancy Grace Roman Space Telescope. We have stressed the importance of extending the Roman filter coverage out to the band at . Apparently current plans do not consider this filter, and which is very unfortunate because it would limit the telescope’s vision into the Galactic plane, making it unable to reach microlensing events in the far disk.
References
- Alcock et al. (2001) Alcock, C., Allsman, R. A., Alves, D. R., et al. 2001, Natur, 414, 617
- Alcock et al. (1997) Alcock, C., Allsman, R. A., Axelrod, T. S., et al. 1997, ApJ, 474, 217
- Alonso-García et al. (2017) Alonso-García, J., Minniti, D., Catelan, M., et al. 2017, ApJL, 849, L13
- Alonso-García et al. (2018) Alonso-García, J., Saito, R. K., Hempel, M. et al., 2018, A&A, 619, A4
- Alves et al. (2002) Alves, D. R., Rejkuba, M., Minniti, D. & Cook, K. H. 2002,ApJL, 573, L51
- Awiphan et al. (2016) Awiphan, S., Kerins, E. & Robin, A. 2016, MNRAS, 456, 1666
- Bennett et al. (2018) Bennett, D., Akeson, R., Anderson, J., et al. 2018, arXiv:180308564
- Bennett et al. (2018) Bennett, D., Udalski, A., Bond, I., et al. 2018, AJ, 156, 113
- Blandford et al. (2010) Blandford, R. D., Haynes, M. P., Huchra, J. P., et al., 2010, New Worlds, New Horizons in Astronomy and Astrophysics. National Academies Press, Washington D.C
- Calchi Novati et al. (2015) Calchi Novati, S., Gould, A., Udalski, A., et al. 2015, ApJ, 804, 20
- Contreras Ramos et al. (2017) Contreras Ramos, R., Zoccali, M., Rojas, F., et al. 2017, A&A, 608, 140
- Cseresnjes & Alard (2001) Cseresnjes, P. & Alard, C. 2001, A&A, 369, 778
- Dékány et al. (2013) Dékány, I., Minniti, D., Catelan, M., et al. 2013, ApJL, 776, L19
- Gonzalez et al. (2012) Gonzalez, O. A., Rejkuba, M., Zoccali, M., et al. 2012, A&A, 543, 13
- Gonzalez et al. (2018) Gonzalez, O. A., Minniti, D., Valenti, E., et al. 2018, MNRAS, 481, 130
- Gould (1995) Gould, A. 1995, ApJ, 447, 991
- Gould (2004) Gould, A. 2004 ApJ, 606, 319
- Green et al. (2012) Green, J., Schechter, P., Baltay, C., et al. 2012, arXiv:1208.4012
- Hamadache et al. (2006) Hamadache, C., Le Guillou, L., Tisserand, P., et al. 2006, A&A, 454, 185
- Han & Gould (1995) Han, C., & Gould, A. 1995, ApJ, 447, 53
- Han & Gould (2003) Han, C., & Gould, A. 2003, ApJ, 592, 172
- Henderson et al. (2014) Henderson, C. B., Gaudi, S. B., Han, C., et al. 2014, ApJ, 794, 52
- Henderson & Shvartzvald (2016) Henderson, C. B., & Shvartzvald, Y. 2016, AJ, 152, 96
- Kerins et al. (2009) Kerins E., Robin A. C., & Marshall D. J. 2009, MNRAS, 396, 1202
- Mao (2012) Mao, S. 2012, Research in Astronomy and Astrophysics, 12, 947
- Navarro et al. (2017) Navarro, M. G., Minniti, D. & Contreras Ramos, R. 2017, ApJL , 851, L13
- Navarro et al. (2018) Navarro, M. G., Minniti, D. & Contreras Ramos, R. 2018, ApJL , 865, L5
- Navarro et al. (2019) Navarro, M. G., Minniti, D. & Contreras Ramos, R. 2018, Volume 14, Symposium S353 (Galactic Dynamics in the Era of Large Surveys) June 2019 , pp. 35-37
- Navarro et al. (2020a) Navarro, M. G., Minniti, D., Pullen, J. & Contreras Ramos, R. 2020, ApJ, 889, 1
- Navarro et al. (2020b) Navarro, M. G., Contreras Ramos, R., Minniti, D., et al., 2020, ApJ, 893, 1
- Paczyński & Stanek (1998) Paczyński, B., & Stanek, K. 1998, ApJL, 494, L219
- Penny et al. (2013) Penny, M. T., Kerins, E., Rattenbury, N., et al. 2013, MNRAS, 434, 2
- Penny et al. (2017) Penny, M. T., Rattenbury, N. J., Gaudi, B. S., & Kerins, E. 2017, AJ, 153, 161
- Penny et al. (2019) Penny, M. T., Gaudi, S. B., Kerins, E., et al. 2019, ApJS, 241, S3
- Poleski (2016) Poleski R. 2016, MNRAS, 455, 3656
- Popowski et al. (2005) Popowski, P., Griest, K., Thomas, C.L., et al. 2005, ApJ, 631, 879
- Ryu et al. (2008) Ryu, Y. H., Chang, H. Y., Park, M. G., & Lee, K. W. 2008, ApJ, 689, 107
- Riuz-Dern (2018) L. Ruiz-Dern, C. Babusiaux, F. Arenou, C. Turon, R. Lallement, 2018, A&A, 609, A116
- Sackett (1997) Sackett P. D. 1997, ApJ, 483, 103
- Saito et al. (2012) Saito, R. K., Hempel, M., Minniti, D., et al. 2012, A&A, 537, A107
- Shvartzvald et al. (2017) Shvartzvald, Y., Bryden, G., Gould, A., et al., 2017, AJ, 153, 61
- Shvartzvald et al. (2018) Shvartzvald, Y., Novati, S. C., Gaudi, B. S., et al. 2018, ApJL, 857, L8
- Smith et al. (2017) Smith, L. C., Lucas, P. W., Kurtev, et al. 2018, MNRAS, 474, 1826
- Spergel et al. (2015) Spergel, D., Gehrels, N., Baltay, C., et al. 2015, arXiv:1503.03757
- Stauffer (2018) Stauffer, J., Helou, G., Benjamin, R., et al. 2018, arXiv:1806.00554
- Sumi et al. (2006) Sumi, T., Wozniak, P. R., Udalski, A., et al. 2006, ApJ, 636, 240
- Sumi et al. (2013) Sumi, T., Bennett, D. P., Bond, I. A., et al. 2013 ApJ, 778, 150
- Van Albada & Sancisi (1986) Van Albada, T. S., & Sancisi, R. 1986, RSPTA, 320, 447
- Wegg et al. (2016) Wegg, C., Gerhard, O., & Portail, M., 2016, MNRAS, 463, 557
- Wood & Mao (2005) Wood, A. & Mao, S. 2005, MNRAS, 362, 945
- Yee et al. (2015) Yee, J. C., Udalski, A., Calchi Novati, S., et al. 2015, ApJ, 802, 76
| VVV Survey Far-disk Source Candidates with Their Respective Positions in Galactic Coordinates, and Magnitudes and the Parameters Obtained Using the Standard Microlensing Model Along with One Standard Deviation Errors. Typical Positional and Photometric Errors are Provided in the Footnotes. | ||||||||||
| 329 | 60206 | -5.97291 | -0.37904 | 17.51 | 15.15 | 0.71 | 0.10 2 | 56995.54 4.34 | 151.28 49.61 | 0.73 0.53 |
| 329 | 82871 | -5.63381 | -0.42497 | 17.36 | 14.91 | 0.90 | 0.22 0.07 | 56189.45 0.70 | 66.31 13.21 | 0.36 0.13 |
| 331 | 36016 | -3.38748 | 0.21624 | 19.06 | 15.45 | 0.37 | 0.94 1.58 | 56121.33 1.71 | 37.63 42.34 | 1.00 3.40 |
| 331 | 8016 | -3.24922 | 0.63764 | 19.02 | 15.33 | 0.62 | 0.63 0.93 | 55784.41 1.20 | 30.68 29.07 | 1.00 2.43 |
| 331 | 85713 | -2.90247 | -0.25143 | 17.75 | 14.85 | 1.86 | 0.15 0.02 | 56172.82 0.12 | 55.75 4.17 | 0.87 0.10 |
| 331 | 13231 | -3.20217 | -0.10832 | 19.08 | 15.47 | 1.09 | 0.20 0.20 | 56067.94 9.06 | 38.11 16.64 | 1.00 1.26 |
| 332 | 32398 | -2.21056 | 0.22402 | 19.74 | 15.43 | 1.65 | 0.22 0.12 | 56181.73 0.43 | 20.99 7.52 | 1.00 0.68 |
| 332 | 5694 | -1.96859 | -0.27779 | 18.99 | 15.29 | 0.58 | 0.50 2.61 | 55783.43 1.18 | 11.21 25.77 | 1.00 6.59 |
| 332 | 61443 | -1.94419 | 0.16977 | 18.81 | 15.12 | 0.81 | 0.10 2 | 56046.33 1.02 | 64.23 10.07 | 1.00 0.29 |
| 332 | 90379 | -2.09455 | 0.48129 | 18.16 | 14.94 | 0.82 | 0.17 0.12 | 55845.35 1.24 | 68.94 36.21 | 0.23 0.19 |
| 332 | 90196 | -1.66800 | -0.07156 | 19.82 | 15.24 | 1.02 | 0.33 0.20 | 56062.40 2.72 | 74.09 24.23 | 1.00 0.73 |
| 333 | 25228 | 0.05906 | 0.42445 | 19.02 | 15.24 | 1.76 | 0.10 2 | 56525.66 0.93 | 123.01 63.35 | 0.26 0.19 |
| 334 | 64986 | 1.59297 | -0.38994 | 17.73 | 14.68 | 0.95 | 0.31 0.29 | 56516.12 0.78 | 15.15 6.48 | 0.87 0.92 |
| 334 | 38331 | 1.44176 | 0.20855 | 19.51 | 15.06 | 0.78 | 0.19 0.32 | 57179.09 55.14 | 15.08 66.67 | 0.54 8.74 |
| 334 | 90309 | 1.41782 | -0.26522 | 19.72 | 15.10 | 1.02 | 0.21 0.48 | 56190.74 0.52 | 12.12 11.26 | 1.00 1.81 |
| 335 | 57964 | 1.99196 | -0.01792 | 19.57 | 15.17 | 0.57 | 0.27 0.23 | 56177.54 1.31 | 50.94 28.54 | 0.26 0.27 |
| 335 | 73192 | 1.84083 | 0.31767 | 19.38 | 15.56 | 1.79 | 0.12 0.04 | 56851.31 0.39 | 41.55 9.71 | 0.58 0.21 |
| 335 | 83301-1647 | 2.98817 | 0.46673 | 18.42 | 15.18 | 1.46 | 0.31 0.11 | 56840.20 0.34 | 33.81 9.08 | 1.00 0.48 |
| 336 | 44838 | 4.19156 | 0.57005 | 17.59 | 14.98 | 2.64 | 0.10 2 | 55824.89 0.28 | 58.33 9.82 | 1.00 0.24 |
| 337 | 70134 | 5.77744 | -0.24651 | 18.88 | 15.36 | 1.34 | 0.20 0.08 | 56153.15 0.27 | 18.21 5.36 | 0.62 0.30 |
Typical positional errors are 0”.1 (Smith et al., 2017).
††footnotemark: †Typical photometric errors are mag, and mag (Saito et al., 2012; Contreras Ramos et al., 2017; Alonso-García et al., 2018).
| VVV Survey Far-disk Source Candidates with Their Proper Motions, Centroid Values, Extinction, and Distances. Typical Color Errors and Uncertainty in Distances are Provided in the Footnotes. | |||||||
| 329 | 60206 | -3.15 1.17 | 2.12 1.37 | 2.32 0.17 | 13.46 0.74 | 1.72 | 16.6 |
| 329 | 82871 | -1.85 1.73 | 3.94 1.89 | 2.60 0.26 | 13.31 0.60 | 2.00 | 14.1 |
| 331 | 36016 | -0.19 1.25 | 4.13 1.70 | 3.70 0.29 | 13.17 0.66 | 3.10 | 14.4 |
| 331 | 8016 | -2.78 1.50 | -2.95 1.77 | 2.70 0.25 | 13.01 0.69 | 2.10 | 16.7 |
| 331 | 85713 | -1.39 1.16 | -1.50 1.34 | 2.96 0.22 | 13.22 0.69 | 2.36 | 12.7 |
| 331 | 13231 | -2.84 1.64 | -0.42 1.86 | 3.59 0.24 | 13.20 0.69 | 2.99 | 15.0 |
| 332 | 32398 | -2.35 1.54 | 3.31 1.83 | 3.64 0.43 | 13.06 0.74 | 3.04 | 14.5 |
| 332 | 5694 | -3.95 2.17 | -3.62 1.89 | 3.92 0.29 | 12.96 0.60 | 3.32 | 12.9 |
| 332 | 61443 | -3.77 1.59 | 0.59 1.63 | 3.44 0.30 | 13.12 0.82 | 2.84 | 13.1 |
| 332 | 90379 | -1.73 1.20 | 0.12 1.17 | 2.88 0.30 | 13.02 0.67 | 2.28 | 13.4 |
| 332 | 90196 | -0.46 3.03 | -3.86 2.16 | 3.78 0.41 | 12.90 0.60 | 3.18 | 12.9 |
| 333 | 25228 | -0.72 2.71 | 1.14 2.06 | 3.59 0.36 | 12.87 0.53 | 2.99 | 13.4 |
| 334 | 64986 | -4.39 0.78 | 0.29 0.85 | 3.03 0.28 | 12.90 0.65 | 2.43 | 11.6 |
| 334 | 38331 | -1.07 1.48 | -3.34 1.01 | 3.98 0.45 | 12.78 0.46 | 3.38 | 11.5 |
| 334 | 90309 | -10.51 3.47 | -1.30 3.12 | 3.69 0.50 | 12.78 0.53 | 3.09 | 12.3 |
| 335 | 57964 | -0.60 1.66 | 2.95 1.95 | 3.96 0.40 | 12.74 0.41 | 3.36 | 12.1 |
| 335 | 73192 | -3.07 2.22 | 3.10 1.89 | 3.62 0.33 | 12.98 0.61 | 3.02 | 15.4 |
| 335 | 83301-1647 | -1.21 1.48 | -3.69 2.02 | 2.96 0.82 | 12.95 0.63 | 2.36 | 14.8 |
| 336 | 44838 | -3.66 1.24 | -0.59 1.06 | 2.42 0.27 | 13.15 1.17 | 1.82 | 15.0 |
| 337 | 70134 | -0.31 1.67 | -0.58 1.47 | 3.29 0.42 | 12.95 0.79 | 2.69 | 15.1 |
Typical color errors are mag (Alves et al., 2002)
§§footnotemark: §According to the error propagation the uncertainty in distance is kpc.