SDSS-IV MaNGA: The Nature of an Off-galaxy H Blob – A Multi-wavelength View of Offset Cooling in a Merging Galaxy Group
Abstract
Galaxies in dense environments, such as groups and clusters, experience various processes by which galaxies gain and lose gas. Using data from the SDSS-IV MaNGA survey, we previously reported the discovery of a giant (6 – 8 kpc in diameter) H blob, Totoro, about 8 kpc away from a pair of galaxies (Satsuki and Mei) residing in a galaxy group which is experiencing a group-group merger. Here, we combine interferometric 12CO(1–0) molecular gas data, new wide-field H, -band data, and published X-ray data to determine the origin of the blob. Several scenarios are discussed to account for its multi-wavelength properties, including (1) H gas being stripped from galaxy Satsuki by ram-pressure; (2) a separated low-surface-brightness galaxy; (3) gas being ejected or ionized by an active galactic nucleus (AGN); and (4) a cooling intra-group medium (IGM). Scenarios (1) and (2) are less favored by the present data. Scenario (3) is also less likely as there is no evidence for an active ongoing AGN in the host galaxy. We find that the CO (cold) and H (warm) gas coexist with X-ray (hot) structures; moreover, the derived cooling time is within the regime where molecular and H gas are expected. The coexistence of gas with different temperatures also agrees with that of cooling gas in other systems. Our multi-wavelength results strongly suggest that the CO and H gas are the product of cooling from the IGM at its current location, i.e., cooling has occurred, and may be ongoing, well outside the host-galaxy core.
1 Introduction
The optical colors of galaxies are characterized by a bimodality, with early-type galaxies residing on the red sequence and late-type galaxies populating the blue cloud (e.g., Strateva et al., 2001; Balogh et al., 2004; Brammer et al., 2009). The transition from blue to red galaxies is known to be driven by a decrease in star formation (e.g., Whitaker et al., 2012; Taylor et al., 2015). Since galaxies require gas to fuel star formation (e.g., Saintonge et al., 2017), a knowledge of the gain and loss of gas provides a huge leap in the understanding of galaxy evolution.
Many galaxies reside in gravitationally bound groups or clusters, where a high volume density of galaxies is found. A natural consequence of clustering of galaxies is frequent interactions between galaxies and the environment in which they live (e.g., Fernández-Trincado et al., 2014). Such interactions can stimulate the gain and loss and heating and cooling of gas in various ways and control the star formation processes in galaxies. For example, interaction between galaxies can potentially trigger nuclear activity and nuclear starbursts that generate energetic gas outflow/winds to the environments (e.g., Larson, & Tinsley, 1978; Silk, & Rees, 1998; Springel et al., 2005; Ellison et al., 2008; Hopkins et al., 2008; Fernández-Trincado et al., 2014). Besides, when a galaxy moves at a high speed through a high density region, a complex hydrodynamical interaction of its interstellar medium (ISM) and the surrounding hot intracluster/intergalactic medium takes place. A large fraction of gas could be removed from a galaxy if the ram-pressure is strong enough to overcome the gravitational force (Gunn, & Gott, 1972). These gas removal processes can lead to the interruption of star formation activity.
On the other hand, fresh supplies of gas can sustain star formation in galaxies. Galaxies can gain gas through accretion of small companions (Bond et al., 1991; Lacey & Cole, 1993). Moreover, cold gas can form from the cooling of the hot intracluster medium (ICM) or intragroup medium (IGM) and be accreted to galaxies (Egami et al., 2006; O’Dea et al., 2008). Such process can rejuvenate early-type and S0 galaxies by supplying gas into their centers.
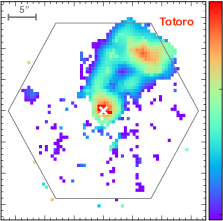
In our previous paper, Lin et al. (2017, hereafter Paper I), we report the discovery of a giant ionized gaseous (H) blob associated with a dry merger system (i.e., mergers between two early-type galaxies; Figure 1 and 1) residing in a galaxy group (Figure 1). The ionized gaseous blob is offset from both of the galactic nuclei. The gaseous blob might be a result of galaxy interactions, active galactic nucleus (AGN) activity, or a galaxy interacting with or being accreted by the dry merger. In any of these cases, we may be witnessing an ongoing gain and/or loss of gas in these galaxies.
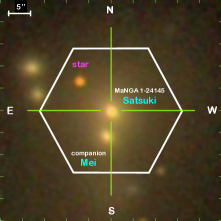
The H blob was identified from the first-year MaNGA survey (Mapping Nearby Galaxies at APO; Bundy et al., 2015), part of SDSS-IV (Blanton et al., 2017). The H blob (nicknamed “Totoro”) is 3 – 4 kpc in radius and is 8 kpc away (in projection) from the host galaxy MaNGA target 1-24145 (or MCG+10-24-117; nicknamed “Satsuki”; 17h15h23.26s, +57∘2558.36, stellar mass 1011 M☉). There is no distinct optical continuum counterpart at the position of Totoro. The mass of the ionized gas is 8.2 104 M☉ (Paper I). The SDSS image indicates that the host galaxy Satsuki has a companion galaxy (nicknamed “Mei”) located to the south east of Satsuki (Figure 1). The companion is also within the hexagon bundle field of view (FoV; 32.5 in diameter) of MaNGA. These two galaxies are at similar redshifts ( 0.03), with their line of sight velocity differing by 200 km s-1. Both galaxies are elliptical and thus form a dry (gas-poor) merger, also known as VII Zw 700.
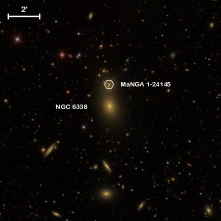
On the large scale, the dry merger (Satsuki and Mei) is located at the overlap region of a group-group merger (O’Sullivan et al., 2019). Satsuki and Mei are associated with the less massive northern component, while the nearby large elliptical galaxy NGC 6338 is the brightest galaxy of the more massive group (Figure 1). The dry merger (Satsuki and Mei) and NGC 6338 are separated by 42 kpc in projection and by 1400 km s-1 in velocity. The two merging groups are expected to form a galaxy cluster in the future. The merger velocity of the two groups is as large as 1700 – 1800 km s-1, making this one of the most violent mergers yet observed between galaxy groups (O’Sullivan et al., 2019).
Our H blob Totoro has also been observed by O’Sullivan et al. (2019) using the APO 3.5-m telescope (see their Figure 10), but only the high-luminosity, main blob region was detected. O’Sullivan et al. (2019) also show that the H gas of NGC 6338 consists of three diffuse filaments in the southeast and northwest quadrants, extending out to 9 kpc from the nucleus. The H filaments have also been revealed in previous observations by and the CALIFA111Calar Alto Legacy Integral Field Area Survey (Sánchez et al., 2012). survey (Martel et al., 2004; Pandge et al., 2012; Gomes et al., 2016). Moreover, O’Sullivan et al. (2019) show that both NGC 6338 and VII Zw 700 contain potential X-ray cavities, which would indicate past AGN jet activity. In addition, both systems are observed to contain cool IGM structures correlated with the H emission (see also Pandge et al., 2012).
We diagnosed the physical properties of Satsuki and Tororo using MaNGA data in Paper I:
-
•
kinematics: the ionized (H) gas component reveals that there is a moderate velocity variation ( 100 km s-1) from the position of Satsuki along the connecting arms to Totoro, but there is no velocity gradient across Totoro itself and the velocity and velocity dispersion across the blob are low ( 100 km s-1; Figure 7 of Paper I).
-
•
excitation state: the Baldwin-Phillips-Terlevich (BPT) emission line diagnostics (Baldwin et al., 1981) indicate LI(N)ER-type excitations for Satsuki and a composite (LI(N)ER-HII mix222Shocks can also lead to line ratios occupying the composite regions. However, the analysis of shock and photoionization mixing models of Paper I shows that the shocks are unlikely to be the dominant mechanism that is responsible for ionization of Totoro.) for Totoro.
-
•
gas metallicity: metallicity333Most of the metallicity calibrators can only be applied for those regions in which ionization is dominated by star formation, and may not be applicable to regions with ionization parameters or ISM pressure different from typical HII regions. In Paper I, we adopted the “N2S2H” calibrator, which is suggested to be less sensitive to the ionization parameters (Dopita et al., 2016). However, caution is still needed when interpreting the derived metallicity. of the gas around Satsuki is close to the solar value; on the other hand, the metallicity of Totoro is higher than that of Satsuki by 0.3 dex.
Several possibilities for Totoro were raised in Paper I, including (1) the gas being ram-pressure stripped from Satsuki, (2) a galaxy interacting with the dry merger (Satsuki and Mei), and (3) gas being ejected or ionized by an AGN associated with Satsuki. However, the data in Paper I are not sufficient to provide strong constraints on the nature of Totoro.
In this paper, we present new observations of this system and determine the most plausible origin of Totoro. Our new observations include:
-
(i)
wide-field H image: to reveal the distribution of ionized gas at larger scale (i.e., beyond the FoV of the MaNGA bundle),
-
(ii)
-band observation: to constrain the ionizing source, i.e., star formation or not, and to search for the possible continuum counterpart of the H blob, and
-
(iii)
molecular gas in 12CO(1–0): to constrain the amount and distribution of cold, i.e., potentially star-forming, gas.
Moreover, in addition to the scenarios raised in Paper I, O’Sullivan et al. (2019) argue for the “cooling gas” hypothesis in Satsuki, therefore, we also use
-
(iv)
X-ray data from O’Sullivan et al. (2019) to constrain the properties of the surrounding hot medium.
The paper is organized as follows. Section 2 describes the observations and our data reduction. The results are presented and discussed in Section 3. In Section 4 we summarize our results and list our conclusions.
Throughout this study, we assume a cosmology with 0.3, 0.7, and 70 km s-1 Mpc-1. We use a Salpeter stellar initial mass function.
2 Data
2.1 MaNGA
MaNGA, the largest integral field spectroscopy (IFS) survey of the nearby Universe to date, observed 10,000 galaxies with a median redshift () of 0.03. The details of the MaNGA survey, the integral-field-unit (IFU) fiber system, the sample selection, observing strategy, and the data reduction and analysis pipelines are explained in Drory et al. (2015), Wake et al. (2017), Law et al. (2015), Law et al. (2016), and Westfall et al. (2019), respectively, and also summarized in Paper I.
The MaNGA data used in this work were reduced using the MPL-7 version (corresponding to SDSS data release 15, Aguado et al., 2019) of the MaNGA data reduction pipeline. An earlier version of the pipeline (MPL-4) was used for Paper I. The differences between the pipeline products of MPL-4 and MPL-7 are negligible for the current work. The spectral-line fitting is carried out using the Pipe3D pipeline (Sánchez et al., 2016a, b). Details of the fitting procedures are described in Sánchez et al. (2016a, b) and summarized in Paper I. The method described in Vogt et al. (2013) is used to compute the reddening using the Balmer decrement at each spaxel.
2.2 Wide-field H data
Deep optical images were taken at the prime focus of the 6-m telescope of the Special Astrophysical Observatory of the Russian Academy of Sciences (SAO RAS) with the SCORPIO-2 multimode focal reducers (Afanasiev, & Moiseev, 2011). A narrow-band filter AC6775 (the central wavelength CWL 6769Å, the bandwidth FWHM 15Å) covers the spectral region around the redshifted H emission line. Two middle-band filters FN655 (CWL 6559Å, FWHM 97Å) and FN712 (CWL 7137Å, FWHM 209Å) were used to obtain the blue and red continuum images. We combined the data taken during two nights 05/06 and 06/07 Mar 2017 with seeing of 1.3 – 1.5. The total exposure time depended on filter FWHM: 7800, 1300, and 780 sec in the filters AC6775, FN655 and FN712, respectively. The detector, CCD E2V 42-90 (2K 4.5K), operated in the bin 2 2 read-out mode provides 0.35/px scale in the 6.1 field of view.
The data reduction was performed in a standard way for SCORPIO-2 direct image processing with IDL-based software (see, for instance, Sitnik et al., 2015). The underlying stellar continuum from the H image was subtracted using the linear combination of the images in the filters FN655 and FN712. The astrometry grid was created using the Astrometry.net project web-interface444http://nova.astrometry.net/ (Lang et al., 2010).
We emphasize that the purpose of the wide-field observation is to reveal the distribution of H gas outside of the MaNGA FoV, in particular, to look for a potential tidal tail(s) on the other side of Totoro. To be in line with the measurements and discussions in Paper I, the MaNGA H map will be used by default throughout this paper, and the wide-field H map will be used only where specifically mentioned in the text. The flux of the new narrow-band image has been calibrated by the MaNGA spectral line data to avoid systematic errors related with narrow-band filter calibration (e.g., only one standard star per night, mismatch between the redshifted lines and a peak of the filter transmission curve, etc.). This forces the flux of the narrow-band image to be consistent with that of MaNGA spectral line data.
2.3 -band Data
The -band observation was taken with the wide-field imaging facility MegaCam with a 1∘ field of view at the Canada–France–Hawaii Telescope (CFHT) from April 27th to June 24th in 2017 (PI: L. Lin; project ID: 17AT008). The total exposure time is 12,000 seconds. The MegaCam data were processed and stacked via MegaPipe (Gwyn, 2008). The final image has a limiting mag of 26.3 mag (1 aperture in radius).
2.4 Molecular Gas (CO) Data
We mapped the 12CO( 1 0; 115.2712 GHz) emission with the NOrthern Extended Millimeter Array (NOEMA) at Plateau de Bure (PI: L. Lin; project ID: S16BE001). The full width at half power of the primary beam of each NOEMA antenna at the 12CO(1-0) frequency is 50, sufficiently large to cover Satsuki, Mei, and Totoro. The observations were spread across 11 nights from May 25th to July 18th of 2015 with 5 or 7 antennas in D configuration. The total on-science-source time is 22 hours. The shortest possible baseline length is 24m, and therefore sources larger than about 15 might be resolved out. Nonetheless, in Section 3, we will see that the distribution of molecular gas matches the H extremely well.
Data reduction, calibration, and imaging were performed with the CLIC and MAPPING software of GILDAS555http://www.iram.fr/IRAMFR/GILDAS using standard procedures. Images were reconstructed using natural weighting to preserve maximal sensitivity. The resultant synthesized beam is 3.4 2.3 (PA 73.3∘), with an effective beamsize of 2.8. The aim of the observation is to constrain the amount of molecular gas traced by 12CO(1-0), therefore a relatively low spectral resolution (53.6 km s-1) was proposed to maximize the detection probability. The rms noise in the 12CO(1-0) cube is 0.31 mJy beam-1 per 53.6 km s-1.
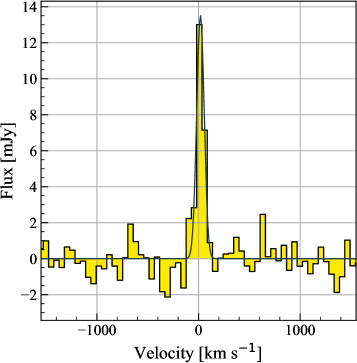
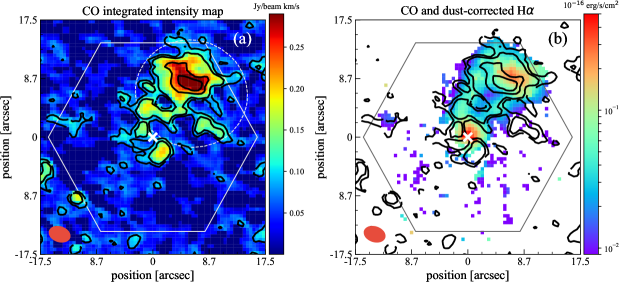
Figure 2 shows the 12CO(1-0) spectrum integrated over Totoro and the connecting arms, outlined by a dashed ellipse with an area of 210 arcsec2 on the integrated intensity map in Figure 3a. The 12CO(1-0) emission is strongly detected in two channels with velocities of 0 – 100 km s-1 and marginally detected in the adjacent channels. A single Gaussian fit to the line profile is overplotted in Figure 2. The full width half maximum (FWHM) of the line is 86.57.4 km s-1 and the line velocity relative to the galaxy velocity is 18.63.3 km s-1. The 12CO(1-0) (hereafter, CO) line properties are summarized in Table 1.
| velocity | line flux | line luminosity | line wdith | peak flux |
| (km s-1) | (Jy) | (K km s-1 pc2) | (km s-1) | (mJy) |
| 18.63.3 | 1.010.05 | (4.830.23)107 | 86.57.4 | 13.00 0.74 |
3 Results and Discussion
In this section, we will present and discuss our results following the scenarios mentioned in the Introduction, namely, Section 3.1: the gas being ram-pressure stripped from Satsuki; Section 3.2: an extremely low surface brightness galaxy or ultra-diffuse galaxy; Section 3.3: gas being ejected or ionized by an AGN. In addition, Paper I did not discuss the scenario of cooling of the IGM, which we discuss in Section 3.4. We will present the analysis and results of data at a specific wavelength described in Section 2 when it is needed to test a specific scenario.
3.1 Ram-Pressure Stripping
Galaxies in dense environments experience ram-pressure (Gunn, & Gott, 1972). As pointed out in Paper I, ram-pressure stripping is not expected to produce a centrally-concentrated blob, but is more likely to form clumpy structures embedded in a jellyfish-like tail (e.g., Boselli et al., 2016; Poggianti et al., 2017; Bellhouse et al., 2019; Jáchym et al., 2019).
The centrally peaked structure we observe in Totoro in H is also seen in molecular gas. The integrated intensity map of CO is shown in Figure 3a and the comparison with H is displayed in Figure 3b The morphology of molecular gas generally agrees well with H emission. The CO emission of Totoro is also dominated by a large, centrally-concentrated structure associated with Totoro, but the peak position of CO is offset toward the south of H peak by 0.3 ( 200 pc). The multi-wavelength peak coordinates of Totoro, along with other properties that will be derived and discussed in this paper are provided in Table 2. The two arm-like structures connecting the extended structure and the central region of the galaxy are also seen in CO. Moreover, as somewhat expected, an early-type galaxy like Satsuki has a low molecular gas content. While there is a strong and compact H emission at the nucleus of Satsuki, no CO detection is found at this position. Instead, two knots are moderately detected in the northeast and southwest of the nucleus. Although their orientation is consistent with that of the possible past AGN jets indicated by X-ray cavities (O’Sullivan et al., 2019), deep CO observations are required to confirm the nature of these two knots.
We cannot rule out that the H and CO morphologies would appear more clumpy if the angular resolution is improved. The recently reported size of gas clumps in ram-pressure-stripped tails of galaxies range from several hundreds of parsec to several kpc (e.g., Bellhouse et al., 2017; Lee & Chung, 2018; Jáchym et al., 2019; López-Cobá et al., 2020). Although we are not able to resolve individual gas clumps with our 1.7 kpc resolution, if Totoro is intrinsically clumpy as ram-pressured stripped gas, we should see a sign of clumpy sub-structure given that the size of the object is as large as 6 – 8 kpc in diameter.
Ram-pressure-stripped gas is known to have high velocities (several hundreds of km s-1) and velocity dispersions ( 100 km s-1) (e.g., Bellhouse et al., 2017; Consolandi et al., 2017). Figure 3c and 3d display the CO and MaNGA H velocity fields in color scale. For ease of comparison, contours of CO integrated intensity map are overplotted on both velocity fields. There is a strong variation in the line of sight H velocity at the two connecting arms, with redshifted gas in the left tail and blueshifted gas in the right tail. Such features are not observed in the CO velocity field. At the main blob region of Totoro, both CO and H velocity field show no velocity gradient, little variation, and low velocity (mostly 60 km s-1) across the region, suggesting that the system is not in rotation, unless it is perfectly face-on. The velocity dispersion of H gas in the region of Totoro is only 50 km s-1 (Paper I); the narrow CO line width also implies a low gas velocity dispersion. Therefore, the gas kinematics of Totoro is in conflict with that of ram-pressure stripped gas. We should caution, however, that the velocity resolutions of our CO and H map are relatively low, 50 and 70 km s-1, respectively. Further observations are needed to probe the detailed kinematics of Totoro.
Moreover, if ram-pressure stripping is the main origin of Totoro, the molecular-gas data imply that the cold gas is stripped almost completely from Satsuki. However, such a scenario is disfavored by simulations of ram-pressure stripping (Steinhauser et al., 2012, 2016). A galaxy can lose all of its gas only in extreme cases of ram-pressure stripping, e.g., galaxy encounters high ICM densities with very high relative velocity. In addition, massive galaxies, are less prone to lose their gas due to ram-pressure stripping because the existence of a massive bulge can prevent the stripping of gas and reduce the amount of gas being stripped. Finally, galaxies that show ram-pressure stripping are mostly gas-rich late-type galaxies (Poggianti et al., 2017, and series of papers by the GAs Stripping Phenomena in galaxies with MUSE, GASP, team). For these reasons, the CO and H gas are unlikely to be moved from the center of Satsuki to the current position as a result of ram-pressure stripping. However, we note that this does not mean that the galaxy has not experienced any ram-pressure stripping. We come back to this discussion in Section 3.4.3.
| General Properties | |
|---|---|
| host | VII Zw 700 |
| (dry merger: Satsuki and Mei) | |
| redshifta | 0.0322 |
| distance to the host | 8 kpc |
| enviroment | merging group |
| Peak Positionb | |
| 12CO(1-0) | 17:15:22.46, 57:26:6.90 |
| Hc | 17:15:22.40, 57:26:7.83 |
| X-ray | 17:15:22.52, 57:26:7.89 |
| Luminosity | |
| 12CO(1-0) | 4.8 107 K km s pc2 |
| Hc | 5.9 1039 erg s-1 |
| X-ray | 4.4 1040 erg s-1 |
| Gas Mass | |
| cold gas (H2) | 2.1 108 M☉ (12CO (1-0)) |
| 1.9 108 M☉ (: cloud) | |
| 2.5 108 M☉ (: diffuse) | |
| warm gas (H) | 8.2 104 M☉ |
| hot gas (X-ray) | 1.2 109 M☉ |
| Other Properties | |
| SFRd | 0.047 M☉ yr-1 |
| cooling time | 2.2 108 yr |
-
a
Redshift of VII Zw 700, taken from the NASA-Sloan Atlas (http://nsatlas.org/).
-
b
Position of intensity peak in images, no centroid fitting is performed.
-
c
Based on MaNGA H data.
-
d
Based on the assumption that all MaNGA-H fluxes come from star formation.
3.2 Separate Galaxy
In Paper I, we argue that Totoro may be a separate galaxy interacting with the dry merger (Satsuki and Mei). We can examine this scenario by (1) searching for its underlying stellar component; (2) looking for interaction features; and (3) comparing the molecular gas and star formation properties of this galaxy candidate with other galaxy populations.
3.2.1 Underlying Stellar Counterpart
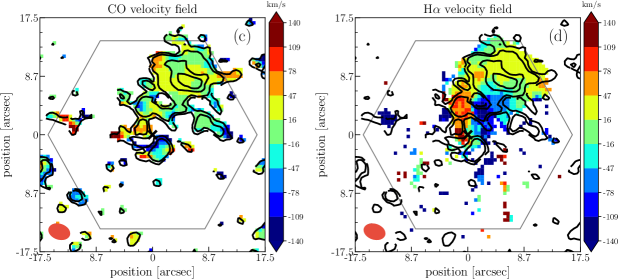
The CFHT -, -, , and -band images are presented in Figure 4a – 4c, respectively. There are extended stellar halos surrounding the two galaxies, but we find no apparent optical counterpart directly from the images at the position of Totoro. The limiting magnitude666The limiting surface brightnesses quoted here are different from that given in Paper I. This is because the former is scaled from the limiting magnitudes using 1 aperture size while the latter was measured using an aperture size corresponding to one arcsec2 area, which however is more affected by the Point Spread Function (PSF) because of the small aperture. and the surface brightness of Totoro are listed in Table 3. Due to the absence of an optical counterpart at the position of Totoro, only upper limits can be placed on surface brightnesses (i.e., limiting surface brightness of the observations).
In Paper I, we used a multi-component GALFIT (Peng et al., 2010) model for searching for a stellar component of Totoro from a -band image and found no sub-structure that is responsible for the blob. However, the residual of this complex parametric model still showed significant fluctuations that could hinder the detection of small scale sub-structure (see Figure 6 in Paper I). The on-going interaction of the main system creates an extended stellar envelope and asymmetric structures that are challenging to the model. In this paper, we use three different approaches to further search for a potential stellar counterpart to Totoro from multiple-band ( , , and ) images. All three methods are commonly used in literature for background subtraction and for both compact and extended source detection.
| band | limiting magnitude | surface brightness of Totoro |
|---|---|---|
| (1 radius) [mag] | (upper limit) [mag arcsec-2] | |
| 26.3 | 27.54 | |
| 25.7 | 26.94 | |
| 26.2 | 27.44 | |
| 25.2 | 26.44 |
Firstly, we use the Python photometry tool sep (Barbary et al., 2016)777https://github.com/kbarbary/sep to generate a “background” model of the image with small background box size (5 pixels). The tool sep uses the same background algorithm as in SExtractor (Bertin & Arnouts, 1996). We then subtract the “background” model from the image to increase the contrast around the main galaxies. This method has been used to separate galaxy stellar halos and the light from adjacent (background) objects (e.g., Huang et al., 2018; Rubin et al., 2018), and to identify faint, extended emission such as tidal tails (e.g., Mantha et al., 2019).
As a second approach, we subtract a blurred version of the image from the original one. The blurred version of the image is created by convolving the image with a circular Gaussian kernel ( pixels). This procedure is part of the unsharp masking method in digital image processing888The original unsharp mask technique re-scales the residual and add it back to the original image. and can also increase the contrast of the image. Compared to the first approach, the Gaussian convolution makes it more sensitive to a low threshold feature with a sharp edge. This method has been commonly used to identity HII regions in galaxies (e.g., Rahman et al. 2011; Pan et al. in preparation) and to detect faint embedded spiral and bar features in early-type galaxies (e.g., Barazza et al., 2002; Kim et al., 2012). The method has been applied to IFS data for the later purpose as well by Gomes et al. (2016).
For our third method, we perform isophotal fitting using the Ellipse task in IRAF (Tody, 1986, 1993). We first mask out all detected objects other than the main galaxy using sep. Then we run Ellipse on the masked images, allowing the centroid and the shape of the isophote to vary. Using the resulting isophotal parameters, we create the corresponding 2-D model using the bmodel task and subtract it from the input image. Compared to the GALFIT parametric model, the Ellipse one does not depend on the choice of model component and typically leads to smoother residuals. This approach has been routinely used to determine morphology of elliptical and lenticular galaxies (e.g., Hao et al., 2006; Oh et al., 2017) and to search for low-surface-brightness tidal features in nearby galaxies (e.g., Tal et al., 2009; Gu et al., 2013).
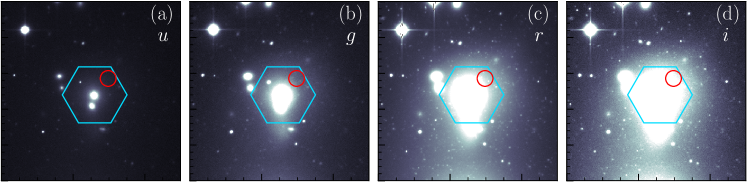
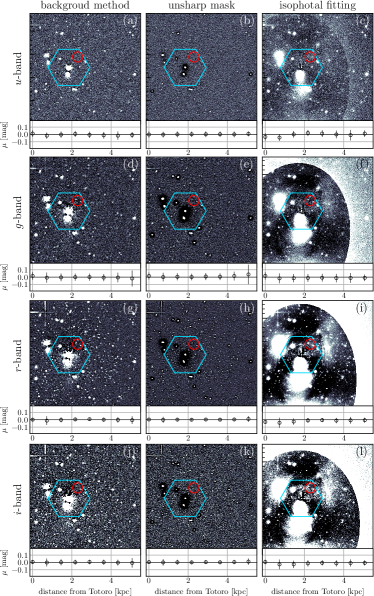
The residual maps of these methods are shown in Figure 5. From left to right the panels correspond to the analysis of the background, unsharp mask, and isophotal fitting methods; from top to bottom we show the residual maps and annular residual profiles of -, -, - and -band, respectively (-band results will be discussed later in this section). The annular profiles are centered on the H peak of Totoro. We also explore different parameters adopted in these procedures (e.g., the size of the background box or the convolution kernel). The choice of these parameters within a reasonable range does not affect the results.
Using these methods, we detect a large number of unresolved (point-like) sources on the -, - and -band images, presumably a combination of globular clusters of the main system and background galaxies. The residual profiles are generally flat, fluctuating around the zero value. This is true for all bands and methods, suggesting that there is no sign of a distinctive stellar counterpart at the position of Totoro. Therefore, our new analyses confirm the previous result by using GALFIT in Paper I. There are two unresolved sources in the Totoro area (red circle in Figure 5), but we do not notice any increase or decrease of number density around the Totoro area. The two sources are associated with neither H nor CO peak. We will come back to the nature of these two unresolved sources later. On the residual maps from the unsharp mask method, we uncover a pair of “ripple”-like features close to the center of the main galaxy. These sub-structures remain the same when we vary the convolution kernel used, and they resemble the structure we saw on the GALFIT residual maps in Paper I. Such “ripples” often relate to recent galaxy interaction or the presence of dust (e.g., Colbert et al., 2001; Kim et al., 2012; Duc et al., 2015; Bílek et al., 2016). However, it is unclear whether there is any connection between them and Totoro.
Since there is no optical (, , and ) continuum counterpart found in Totoro, it is expected to be composed mostly of young stars if it is indeed a galaxy. In Paper I, we use the excitation state of optical lines to constrain the presence of young stars. However, the result is method (diagnostic diagram) dependent. The -band luminosity of a galaxy is dominated by young stars of ages 1 Gyr, therefore it is more sensitive to any recent star formation than any of the other broad band luminosities available (Moustakas et al., 2006; Prescott et al., 2009; Zhou et al., 2017), and is a more straightforward probe than optical emission line diagnostics.
Similar to the bands, the -band emission in the MaNGA hexagonal FoV is dominated by the dry merger (Satsuki and Mei) as shown in Figure 4, but the -band data is less affected by the large stellar halos associated with the dry merger (Satsuki and Mei) than the redder bands, and therefore serves as a better probe for underlying stellar component. The limiting magnitudes and surface brightness of the -band image are 26.3 mag and 27.54 mag arcsec-2, respectively (Table 3). The point source in the upper-left corner of the dry merger (Satsuki and Mei) is a foreground star according to the MaNGA spectrum.
Although visually there is no distinguishable -band feature (i.e., recent star formation) associated with Totoro, to ensure that the -band counterpart of Totoro is not embedded within the light of the dry merger (Satsuki and Mei), we subtract the photometric models for the merging system from the -band image using the three different methods mentioned above. The residual maps and profiles are shown in the top row of Figure 5, respectively. The residual maps and profiles are not perfectly smooth, but we find no obvious evidence for a distinctive, extended -band counterpart at Totoro. The two point sources seen in -, -, and -band residual maps are also seen in the -band residual image of the isophotal fitting (and marginally seen in the background method as well). This confirms the results in Paper I that star formation alone can not explain the excitation state of Totoro.
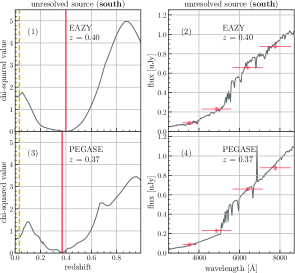
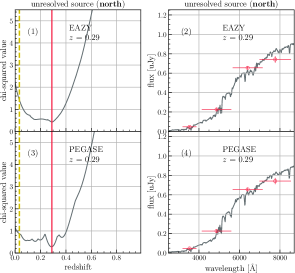
To gain some insight into the nature of the two unresolved objects in the Totoro area, their photometric redshifts are determined using the EAZY (Brammer et al., 2008) and PÉGASE 2.0 (Fioc & Rocca-Volmerange, 1997) template fitting the aperture magnitudes measured from the isophotal fitting residual images using GAIA (Graphical Astronomy and Image Analysis Tool). The default EAZY template is generated from the PÉGASE 2.0 models using the Blanton & Roweis (2007) algorithm and then calibrated using semi-analytic models, plus an additional young and dusty template. The PÉGASE 2.0 template is a library including 3000 models with a variety of star formation histories and with ages between 1 Myr and 20 Gyr, as described in detail in Grazian et al. (2006). Figure 6 shows the chi-squared of the fit for a given redshift using the EAZY and PÉGASE templates (left column of each panel) and the best-fit SED with observed fluxes at -, -, - and -band overlaid as red circles (right column of each panel). The results based on the EAZY and PÉGASE templates are presented in the top and bottom rows respectively. The minimum chi-squared value indicates that the southern source (17h15m22.111s, +57∘265.628) is a background galaxy at 0.40 and 0.37 using the EAZY and PÉGASE templates, respectively (Figure 6). The redshift of our target is marked by a yellow dashed line in the figures. We notice a second minimum at 0.03, close to the redshift of our target. However, at such low redshifts, the source would be resolved, not point like. The most plausible redshift of the northern source (17h15m22.573s, +57∘267.659) is 0.29 according to both templates (Figure 6), but we cannot rule out other possibilities of 0.4, in particular 0.15, due to the shallower basin-shaped chi-square distribution. Nonetheless, the redshift of Totoro (yellow dashed line) is not associated with any local minimum of the chi-square values. We find poorer fits when using stellar templates, providing further support that the source is not a nearby object. The best-fitted SEDs from PÉGASE are exported to SED-fitting code New-Hyperz999http://userpages.irap.omp.eu/~rpello/newhyperz/ in order to derive the stellar mass () and star formation rate (SFR) of these two objects. The results suggest that the southern and northern sources are 3 108 and 6 108 M☉ and their specific SFR (sSFR SFR/) are 10-11 yr-1. We also estimate their assuming they are at the same redshift as Totoro ( 0.03), and yield 106 and 107 M☉ for the southern and northern sources, respectively. Given their point-like morphologies ( 1 kpc2), we expect to see distinctive stellar mass surface density () distributions in the MaNGA data if they are associated with Totoro. However, we find no such features. It should be noted that the above stellar masses may be subjected to non-negligible uncertainties due to the lack of (near-) infrared measurements.
We use web interface Marvin101010https://dr15.sdss.org/marvin, a tool to visualise and analyse MaNGA data (Cherinka et al., 2019), to search for any signatures in the spectra of these two sources by redshifting strong optical emission lines (e.g., H) based on the derived photometric redshifts. However, the emission lines are too faint to be seen by MaNGA. Given their likely high redshift and their positions being offset from the centroid of the H blob, these two point sources are unlikely to be associated with Totoro.
3.2.2 Interaction Features
If Totoro is indeed a separate galaxy, it may possess another tidal tail on the other side of the blob (i.e., as opposed to the ones that connect the Totoro and Satsuki), but such tail(s) would not be seen by MaNGA due to the limited FoV. Figure 7 shows the new wide-field H image taken from the SAO RAS 6-m telescope. The new H map has a sensitivity comparable to that of MaNGA, but the FoV is 10 times larger. For comparison, Figure 7a zooms in to the region of the MaNGA hexagonal FoV. The new H image globally resembles that of the MaNGA H in Figure 1, but shows finer structures thanks to higher spatial resolution.
A zoom-out view of the region of interest is displayed in Figure 7b. There are several H knots beyond the MaNGA FoV towards the east. These are background galaxies or foreground stars. It is clear that there is no hint of H emission extending beyond the MaNGA FoV at the opposite side Totoro. Quantitatively, we can estimate the possible missing flux of MaNGA by comparing the H flux related with Totoro from the two observations. The total H luminosity of Totoro and the surrounding 15 ( 9 kpc) region outside of the MaNGA FoV (blue circle in Figure 7b) is 6.5 1039 erg s-1. The total H luminosity of Totoro measured by MaNGA is 5.9 1039 erg s-1. Therefore the possible missing flux of Totoro due to limited MaNGA FoV is no larger than 10%. Accordingly, the scenario of a separate galaxy appears less likely unless the tidal tail(s) develop at only one side of a galaxy. Such cases are relatively rare, though not impossible (e.g., Arp 173, Arp188, and Arp 273), depending on the stage of the interaction and the projected orientation on the sky (e.g., Mihos, 2004; Struck & Smith, 2012). However, the low gas velocity provides additional support against a merger scenario (Figure 3c and 3d).
On the other hand, it is possible that Totoro is a completely disrupted dwarf galaxy. The averaged surface brightness of Totoro has an upper limit of 27 mag arcsec-2 (Table 3). It would be classified as a dwarf low-surface-brightness galaxy (LSB; 23 mag arcsec-2) if it is a galaxy. In the next section, we compare the star formation and cold gas properties of Totoro with other galaxy populations, including LSBs.
As a side note, the nearby galaxy NGC 6338 is encompassed by the wide-field H observation. Figure 7c shows the H image of NGC 6338. There is no strong filaments or bridge linking NGC 6338 and VII Zw 700, presumably because the two are very separate entities (with projected separation of 42 kpc and 1400 km s-1 difference in line of sight velocity), but there is a bit more H emission between galaxies than the rest of the regions in the plotted area. The H emission of NGC 6338 is characteristic of three previously-reported filaments in the southeast and northwest quadrants. The H intensity contours of 0.035 and 0.09 10-16 erg s-1 cm-2 are overplotted to highlight the asymmetric filaments. We also refer the reader to Martel et al. (2004) and O’Sullivan et al. (2019) for higher-resolution H images of NGC 6338 and Gomes et al. (2016) for optical IFS data analysis of NGC 6338.
3.2.3 -SFR Relation of Galaxies
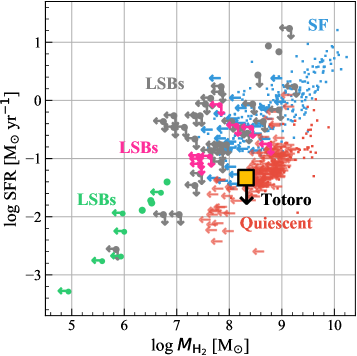
Another way to constrain the origin of Totoro using data in hand is to look into the question of whether Totoro shares similar gas and star formation properties with nearby galaxies. This could not be concluded in Paper I due to the lack of cold gas data. Figure 8 compares the star formation rate (SFR) and molecular gas mass () of Totoro with other galaxy populations. The plot resembles the Kennicutt-Schmidt relation (Kennicutt, 1989) assuming that the molecular gas and star-forming regions coexist. The galaxy data include nearby LSBs (O’Neil et al., 2003; Matthews et al., 2005; Cao et al., 2017), nearby star-forming (sSFR 10-11 yr-1) and quiescent (sSFR 10-11 yr-1) galaxies (Saintonge et al., 2017).
The total H luminosity of Totoro (including the connecting arms; 48.1 kpc2 area in total) is converted to SFR using the calibration of
| (1) |
(Kennicutt, 1998), where is H luminosity. This yields a SFR of 0.047 M☉ yr-1. Here we assume all of the H results from star formation, but this is unlikely to be the case as BPT diagnostics indicate a composite nature, LI(N)ER-HII mix excitation, for Totoro (Paper I). Therefore the derived SFR is an upper limit.
The total molecular gas mass of Totoro traced by CO is computed using
| (2) |
,where , , are CO-to-H2 conversion factor, integrated line flux density, and luminosity distance, respectively (Bolatto et al., 2013). We adopt a Galactic of 2 1020 cm-2 (K km s-1)-1 (Bolatto et al., 2013). The derived 111111We should note that the value of depends on the choice of . We may overestimate by 30% to a factor of a few if the metallicity of Totoro is indeed higher than the solar metallicity by 0.3 dex as discussed in the Introduction (Bolatto et al., 2013). Vantyghem et al. (2017) use the optical thin 13CO(3-2) emission line to estimate of the BCG of the cooling-core cluster RXJ08210752, finding a of a factor of two lower than the Galactic (our adopted) value. However, this is within the object-to-object scatter from extragalactic sources, and based on several assumptions such as isotopic abundance ratio and excitation line ratios. Statistical analysis is necessary in order to constrain the in BCGs. of Totoro is (2.10.1) 108 M☉. Note that the uncertainty due to different methodologies to derived the Galactic is 30% (Bolatto et al., 2013).
In addition to CO, the gaseous column density (and ) also follows from the amount of extinction , which can be derived from the MaNGA H and H data. For reference, the mean across Totoro is 0.5 mag. The conversion from extinction to H2 column density depends on the medium (Bohlin et al., 1978; Evans et al., 2009):
| (3) | ||||
| (4) |
These yield a of 1.9 108 and 2.5 108 M⊙ assuming molecular-cloud- (Equation 3) and diffuse-ISM-type (Equation 4) medium, respectively. The three derived using radio and optical measurements agree well with each other. The H2 mass derived from CO is used for the discussion in the rest of the paper.
Although only upper limits could be achieved for many LSB objects, they largely follow the trend established by star forming galaxies towards the lower end in both and SFR axes, consistent with the finding of McGaugh et al. (2017). On the other hand, quiescent galaxies, mostly early types, have lower SFR for a given and a lower CO detection rate than that of star-forming galaxies (see also Calette et al., 2018). Due to the low SFR, Totoro deviates from the SFR- relation formed by LSBs and star-forming galaxies and appears to overlap with quiescent galaxies.
The H emission in quiescent galaxies is dominated by LI(N)ER excitation (Hsieh et al., 2017; Pan et al., 2018). In the LI(N)ER regions of quiescent galaxies, surface density of H luminosity () is found to be tightly correlated with underlying (Hsieh et al., 2017), in which the H are primarily powered by the hot, evolved stars rather than recent star formation. BPT diagnostics suggest that Totoro is powered by a composite (LI(N)ER-HII mix) mechanism (Paper I). If Totoro is analogous to a LI(N)ER region in quiescent (early-type) galaxies, the average of Totoro corresponds to a of 7 108 M☉ kpc-2 according to the “resolved LI(N)ER sequence” of quiescent galaxies reported by Hsieh et al. (2017). The predicted is higher than the mass of Satsuki’s stellar halo by a factor of 3 – 5; however, there is no distinct stellar counterpart at the location of Totoro. For this reason, in spite of the overlap in Figure 8, Totoro is not analogous to the LI(N)ER region in quiescent galaxies. Lastly, we should note that if the true global SFR of Totoro is considerably lower than the upper limit, Totoro would fall below the main cloud of data points of quiescent galaxies.
As a whole, Totoro is unlikely to be consistent with nearby normal star-forming, early-type, and low-surface-brightness galaxies in terms of the Kennicutt-Schmidt relation and the resolved LI(N)ER sequence. In addition, it is worth noting that the average of Totoro corresponds to a SFR surface density () at least 6 times higher than the observed upper limit based on the local - relation derived from MaNGA galaxies (Li et al., 2019). Generally speaking, the dust and star formation relation (if any) of Totoro is also dissimilar to that of star-forming regions in nearby galaxies even when the systematic dependencies on other physical properties (e.g., metallicity) are considered.
While LSBs have been studied for decades, recently, van Dokkum et al. (2015) have identified a new class of LSBs in the Coma cluster, ultra-diffuse galaxies (UDGs). These UDGs have a surface brightness as low as 24.5 mag arcsec-2, but their sizes are similar to those of galaxies. It is not clear how UDGs were formed. One possible scenario is that UDGs are failed massive galaxies, which lost their gas at high redshift by ram-pressure stripping or other effects after forming their first generation of stars (van Dokkum et al., 2015; Yozin, & Bekki, 2015). Our finding of a large molecular gas reservoir appears in direct conflict with this scenario.
On the other hand, several studies suggest that UDGs are extended dwarf galaxies. Some simulations predict them to be rapidly rotating (Amorisco, & Loeb, 2016). Di Cintio et al. (2017) suggest that the extended sizes of UDGs are the consequence of strong gas outflows driven by starbursts. However, the SFR of Totoro is extremely low and the system is not rotating. Altogether, there is no evidence in our data to support Totoro as an UDG.
In summary, the newly obtained CO, H, and -band data allow us to better constrain the nature of Totoro; however, combining the results in Section 3.2, we argue that Totoro is unlikely to be a separate galaxy interacting with the dry merger (Satsuki and Mei). The reasons include the lack of stellar counterpart and tidal features and the different star formation, ionized and cold gas, and dust properties (i.e., -SFR, -, and - relations and gas kinematics) from that of a variety of nearby galaxy populations (i.e., star-forming and quiescent galaxies, LSBs, and UDGs).
3.3 AGN-driven Activity
3.3.1 Multi-wavelength Nuclear Characteristics
Radio. A possible origin of Totoro is gas that is photoionized by X-ray emission from a misaligned blazar at the core of Satsuki. A blazar is a sub-class of radio-loud AGN which is characterized by one-sided jet structure (Urry & Padovani, 1995). However, blazars invariably have bright compact radio cores, whereas no detection at 1.4 GHz is found for Satsuki (Wang et al., 2019; O’Sullivan et al., 2019) and there is only marginal detection at 5 GHz (Paper I). For these reasons, a blazar is a very unlikely scenario for Totoro.
Optical. The H equivalent width (EW) is 3Å across the entire H-emitting region and the EW does not present a rise towards the center of Satsuki. The H velocity dispersion does not present a central peak either (Paper I). Moreover, the H luminosity of Satsuki follows the continuum emission, i.e., does not present a central peak emission with stronger intensities that follows an or lower decline from the center (Singh et al., 2013). Therefore, Satsuki presents a lack of optical characteristics of a strong AGN.
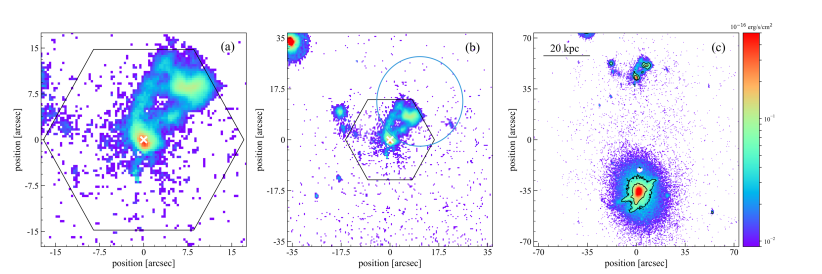
X-ray. A comprehensive study of the X-ray emission of the region based on Chandra and XMM-Newton data has been reported recently by O’Sullivan et al. (2019). Figure 9a shows the Chandra X-ray image of the NGC 6338 group taken from O’Sullivan et al. (2019). X-ray and galaxy velocity studies have shown the group to be a high-velocity near head-on merger (Wang et al., 2019), with the two group cores visible as bright clumps of X-ray emission with trailing X-ray tails. The northern and southern clumps are respectively associated with VII Zw 700 and NGC 6338. Figure 9b zooms in to the MaNGA observed region. The northern X-ray clump, around Satsuki, is dominated by a bar of X-ray emission extending roughly southeast-northwest. The clump and bar are centered somewhat to the north of the optical centroid of Satsuki, and the bar is made up of three X-ray knots whose intensities progressively decrease from the western end. The nuclei of Satsuki and Mei are not correlated with the brightest X-ray emission (see also Wang et al., 2019). Nonetheless, after subtracting the overall surface brightness distribution, there is a hint of excess X-ray emission at the position of the nuclei of Satsuki and Mei (see O’Sullivan et al. 2019 for the construction of the overall surface brightness distribution). X-ray luminosities of 4.17 1039 erg s-1 for the nucleus of Satsuki and 2.5 1038 erg s-1 for Mei are reported (O’Sullivan et al., 2019). The values suggest that there are no strong X-ray AGN in Satsuki or Mei or the AGNs are fading. For reference, the X-ray luminosity of Totoro is (4.40.2) 1040 erg s-1.
3.3.2 Gas Ejected by AGN
All in all, the multi-wavelength data show no direct evidence for an active ongoing AGN in Satsuki. However, it is known that the AGN luminosity can vary over timescales as short as 105 years. Thus, we still cannot rule out the possibility of a recent AGN outflow. AGN-driven extended outflows are detected in multiple phases, including ionized gas and many molecular lines (Roberts-Borsani, 2020, and references therein). Even though the observed radial extent of AGN outflows is 1 kpc in most cases, galactic scale outflows, as Totoro would be, given its extreme distance from Satsuki, are also reported (e.g., López-Cobá et al., 2019; Leung et al., 2019; López-Cobá et al., 2020). However, the low gas velocities (Figure 3c and 3d) do not support the scenario of an energetic outflow.
Nonetheless, we should note that although an AGN does not seem like a plausible mechanism for moving H or CO out of the galaxy core to the current position of Totoro, the potential cavities identified in Satsuki suggest that in the past ( 40 Myr ago) the AGN was indeed active and had non-negligible impact on its surroundings (O’Sullivan et al., 2019).
3.3.3 Gas Ionized by AGN
There have been studies showing that AGNs are able to ionize gas extending to large distance, such as the well-known ionized cloud Hanny’s Voorwerp 20 kpc from its host galaxy IC 2497 (e.g., Husemann et al., 2008; Lintott et al., 2009; Husemann et al., 2010). It is believed that an interaction-triggered, currently fading AGN, illuminated and ionized Hanny’s Voorewerp (Lintott et al., 2009; Józsa et al., 2009; Keel et al., 2012). Diffuse ionized gas similar to Hanny’s Voorewerp was also found 32 kpc north of the iconic interacting galaxies NGC 5194/5195 or M51 (Watkins et al., 2018). The low AGN luminosity and activity and the tidal history provide similarities between Satsuki, IC 2497 and M51.
However, there are also several differences between Hanny’s Voorwerp and the M51 cloud and Totoro in terms of excitation state (Seyfert versus LINER-HII, morphology (diffuse for Hanny’s Voorwerp and M51’s cloud versus centrally-concentrated for Totoro), and the properties of the host galaxy (late type versus early type, see Paper I for the details). For these reasons, we argue that this scenario is unlikely.
3.4 Cooling Gas
3.4.1 Spatial Comparison of Cold, Warm, and Hot Gas
A scenario we did not consider in Paper I is the cooling of the hot IGM or ICM. Observations of the central regions of some galaxy groups and clusters show strong X-ray emission suggesting that the IGM and ICM are undergoing rapid cooling (e.g., Fabian, 1994), and in some cases ionized and molecular gas which are thought to be the product of that cooling (Babyk et al., 2018; Lakhchaura et al., 2018; Olivares et al., 2019; Russell et al., 2019).
O’Sullivan et al. (2019) shows that the X-ray peak of the southern clump in Figure 9a is consistent with the optical centroid of NGC 6338. Three X-ray filaments are observed to extend from the galaxy center, following the same branching filamentary structure as the H gas (Figure 7c). These X-ray filaments are cooler than their surroundings and have very low gas entropies and short cooling times (O’Sullivan et al., 2019), strongly indicating that they are a locus of cooling from the IGM. Young X-ray cavities are also found in NGC 6338, suggesting recent AGN outbursts in this galaxy.
As shown in Figure 9b, the peak of H emission (contours) at the nucleus of Satsuki is not associated with the bar, but the position of Totoro corresponds to the brightest X-ray peak. This was first noted by O’Sullivan et al. (2019) who showed that this was also the coolest part of the X-ray bar, and concluded that the H was likely material cooled from the IGM, as in the filaments of NGC 6338. They also suggested that the offset between Satsuki and the center of the X-ray clump is evidence that ram-pressure forces caused by the (supersonic) motion of the galaxy are detaching the gas from the galaxy. In this scenario, the X-ray bar would once have been centered on Satsuki, but has been pushed back to the north and perhaps along the line of sight, away from the galaxy core.
Figure 9c shows our CO data overlaid on the Chandra image. The molecular gas is well correlated with the western X-ray knot, and (as previously discussed) with the H. Figures 9d-e show the Chandra temperature maps from O’Sullivan et al. (2019) showing the cool gas around NGC 6338 and Satsuki, and the high-temperature gas between the two, which has been shock-heated by the group-group merger. Overlaid H and CO contours show that the ionized and molecular gas are located in the coolest part of the IGM, as in NGC 6338 and the centers of other groups and clusters (e.g., Salomé et al., 2006; Hamer et al., 2012).
3.4.2 Cooling Time and Gas Properties
Studies have shown that warm and cold gas in the brightest group and cluster galaxies (BCGs) are preferentially observed in systems where the cooling times lie below 1 Gyr (Edge, 2001; Salomé, & Combes, 2003; Cavagnolo et al., 2008; Rafferty et al., 2008; Pulido et al., 2018). O’Sullivan et al. (2019) found that the cooling times are as short as 1 Gyr in both cores of Satsuki and NGC 6338. We can also estimate the cooling time around Totoro, i.e., the west end of the X-ray bar as a cylinder of radius 2.8(1.5 kpc) and length 11.2 (5.9 kpc, corresponding to the Region 2 in Figure 10b of O’Sullivan et al. 2019). The temperature, density, and luminosity of the X-ray gas are estimated via spectral fitting of the data. Using Equation (1) in O’Sullivan et al. (2019), we estimate the cooling time () in the Totoro region to be 2.2 108 yr, well within the regime where warm and cold gas are expected.
If the warm and cold gas have indeed cooled from the hot gas, one would expect the hot gas to be significantly more massive than the cool/warm gas. The hot gas mass is derived from a radial deprojected profile (Figure 9 in O’Sullivan et al. 2019), centering on the middle of the X-ray bar. Within a radius of 6.5 kpc, the hot gas mass () is 109 M☉. The derived hot gas mass is indeed significantly higher than the total mass of warm ( 105 M⊙ from H) and cold gas ( 108 M⊙ from CO).
The ratio of the cold to hot gas of Totoro is 17%. Pulido et al. (2018) investigate the molecular gas properties of 55 central cluster galaxies. They found a strong correlation of hot and cold gas mass traced by X-ray and CO, suggesting that the hot and cold gas arise from the same ensemble of clouds. In other words, the cold gas is unlikely a result of external effects, such as merger or stripping from a plunging galaxy. The average fraction of cold to hot gas in their sample is 18%. The cold to hot gas mass ratio of Totoro is in good agreement with that of these central cluster galaxies (see also Olivares et al., 2019). The consistency provides support that a similar process to that in the central cluster galaxies has occurred in Satsuki and Totoro.
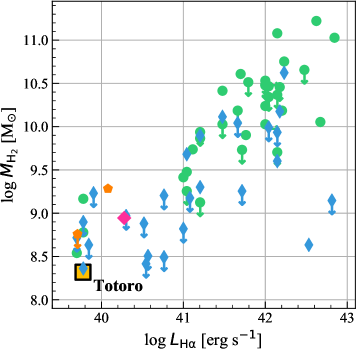
In addition, molecular mass has been found to be correlated with the amount of H gas expressed by in the cooling-core galaxies of clusters (Edge, 2001; Salomé, & Combes, 2003). In Figure 10 we show the H2 gas mass versus for data taken from the literatures. Totoro is overlaid with a orange square, and falls at the low end of the correlation. The consistency of Totoro with the - relationship of cooling systems again supports a similar process of cooling in the system. To put it another way, our multi-wavelength data of Totoro show that its position on the mass (or luminosity) relations between cold ( 100 K; CO), warm ( 104 K, H), and hot ( 107 K, X-ray) gas is in line with the gas content of systems with short cooling times. We summarize the physical properties of Totoro in Table 2.
As a side note, the cold and warm gas in cooling systems often appear filamentary, but it is worth noting that the multi-phase gas morphologies of our target are strikingly similar to the BCG of cluster Abell 1991 reported by Hamer et al. (2012) (see their Figure 2). The H-emitting gas is relatively circular (blob-like) and is spatially coincident with the most rapidly cooling region (X-ray peak) of the ICM. The peak in the H and X-ray gas lies roughly 11 kpc to the north of the BCG, and there are connecting arm structures between the peak and the secondary peak at the galactic nucleus. Moreover, the bulk of the molecular gas with a mass of 8 108 M☉ is also found at the location of the cooling region. However, note that spatial resolution must play an important role in detecting the morphology of cooling gas. We cannot rule out that the morphologies of Totoro and the cooling gas in Abell 1991 are more filamentary than a single peak.
Finally, the velocity fields of cooling gas in galaxy clusters, traced by CO and H, are characteristic of slow motions (projected velocity 400 km s-1), narrow line widths ( 250 km s-1) and a lack of relaxed (e.g., rotating) structures (e.g., Salomé et al., 2008; Hamer et al., 2012; Olivares et al., 2019). The observed velocity structures, despite low velocity resolutions, of Totoro traced by CO and H (Figures 3c and 3d) agree with that of other cooling systems. In addition, the gas velocities of Totoro traced by CO and H are not exactly identical, but the differences are small, 35 km s-1 at the main blob region and 60 – 90 km s-1 at the connecting arms. This is also consistent with the finding by Olivares et al. (2019) that the velocity difference between CO and H gas is well below 100 km s-1, providing an additional support for CO and H gas arising from the same bulk of clouds. The velocity difference may be related to different velocity resolution of CO and H observations and line of sight projection effect. We should note again that our CO and H observations suffer from low velocity resolutions, therefore the velocity fields must be interpreted with caution. Nonetheless, the maps still provide a guide of the velocity resolution needed for future observation of this system. Future high velocity-resolution CO and H observations are required to reveal the detailed gas kinematics of Totoro.
3.4.3 Environments
While most of the studies of cooling gas focus on BCGs in rich clusters, cold gas cooling from the hot X-ray medium is also observed at smaller scales in galaxy groups, such as NGC 5044, NGC 4638 and NGC5846 (David et al., 2014; Temi et al., 2018). In fact, the observed cool-core fractions for galaxy groups are slightly higher than those of galaxy clusters (O’Sullivan et al., 2017). Therefore, gas cooled from the IGM is not unique to Totoro.
In Section 3.1, we argue that the cold gas in Totoro is unlikely to be the primitive gas of Satsuki being stripped by ram-pressure. Nonetheless, the X-ray tail (Figure 9a) and the offset between the center of the X-ray bar and the optical centroid of Satsuki are both evidence that the motion of the dry merger (Satsuki and Mei) is rapid enough to lead to stripping of the hot gas halo (O’Sullivan et al., 2019). The question then arises of where and when the ionized and molecular gas we observe was formed; have ram-pressure or other effects changed its location? We might normally expect to see the most rapid cooling in or near the galaxy center. However, the offset of the X-ray bar means that the densest, coolest IGM gas is no longer located at the center of Satsuki. Ram-pressure, by pushing the X-ray halo and bar away from the core of Satsuki, may therefore have caused a reduction in cooling in the galaxy center (O’Sullivan et al., 2019).
CO emission occurs in dense molecular clouds which are “self-shielding” from the ionizing effects of the surrounding environment. While some of the H emission likely comes from the outer layers of such molecular cloud complexes, observations show that in some cooling systems the H emission is considerably more extended than the molecular gas (e.g., in NGC 5044; Schellenberger et al., 2020) which may suggest it is associated with a less dense cooled gas component. Such low-density material would likely move with the surrounding IGM if ram-pressure pushed it back from the galaxy. Dense molecular clouds would not be affected by ram-pressure, and might be expected to fall under gravity toward the center of Satsuki, unless they are connected to the IGM via magnetic fields (McCourt et al., 2015) or surrounding layers of neutral and ionized gas (Li et al., 2018). Even with such connections to the surrounding environment, it seems implausible that the molecular gas could have condensed out of the IGM in the core of Satsuki and then been uplifted. The correlation between the CO, H and the coolest X-ray gas strongly suggests that the molecular and ionized gas is the product of cooling from the IGM at its current location, i.e., that cooling has occurred (and may be ongoing) in Totoro, well outside the center of Satsuki.
Last but not least, as suggested by O’Sullivan et al. (2019) and this work, we are witnessing a merger between two groups undergoing rapid radiative cooling. Further analysis on the multi-wavelength phase of cooling gas in NGC 6338, from cold to hot gas as in this study, will be carried in a separate paper (O’Sullivan et al. in preparation).
3.4.4 Future of the Gas
Cooling gas can potentially serve as the fuel for an AGN and/or central star formation (O’Dea et al., 2008; Rafferty et al., 2008; Mittal et al., 2009; Hicks et al., 2010; Fogarty et al., 2017). In X-ray bright groups, like our target, star formation in the central galaxy is generally weak even in systems known to be cooling. By contrast, as many as 85 – 90% of group-dominant galaxies have radio AGN, moreover, dominant galaxies with active or recently active radio jets are relatively common in X-ray bright groups (Kolokythas et al., 2018, 2019). Galaxy cluster-dominant galaxies, however, seem much more likely to have significant star formation.
Here we consider whether the cooling gas would fuel star formation assuming the gas will fall back into Satsuki. McDonald et al. (2018) compare the cooling rate of the ICM/IGM to the observed SFR in the central galaxy for a sample of isolated ellipticals, groups, and clusters. They found that the cooling ICM/IGM is not providing the fuel for star formation in systems with cooling rate 30 M☉ yr-1, which are dominated by groups and isolated ellipticals. On the other hand, SFR increases with increasing cooling rate for the rapidly cooling systems ( 30 M☉ yr-1), presumably due to an increase in either the cooling efficiency of the hot gas or the star formation efficiency of the cooled gas (see also Edge, 2001; Salomé, & Combes, 2003; O’Dea et al., 2008). The cooling rate (/) of Totoro is 109 M☉/2.2 108 yr 5 M☉ yr-1. In this aspect, the cooling gas in our group-dominant, relatively low cooling-rate system is less likely to significantly contribute to star formation.
Moreover, star formation can be suppressed by AGN feedback even in systems with short cooling times. The summed AGN jet power () for both cavities associated with Satsuki from O’Sullivan et al. (2019) is (0.97 – 2.67) 1041 erg s-1 (an estimate of heating; the actual value depends on the cavity age used: buoyant rise time, sonic expansion time-scale, or refill time), the energy is comparable to the X-ray luminosity for the whole X-ray emitting gas ( 3 1041 erg s-1; an estimate of cooling). Rafferty et al. (2008) find a tendency for star-forming systems to have low / ratios ( 1) and quiescent systems to have high / ratios ( 1), supporting the suppression of star formation by AGN feedback. However, this is not exclusively the case; star-forming cooling systems can have high / ratios, and vice versa. The estimated heating available from the cavities around Satsuki make it a borderline case, and the ongoing merger and stripping add to the complexities. The fate of Totoro may depend on how effectively energy from the cavities can heat their surroundings.
Finally, it is worth mentioning that Satsuki and Totoro may host a little star-formation activity with an upper limit of 0.059 and 0.047 M☉ yr-1, respectively, assuming all the H fluxes come from star formation. It is unclear if the current star formation (if any) is related to the cooling and gas fueling processes. McDonald et al. (2018) attribute the low-level star formation in low cooling rate systems to recycling of gas lost by evolved stars, namely, the star formation is not related to cooling gas.
4 Summary
In Paper I, we identified an H blob Totoro 8 kpc away from a dry merger (Satsuki and Mei) from MaNGA data (Figure 1). Here we present new optical (wide-field H and -band), millimeter (12CO(1-0)) observations, and published X-ray data (O’Sullivan et al., 2019), with the aim of providing significant constraints and answers to fundamental questions regarding the nature of Totoro. The main conclusions of this paper are as follows:
- •
We consider whether Totoro is a separate galaxy interacting with the dry merger (Satsuki and Mei) from several aspects:
- •
- •
-
•
However, Totoro shows different star formation, gas, and dust properties (in terms of -SFR, -, and - relations and gas kinematics) from that of a variety of nearby galaxy populations (i.e., star-forming and quiescent galaxies, low-surface-brightness and ultra-diffuse galaxies). Therefore, Totoro is unlikely to be a separate galaxy interacting with the dry merger (Satsuki and Mei) (Section 3.2.3 and Figure 8).
-
•
The -band data, which are sensitive to recent star formation, show no strong sign of recent star formation at the position of Totoro. Therefore, the ionized gas of Totoro is unlikely to be powered by star formation, confirming the results of emission line ratios diagnostics in Paper I and previous bullet-point that Totoro is not an analogue of a star-forming region in nearby galaxy populations (Section 3.2.1 and Figure 5).
We consider whether Totoro is a result of AGN activity.
-
•
However, in spite of possible past AGN outbursts, the multi-wavelength data show no direct evidence for an active ongoing AGN in Satsuki or Mei. Moreover, Totoro is unlikely to be gas being ionized or ejected by an AGN as its physical properties (gas excitation state, morphology, and kinematics, etc.) are distinct from similar objects (Section 3.3).
Finally, we consider whether Totoro is formed via cooling of hot IGM as implied by O’Sullivan et al. (2019).
-
•
We compare the spatial distribution of H and CO with X-ray intensity and temperature maps. We find that the ionized and molecular gas are related to the most rapidly cooling region of the hot IGM. The cooling time in the Totoro region is well within the regime where cooling is expected (Section 3.4.1 and 3.4.2 and Figure 9).
-
•
The mass (or luminosity) relations between cold ( 100 K; CO), warm ( 104 K, H), and hot ( 107 K, X-ray) gas, as well as gas kinematics are in line with the gas content of cooling systems, supporting again that Totoro originates from the same physical process of cooling gas (Section 3.4.2 and Figure 10).
-
•
Previous study by O’Sullivan et al. (2019) suggests that the densest, coolest X-ray gas has been pushed away from the core of the host galaxy Satsuki by ram-pressure. The correlation between the CO, H and the coolest X-ray gas presented in this work strongly suggests that the molecular and ionized gas is the product of cooling from the hot X-ray gas and is formed at its current location, leading to the observed offset cooling and the reduction in cooling in the galaxy core (Section 3.4.3).
-
•
The cooling rate of Totoro is considerably lower than that of star-forming cooling systems. The estimated heating available from the cavities around Satsuki is comparable to the cooling X-ray luminosity. The fate of Totoro may depend on how effectively energy from the cavities can heat their surroundings, but note that the ongoing merger (Satsuki, Mei, and NGC 6338) and stripping add to the complexities (Section 3.4.4).
In the majority of clusters the peaks of optical and X-ray emission are very close to the center of galaxy, so it is difficult to determine whether the appearances of warm or even cold gas are primarily related to the cooling of the IGM/ICM or the host galaxy. Offset cooling is rare ( 5%, e.g., Hamer et al., 2012), therefore VII Zw 700 provides an exceptional opportunity to constrain the gas cooling process and the interplay between cooling gas and host galaxy. In future work, we intend to constrain the gas kinematics at the connecting arms with high-spectral-resolution data to quantify the potential of a fueling process for Satsuki. A detailed multi-wavelength analysis, from CO to H, to other optical lines (e.g., H, [NII], [OIII], etc.), and to X-ray, will be presented in an upcoming paper (O’Sullivan et al in preperation). Moreover, the large sample of optical IFU survey MaNGA ( 5,000 galaxies in the latest SDSS data releases DR15/16 and 10,000 in the future) along with the Chandra archive is a suitable starting point for future multi-wavelength statistical studies of cooling gas properties. Although MaNGA does not target specific environments, the large sample size of MaNGA ensures observations of numerous galaxies located in groups and clusters. Given the significant fraction of cooling cores in galaxy clusters/groups (e.g., Mittal et al., 2009; O’Sullivan et al., 2017), more cooling gas candidates are expected in the final MaNGA sample.
References
- Afanasiev, & Moiseev (2011) Afanasiev, V. L., & Moiseev, A. V. 2011, Baltic Astronomy, 20, 363
- Aguado et al. (2019) Aguado, D. S., Ahumada, R., Almeida, A., et al. 2019, ApJS, 240, 23
- Amorisco, & Loeb (2016) Amorisco, N. C., & Loeb, A. 2016, Monthly Notices of the Royal Astronomical Society, 459, L51
- Babyk et al. (2018) Babyk, I. V., McNamara, B. R., Nulsen, P. E. J., et al. 2018, ApJ, 857, 32
- Baldwin et al. (1981) Baldwin, J. A., Phillips, M. M., & Terlevich, R. 1981, PASP, 93, 5
- Balogh et al. (2004) Balogh, M. L., Baldry, I. K., Nichol, R., et al. 2004, ApJ, 615, L101
- Barazza et al. (2002) Barazza, F. D., Binggeli, B., & Jerjen, H. 2002, A&A, 391, 823
- Barbary et al. (2016) Barbary, K. 2016, The Journal of Open Source Software, 1,58, doi: 10.21105/joss.00058
- Bellhouse et al. (2017) Bellhouse, C., Jaffé, Y. L., Hau, G. K. T., et al. 2017, ApJ, 844, 49
- Bellhouse et al. (2019) Bellhouse, C., Jaffé, Y. L., McGee, S. L., et al. 2019, MNRAS, 485, 1157
- Bertin & Arnouts (1996) Bertin, E., & Arnouts, S. 1996, A&AS, 117, 393
- Bílek et al. (2016) Bílek, M., Cuillandre, J.-C., Gwyn, S., et al. 2016, A&A, 588, A77
- Blanton & Roweis (2007) Blanton, M. R., & Roweis, S. 2007, AJ, 133, 734
- Blanton et al. (2017) Blanton, M. R., Bershady, M. A., Abolfathi, B., et al. 2017, AJ, 154, 28
- Bohlin et al. (1978) Bohlin, R. C., Savage, B. D., & Drake, J. F. 1978, ApJ, 224, 132
- Bolatto et al. (2013) Bolatto, A. D., Wolfire, M., & Leroy, A. K. 2013, ARA&A, 51, 207
- Bond et al. (1991) Bond, J. R., Cole, S., Efstathiou, G., et al. 1991, ApJ, 379, 440
- Boselli et al. (2016) Boselli, A., Cuillandre, J. C., Fossati, M., et al. 2016, A&A, 587, A68
- Brammer et al. (2008) Brammer, G. B., van Dokkum, P. G., & Coppi, P. 2008, ApJ, 686, 1503
- Brammer et al. (2009) Brammer, G. B., Whitaker, K. E., van Dokkum, P. G., et al. 2009, ApJ, 706, L173
- Bundy et al. (2015) Bundy, K., Bershady, M. A., Law, D. R., et al. 2015, ApJ, 798, 7
- Calette et al. (2018) Calette, A. R., Avila-Reese, V., Rodríguez-Puebla, A., et al. 2018, Rev. Mexicana Astron. Astrofis., 54, 443
- Cao et al. (2017) Cao, T.-W., Wu, H., Du, W., et al. 2017, AJ, 154, 116
- Cavagnolo et al. (2008) Cavagnolo, K. W., Donahue, M., Voit, G. M., et al. 2008, ApJ, 683, L107
- Cherinka et al. (2019) Cherinka, B., Andrews, B. H., Sánchez-Gallego, J., et al. 2019, AJ, 158, 74
- Colbert et al. (2001) Colbert, J. W., Mulchaey, J. S., & Zabludoff, A. I. 2001, AJ, 121, 808
- Consolandi et al. (2017) Consolandi, G., Gavazzi, G., Fossati, M., et al. 2017, A&A, 606, A83
- David et al. (2014) David, L. P., Lim, J., Forman, W., et al. 2014, ApJ, 792, 94
- Di Cintio et al. (2017) Di Cintio, A., Brook, C. B., Dutton, A. A., et al. 2017, Monthly Notices of the Royal Astronomical Society, 466, L1
- Dopita et al. (2016) Dopita, M. A., Kewley, L. J., Sutherland, R. S., et al. 2016, Ap&SS, 361, 61
- Drory et al. (2015) Drory, N., MacDonald, N., Bershady, M. A., et al. 2015, AJ, 149, 77
- Duc et al. (2015) Duc, P.-A., Cuillandre, J.-C., Karabal, E., et al. 2015, MNRAS, 446, 120
- Edge (2001) Edge, A. C. 2001, MNRAS, 328, 762
- Egami et al. (2006) Egami, E., Misselt, K. A., Rieke, G. H., et al. 2006, ApJ, 647, 922
- Ellison et al. (2008) Ellison, S. L., Patton, D. R., Simard, L., et al. 2008, AJ, 135, 1877
- Evans et al. (2009) Evans, N. J., Dunham, M. M., Jørgensen, J. K., et al. 2009, ApJS, 181, 321
- Fabian (1994) Fabian, A. C. 1994, ARA&A, 32, 277
- Fernández-Trincado et al. (2014) Fernández-Trincado, J. G., Forero-Romero, J. E., Foex, G., et al. 2014, ApJ, 787, L34
- Fioc & Rocca-Volmerange (1997) Fioc, M., & Rocca-Volmerange, B. 1997, A&A, 326, 950
- Fogarty et al. (2017) Fogarty, K., Postman, M., Larson, R., et al. 2017, ApJ, 846, 103
- Gomes et al. (2016) Gomes, J. M., Papaderos, P., Kehrig, C., et al. 2016, A&A, 588, A68
- Grazian et al. (2006) Grazian, A., Fontana, A., de Santis, C., Nonino, M., Salimbeni, S., Giallongo, E., Cristiani, S., Gallozzi, S., et al. 2006, A&A, 449, 951
- Gu et al. (2013) Gu, M., Ho, L. C., Peng, C. Y., et al. 2013, ApJ, 773, 34
- Gunn, & Gott (1972) Gunn, J. E., & Gott, J. R. 1972, ApJ, 176, 1
- Gwyn (2008) Gwyn, S. D. J. 2008, PASP, 120, 212
- Hamer et al. (2012) Hamer, S. L., Edge, A. C., Swinbank, A. M., et al. 2012, MNRAS, 421, 3409
- Hao et al. (2006) Hao, C. N., Mao, S., Deng, Z. G., et al. 2006, MNRAS, 370, 1339
- Hicks et al. (2010) Hicks, A. K., Mushotzky, R., & Donahue, M. 2010, ApJ, 719, 1844
- Hopkins et al. (2008) Hopkins, P. F., Hernquist, L., Cox, T. J., et al. 2008, ApJS, 175, 356
- Hsieh et al. (2017) Hsieh, B. C., Lin, L., Lin, J. H., et al. 2017, ApJ, 851, L24
- Huang et al. (2018) Huang, S., Leauthaud, A., Greene, J. E., et al. 2018, MNRAS, 475, 3348
- Husemann et al. (2008) Husemann, B., Wisotzki, L., Sánchez, S. F., et al. 2008, A&A, 488, 145
- Husemann et al. (2010) Husemann, B., Sánchez, S. F., Wisotzki, L., et al. 2010, A&A, 519, A115
- Jáchym et al. (2019) Jáchym, P., Kenney, J. D. P., Sun, M., et al. 2019, ApJ, 883, 145
- Józsa et al. (2009) Józsa, G. I. G., Garrett, M. A., Oosterloo, T. A., et al. 2009, A&A, 500, L33
- Keel et al. (2012) Keel, W. C., Lintott, C. J., Schawinski, K., et al. 2012, AJ, 144, 66
- Kennicutt (1989) Kennicutt, R. C. 1989, ApJ, 344, 685
- Kennicutt (1998) Kennicutt, R. C. 1998, ApJ, 498, 541
- Kim et al. (2012) Kim, T., Sheth, K., Hinz, J. L., et al. 2012, ApJ, 753, 43
- Kolokythas et al. (2018) Kolokythas, K., O’Sullivan, E., Raychaudhury, S., et al. 2018, MNRAS, 481, 1550
- Kolokythas et al. (2019) Kolokythas, K., O’Sullivan, E., Intema, H., et al. 2019, MNRAS, 489, 2488
- Lacey & Cole (1993) Lacey, C., & Cole, S. 1993, MNRAS, 262, 627
- Lakhchaura et al. (2018) Lakhchaura, K., Werner, N., Sun, M., et al. 2018, MNRAS, 481, 4472
- Lang et al. (2010) Lang, D., Hogg, D. W., Mierle, K., et al. 2010, AJ, 139, 1782
- Larson, & Tinsley (1978) Larson, R. B., & Tinsley, B. M. 1978, ApJ, 219, 46
- Law et al. (2015) Law, D. R., Yan, R., Bershady, M. A., et al. 2015, AJ, 150, 19
- Law et al. (2016) Law, D. R., Cherinka, B., Yan, R., et al. 2016, AJ, 152, 83
- Lee & Chung (2018) Lee, B., & Chung, A. 2018, ApJ, 866, L10
- Leung et al. (2019) Leung, G. C. K., Coil, A. L., Aird, J., et al. 2019, ApJ, 886, 11
- Li et al. (2018) Li, Y., Ruszkowski, M., & Tremblay, G. 2018, ApJ, 854, 91
- Li et al. (2019) Li, H., Wuyts, S., Lei, H., et al. 2019, ApJ, 872, 63
- Lin et al. (2017) Lin, L., Lin, J.-H., Hsu, C.-H., et al. 2017, ApJ, 837, 32
- Lintott et al. (2009) Lintott, C. J., Schawinski, K., Keel, W., et al. 2009, MNRAS, 399, 129
- López-Cobá et al. (2019) López-Cobá, C., Sánchez, S. F., Bland-Hawthorn, J., et al. 2019, MNRAS, 482, 4032
- López-Cobá et al. (2020) López-Cobá, C., Sánchez, S. F., Anderson, J. P., et al. 2020, AJ, 159, 167
- Mantha et al. (2019) Mantha, K. B., McIntosh, D. H., Ciaschi, C. P., et al. 2019, MNRAS, 486, 2643
- Martel et al. (2004) Martel, A. R., Ford, H. C., Bradley, L. D., et al. 2004, AJ, 128, 2758
- Matthews et al. (2005) Matthews, L. D., Gao, Y., Uson, J. M., et al. 2005, The Astronomical Journal, 129, 1849
- McCourt et al. (2015) McCourt, M., O’Leary, R. M., Madigan, A.-M., et al. 2015, MNRAS, 449, 2
- McDonald et al. (2012) McDonald, M., Wei, L. H., & Veilleux, S. 2012, ApJ, 755, L24
- McDonald et al. (2018) McDonald, M., Gaspari, M., McNamara, B. R., et al. 2018, ApJ, 858, 45
- McGaugh et al. (2017) McGaugh, S. S., Schombert, J. M., & Lelli, F. 2017, ApJ, 851, 22
- Mihos (2004) Mihos, J. C. 2004, Recycling Intergalactic and Interstellar Matter, 390
- Mittal et al. (2009) Mittal, R., Hudson, D. S., Reiprich, T. H., et al. 2009, A&A, 501, 835
- Moustakas et al. (2006) Moustakas, J., Kennicutt, R. C., & Tremonti, C. A. 2006, ApJ, 642, 775
- O’Dea et al. (2008) O’Dea, C. P., Baum, S. A., Privon, G., et al. 2008, ApJ, 681, 1035
- Oh et al. (2017) Oh, S., Greene, J. E., & Lackner, C. N. 2017, ApJ, 836, 115
- Olivares et al. (2019) Olivares, V., Salome, P., Combes, F., et al. 2019, A&A, 631, A22
- O’Neil et al. (2003) O’Neil, K., Schinnerer, E., & Hofner, P. 2003, The Astrophysical Journal, 588, 230
- O’Sullivan et al. (2017) O’Sullivan, E., Ponman, T. J., Kolokythas, K., et al. 2017, MNRAS, 472, 1482
- O’Sullivan et al. (2019) O’Sullivan, E., Schellenberger, G., Burke, D. J., et al. 2019, MNRAS, 488, 2925
- Pan et al. (2018) Pan, H.-A., Lin, L., Hsieh, B.-C., et al. 2018, ApJ, 854, 159
- Pandge et al. (2012) Pandge, M. B., Vagshette, N. D., David, L. P., et al. 2012, MNRAS, 421, 808
- Peng et al. (2010) Peng, C. Y., Ho, L. C., Impey, C. D., et al. 2010, AJ, 139, 2097
- Poggianti et al. (2017) Poggianti, B. M., Moretti, A., Gullieuszik, M., et al. 2017, ApJ, 844, 48
- Prescott et al. (2009) Prescott, M., Baldry, I. K., & James, P. A. 2009, MNRAS, 397, 90
- Pulido et al. (2018) Pulido, F. A., McNamara, B. R., Edge, A. C., et al. 2018, ApJ, 853, 177
- Rafferty et al. (2008) Rafferty, D. A., McNamara, B. R., & Nulsen, P. E. J. 2008, ApJ, 687, 899
- Rahman et al. (2011) Rahman, N., Bolatto, A. D., Wong, T., et al. 2011, ApJ, 730, 72
- Roberts-Borsani (2020) Roberts-Borsani, G. W. 2020, MNRAS, 494, 4266
- Robitaille, & Bressert (2012) Robitaille, T., & Bressert, E. 2012, APLpy: Astronomical Plotting Library in Python, ascl:1208.017
- Rubin et al. (2018) Rubin, D., Hayden, B., Huang, X., et al. 2018, ApJ, 866, 65
- Russell et al. (2019) Russell, H. R., McNamara, B. R., Fabian, A. C., et al. 2019, MNRAS, 490, 3025
- Saintonge et al. (2017) Saintonge, A., Catinella, B., Tacconi, L. J., et al. 2017, ApJS, 233, 22
- Salomé, & Combes (2003) Salomé, P., & Combes, F. 2003, A&A, 412, 657
- Salomé et al. (2006) Salomé, P., Combes, F., Edge, A. C., et al. 2006, A&A, 454, 437
- Salomé et al. (2008) Salomé, P., Combes, F., Revaz, Y., et al. 2008, A&A, 484, 317
- Sánchez et al. (2012) Sánchez, S. F., Kennicutt, R. C., Gil de Paz, A., et al. 2012, A&A, 538, A8
- Sánchez et al. (2016a) Sánchez, S. F., Pérez, E., Sánchez-Blázquez, P., et al. 2016, Rev. Mexicana Astron. Astrofis., 52, 21
- Sánchez et al. (2016b) Sánchez, S. F., Pérez, E., Sánchez-Blázquez, P., et al. 2016, Rev. Mexicana Astron. Astrofis., 52, 171
- Sánchez et al. (2018) Sánchez, S. F., Avila-Reese, V., Hernandez-Toledo, H., et al. 2018, Rev. Mexicana Astron. Astrofis., 54, 217
- Schellenberger et al. (2020) Schellenberger, G., David, L. P., Vrtilek, J., et al. 2020, ApJ, 894, 72
- Silk, & Rees (1998) Silk, J., & Rees, M. J. 1998, A&A, 331, L1
- Singh et al. (2013) Singh, R., van de Ven, G., Jahnke, K., et al. 2013, A&A, 558, A43
- Sitnik et al. (2015) Sitnik, T. G., Egorov, O. V., Lozinskaya, T. A., et al. 2015, MNRAS, 454, 2486
- Springel et al. (2005) Springel, V., Di Matteo, T., & Hernquist, L. 2005, ApJ, 620, L79
- Steinhauser et al. (2012) Steinhauser, D., Haider, M., Kapferer, W., et al. 2012, A&A, 544, A54
- Steinhauser et al. (2016) Steinhauser, D., Schindler, S., & Springel, V. 2016, A&A, 591, A51
- Strateva et al. (2001) Strateva, I., Ivezić, Ž., Knapp, G. R., et al. 2001, AJ, 122, 1861
- Struck & Smith (2012) Struck, C., & Smith, B. J. 2012, MNRAS, 422, 2444
- Tal et al. (2009) Tal, T., van Dokkum, P. G., Nelan, J., et al. 2009, AJ, 138, 1417
- Taylor et al. (2015) Taylor, E. N., Hopkins, A. M., Baldry, I. K., et al. 2015, MNRAS, 446, 2144
- Temi et al. (2018) Temi, P., Amblard, A., Gitti, M., et al. 2018, ApJ, 858, 17
- Tody (1986) Tody, D. 1986, Proc. SPIE, 627, 733
- Tody (1993) Tody, D. 1993, Astronomical Data Analysis Software and Systems II, 52, 173
- Urry & Padovani (1995) Urry, C. M., & Padovani, P. 1995, PASP, 107, 803
- van Dokkum et al. (2015) van Dokkum, P. G., Abraham, R., Merritt, A., et al. 2015, The Astrophysical Journal, 798, L45
- Vantyghem et al. (2017) Vantyghem, A. N., McNamara, B. R., Edge, A. C., et al. 2017, ApJ, 848, 101
- Vogt et al. (2013) Vogt, F. P. A., Dopita, M. A., & Kewley, L. J. 2013, ApJ, 768, 151
- Wake et al. (2017) Wake, D. A., Bundy, K., Diamond-Stanic, A. M., et al. 2017, AJ, 154, 86
- Wang et al. (2019) Wang, Y., Lui, F., Shen, Z., et al. 2019, ApJ, 870, 132
- Watkins et al. (2018) Watkins, A. E., Mihos, J. C., Bershady, M., et al. 2018, ApJ, 858, L16
- Westfall et al. (2019) Westfall, K. B., Cappellari, M., Bershady, M. A., et al. 2019, arXiv:1901.00856
- Whitaker et al. (2012) Whitaker, K. E., van Dokkum, P. G., Brammer, G., et al. 2012, ApJ, 754, L29
- Yozin, & Bekki (2015) Yozin, C., & Bekki, K. 2015, Monthly Notices of the Royal Astronomical Society, 452, 937
- Zhou et al. (2017) Zhou, Z., Zhou, X., Wu, H., et al. 2017, ApJ, 835, 70