The H line emission of the Be star Psc: the last 40 years
Abstrakt
A study on the photosphere and disc of the Be star Psc is presented. We recover almost 40 years of high-resolution spectroscopic observations and additional data gathered from the BeSS database. We evaluate the photospheric parameters from the SED and fittings of state-of-the-art non-LTE model atmospheres to observed helium, carbon, silicon and magnesium line profiles. Our models include the stellar geometric deformation as well as the co-latitude dependence of temperature and gravity, aiming to derive the effects of rotation on the stellar parameters. We estimate the circumstellar disc parameters from the fitting of models assuming different disc properties, namely its radius and gas density profile. The disc inclination angle is constrained from the fittings of He i 4471 Å, Mg ii 4481 Å, C ii 4267 Å and Si ii 4128, 4132 Å lines with gravity darkened models. Our findings, based on model fittings, suggest that during the last 40 years the disc radius changed within the interval , the disc base gas density within g cm-3, while the radial power-law density index assumed values between 2.0 and 2.3. These results are in agreement with recent works dealing with spectroscopic and interferometric measurements of this object.
keywords:
stars: emission-line, Be – stars: fundamental parameters – stars: circumstellar matter – radiative transfer – line: profiles – techniques: spectroscopic1 Introduction
The emission-line B stars, assigned as Be stars, are in general main-sequence stars manifesting Balmer emission lines, sometimes associated to the occurrence of metal emission lines. Many studies today interpret these emission lines as being formed in circumstellar thin decretion discs in Keplerian motion around the central star (Rivinius et al., 2013; Rímulo et al., 2018; de Almeida et al., 2020).
Many models of the circumstellar environment, assuming different geometries, were proposed to explain the observed emission profiles and fluxes (Marlborough, 1969; Huang, 1972; Horne & Marsh, 1986; Cidale & Ringuelet, 1989; Bjorkman & Cassinelli, 1993; Hummel & Vrancken, 2000). The line emission varies over a broad time-scale range, which adds to conceal the dynamics of the decretion disc. Models of the disc suggest a vast parameter space even during quiescent states (Suffak et al., 2020).
In this work, we study Psc (HR 8773, HD 217891), a bright Be star () that we classify as a B6Ve object (Levenhagen & Leister, 2004, 2006). Its H emission profile is bottle-shaped, and its intensity changes cyclically over the years (Abt et al., 2002; Zorec et al., 2005; Jones et al., 2011; Catanzaro, 2013).
Recently, Wang et al. (2018) investigated the nature and origin of the rapid rotation of Be stars. It becomes more and more accepted that some Be stars acquired their high rotation speeds through the mechanism of mass transfer in a close binary system (Meynet, 2008). In this scenario, the primary star accretes from a secondary star mass donor which end as a hot, stripped-down object. In this case, the system could be eventually identified as a Be+sdO binary. Wang et al. (2018) included Psc in their study but they did not detect a possible hot companion through cross-correlation analysis of its UV spectra against hot stellar templates.
Previous studies reveal substantial variations in the H line flux with respect to the local continuum along months/years, as well as long and short-term line profile variability (Slettebak & Reynolds, 1978; Andrillat & Fehrenbach, 1982; Hanuschik et al., 1988; Hanuschik et al., 1996; Stefl et al., 2009). However, the physical properties of the circumstellar disc of this object and their correlation with variations in the H profile remain unknown.
Here we present the results of the analysis of high dispersion spectroscopic (ESO/FEROS) observations and extensive synoptic data gathered from the literature. In Section 2, we present detailed information on the photometric and spectroscopic data. In Section 3 the physical parameters of the central star are estimated assuming that rapid rotation causes the flattening of the stellar poles and enlargement at the equator and as a consequence a colatitude-dependent temperature distribution (von Zeipel, 1924a, b). In Section 4, we model the H line profiles aiming to estimate the basic parameters of the circumstellar environment for each observing epoch, namely the disc radius and gas density distribution. We discuss the results obtained in our analysis in Section 5 and the conclusion is shown in Section 6.
2 Observational Data
The photometry data handled in this work come from several sources. We exploited Johnson’s 11-color photometry data by Ducati (2002)111https://cdsarc.unistra.fr/viz-bin/cat/II/237, 2MASS photometry by Skrutskie et al. (2006), 13-colour photometry by Johnson & Mitchell (1975) and Gaia DR2 photometry (Gaia Collaboration et al., 2016, 2018). Also, additional photometry data by Straatman et al. (2016), Gudennavar et al. (2012), Kervella et al. (2019), Kharchenko (2001) and Morel & Magnenat (1978) were employed.
We observed the star Psc during six nights, from 2001/Aug/02 to 2001/Oct/09 using the FEROS spectrograph (Kaufer et al., 1999) attached to the European Southern Observatory (ESO) 1.52 m telescope at La Silla (Chile). Figure 1 shows the H line profiles for each night of the run. Given that the H peak intensity and profile remained nearly constant along time-scales of several hours, we analyzed only the first spectrum of the observing night as representative of the profile’s intensity for that night. Table 1 shows the leading information on these data.
It is worth noticing that even during the whole six nights, the peak intensity remained almost constant. The FEROS spectrograph sampled the optical spectrum from 3700 Å to 9000 Å, with a resolving power R and a typical continuum signal-to-noise ratio of . The simple optical setup has two fibres with 2”.7 apertures, aimed to record simultaneously the incoming stellar flux and sky background. The detector is a back-illuminated CCD with 2948 X 4096 pixels, with 15 m pixel size.
The data reduction followed standard procedures, with bias and scattered light subtraction, Echelle orders extraction, flatfielding, and wavelength calibration. We also performed the correction to the local standard of rest and continuum normalization with low-order polynomials. We conveyed data reduction with IRAF222IRAF is a data reduction facility that was distributed by NOAO, administrated by the Association of Universities for Research in Astronomy (AURA), Inc., under a cooperative agreement with the National Science Foundation package.
Besides the FEROS spectroscopic observations, we also analysed the spectroscopic data from the Be Star Spectra Database (BeSS)/ELODIE (Moultaka et al., 2004; Neiner et al., 2011) containing spectra taken in four epochs at the OHP. Observing data by several other authors in the literature were also included, as shown in Table 1 and in Figure 1. Also, a team of amateur astronomers 333We thank Valerie Desnoux, Arnold de Bruin, André Favaro, Alun Halsey, Anton Heidemann, Christian Buil, Olivier Thizy, Michel Pujol, Carl Sawicki, Erik Bryssinck, Ernst Pollmann, Joan Guarro Fló, Jean-Noël Terry, Michel Bonnement, Marco Leonardi, Olivier Garde, Alain Lopez, Pierre Dubreuil, Robert Buchheim, Stéphane Ubaud, Thierry Garrel, Thierry Lemoult observed and provided 103 spectra in the BeSS database. We used these spectra to evaluate H equivalent widths and peak strengths. The BeSS database is an online catalogue that receives spectroscopic data continuously, aiming to include all known Be stars.
| Date | No of spectra | MJD | Resolving power | Wavelength coverage (nm) | Instrument | Source | Reference code |
|---|---|---|---|---|---|---|---|
| 2001/Aug/02 | 15 | 52124 | 48,000 | 370 - 900 | FEROS/1.52m ESO La Silla | this work | FE2001-1 |
| 2001/Aug/05 | 23 | 52127 | 48,000 | 370 - 900 | FEROS/1.52m ESO La Silla | this work | FE2001-2 |
| 2001/Aug/06 | 15 | 52128 | 48,000 | 370 - 900 | FEROS/1.52m ESO La Silla | this work | FE2001-3 |
| 2001/Oct/07 | 12 | 52190 | 48,000 | 370 - 900 | FEROS/1.52m ESO La Silla | this work | FE2001-4 |
| 2001/Oct/08 | 15 | 52191 | 48,000 | 370 - 900 | FEROS/1.52m ESO La Silla | this work | FE2001-5 |
| 2001/Oct/09 | 19 | 52192 | 48,000 | 370 - 900 | FEROS/1.52m ESO La Silla | this work | FE2001-6 |
| 1996/Sep/02 | 01 | 50328 | 45,000 | 389 - 681 | ELODIE/1.93m OHP | BeSS database | EL1996 |
| 2001/Dec/20 | 01 | 52263 | 45,000 | 389 - 681 | ELODIE/1.93m OHP | BeSS database | EL2001 |
| 2002/Nov/30 | 01 | 52608 | 45,000 | 389 - 681 | ELODIE/1.93m OHP | BeSS database | EL2002-1 |
| 2002/Dec/02 | 01 | 52610 | 45,000 | 389 - 681 | ELODIE/1.93m OHP | BeSS database | EL2002-2 |
| 1975/Dec/05 | 01 | 42751 | 2,200 | 655 - 657 | Photoelectric scanner/72inch Lowell Obs. | Slettebak & Reynolds (1978) | SR1975 |
| 1976/Nov/05 | 01 | 43087 | 2,200 | 655 - 657 | Photoelectric scanner/72inch Lowell Obs. | Slettebak & Reynolds (1978) | SR1976 |
| 1980/Dec/28 | 01 | 44601 | 10,000 | 644 - 668 | Echelle/1.52m OHP | Andrillat & Fehrenbach (1982) | AF1980 |
| 1982/Aug/16 | 01 | 45197 | 100,000 | 655 - 657 | Echelle/1.4m ESO La Silla | Hanuschik et al. (1988) | HA1982-1 |
| 1982/Aug/30 | 01 | 45211 | 100,000 | 653 - 659 | Echelle/1.4m ESO La Silla | Hanuschik et al. (1988) | HA1982-2 |
| 1989/Jan/06 | 01 | 47532 | 50,000 | 655 - 657 | Echelle/1.4m ESO La Silla | Hanuschik et al. (1996) | HA1989-1 |
| 1989/Sep/26 | 01 | 47795 | 50,000 | 655 - 657 | Echelle/1.4m ESO La Silla | Hanuschik et al. (1996) | HA1989-2 |
| 1993/Sep/09 | 01 | 49239 | 50,000 | 655 - 657 | Echelle/1.4m ESO La Silla | Hanuschik et al. (1996) | HA1993 |
| 1998/Nov/27 | 01 | 51144 | 13,000 | 655 - 658 | FLAGS/Mount Abu IR Observatory | Banerjee et al. (2000) | BA1998 |
| 2004/Jul/30 | 01 | 53216 | 20,000 | 345 - 862 | HEROS/2.0m Ondřejov | Saad et al. (2006) | SA2004 |
| 2007/Dec/18 | 01 | 54452 | 10,000 | 653 - 660 | Fiber-fed Echelle/42inch Lowell Obs. | Silaj et al. (2010) | SI2007 |
| 2008/Jul/31 | 01 | 54678 | 21,000 | 430 - 680 | FRESCO/91cm INAF-Catania | Catanzaro (2013) | CA2008-1 |
| 2008/Aug/03 | 01 | 54681 | 21,000 | 430 - 680 | FRESCO/91cm INAF-Catania | Catanzaro (2013) | CA2008-2 |
| 2008/Sep/04 | 01 | 54713 | 21,000 | 430 - 680 | FRESCO/91cm INAF-Catania | Catanzaro (2013) | CA2008-3 |
| 2008/Sep/05 | 01 | 54714 | 21,000 | 430 - 680 | FRESCO/91cm INAF-Catania | Catanzaro (2013) | CA2008-4 |
| 2008/Oct/07 | 01 | 54746 | 21,000 | 430 - 680 | FRESCO/91cm INAF-Catania | Catanzaro (2013) | CA2008-5 |

3 Photospheric parameters
We estimate the physical parameters of the stellar photosphere (Teff, , ) from both photometric measurements and optical spectra. Vizier2444https://vizier.u-strasbg.fr/viz-bin/VizieR (Ochsenbein et al., 2000) sourced the currently available photometric data. The fitting of observed broadband fluxes with model stellar atmospheres is useful to infer the first-order estimates of photospheric temperature and stellar radius, provided that reliable information on parallax is available.
Through our preliminary analysis by fitting a black-body, we have selected Johnson’s 11-color photometry data by Ducati (2002), 2MASS photometry by Skrutskie et al. (2006), 13-colour photometry by Johnson & Mitchell (1975) and Gaia DR2 photometry (Gaia Collaboration et al., 2016, 2018). Also, we used additional photometry data by Straatman et al. (2016), Gudennavar et al. (2012), Kervella et al. (2019), Kharchenko (2001) and Morel & Magnenat (1978). Unfortunately, most of the photometric measurements on this star come without uncertainty estimates.
Preliminary estimate of is derived from the Fourier transforms (Carroll, 1933; Gray, 2005) of helium line profiles in the spectra, considering the quadratic limb-darkening coefficients by Wade & Rucinski (1985).
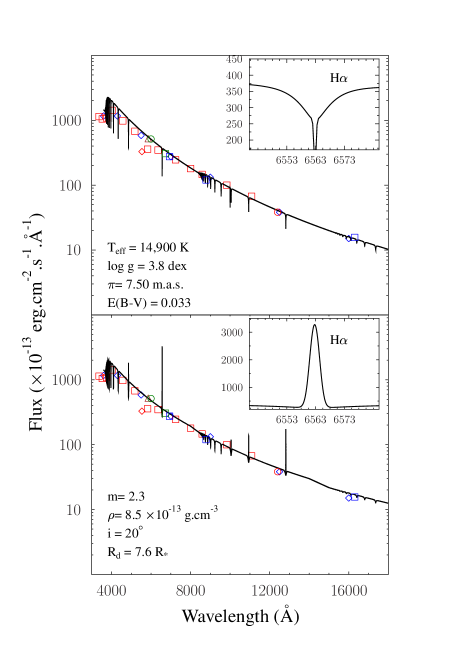
After this preliminary estimate of the physical state of the photosphere, described mainly by its effective temperature Teff, a more detailed parameter set is determined from the fittings of non-LTE models to the observed SED (Figure 2, top panel) (Levenhagen & Leister, 2004, 2006; Levenhagen & Künzel, 2011; Levenhagen et al., 2011, 2013a, 2013b). We synthesized non-LTE model spectra using the SYNSPEC v.51 FORTRAN code (Hubeny et al., 1994) covering the spectral range 3000 Å to 18000 Å from plane-parallel, non-LTE atmosphere models computed with TLUSTY v.205 (Hubeny, 1988). We used the wrapper SYNPLOT/IDL GUI (Hubeny, priv. comm.) to perform the whole synthesis procedure. Solar abundances from Grevesse & Sauval (1998) were considered for both atmosphere structure and spectral synthesis.
The synthetic fluxes were reddened assuming the A2 model published by Amôres & Lépine (2007) considering the star’s direction, yielding E(B-V) 0.033. This value is an agreement with those 0.031 and 0.027 obtained by Green et al. (2018) and Drimmel et al. (2003) as well as with the obtained one by Capitanio et al. (2017), e.g., E(B-V) .
Using the Cardelli et al. (1989) extinction curve, we applied the correction factor for all photometric bands from U to K. The maximum reddening correction along the analyzed SED is 16% at 3600Å being 9.5% at 5500Å.
When comparing to spherical SED models, the SED was also corrected for the effects of stellar geometrical deformation induced by rotation, hereafter geometrical flattening (GF). The main effect of rotation in a pole-on Be star is to increase the stellar brightening up to perhaps a half of magnitude (Townsend et al., 2004). In this work we inferred the correction assuming a bilinear interpolation of Mv (B-V) data (Townsend et al., 2004), which makes the star to increase its brightening by about 0.38 mag when compared to a spherical photosphere.
The flux fittings resulted in a parallax of m.a.s. that provides the best scaling factor (Figure 2). This value is consistent with the newest Gaia DR2 parallax of m.a.s. (Gaia Collaboration et al., 2016; Gaia Collaboration, 2016; Luri et al., 2018; Gaia Collaboration et al., 2018). The older estimate of m.a.s. by Perryman et al. (1997) push the fittings to slightly higher Teff values.
We performed the SED and spectroscopic fitting procedures with the help of a downhill simplex algorithm (Nelder & Mead, 1965) in the vicinity of the starting (Teff,,) values.
The goodness of fit was evaluated using the figure-of-merit criterion (FOM) by Balian & Eddy (1977):
| (1) |
where corresponds to the experimental data and to the fit. The FOM criterion improves on the uncertainty and fluctuations of the formula (Balian & Eddy, 1977). A FOM value lower than 2.5% points out a good fit irrespective of variations in line profile shapes and peak sizes (Balian & Eddy, 1977).
The evolutionary tracks by Schaller et al. (1992), were interpolated to estimate the stellar mass , the luminosity in log scale and the age in log scale fixing .
The best fit solution is achieved for Teff= K, = c.g.s. units and parallax m.a.s., with uncertainties following from the probability distributions built using the tabulated data. The complete set of parameters from the SED fitting, are shown in the left column of Table 2.
The high rotation velocities presented by Be stars, which lead the star to a non-spherical oblate shape (GF), also affects the observed line profiles in many ways. This rapidly rotating star has a polar radius that is significantly smaller than the equatorial one. This leads the atmosphere at the polar regions to receive more energy per unit area than near the equator (Collins, 1963; Roxburgh et al., 1965).
Deep into the star, the radiative flux is governed by the temperature gradient, which is related to a pressure difference among the inner layers. As the star remains in hydrostatic equilibrium, the pressure gradient is ruled by gravity, while the emerging flux is proportional to the local gravity at photosphere, as stated by Von Zeipel’s theorem.
The surface gravity is calculated throughout the star by evaluating the local gravitational potential gradient using the Roche approximation with the inclusion of an additional term for GF (Tassoul, 1978). In this approach, we neglect multipole terms in the polynomial expansion that arise from non-uniform mass distribution (Collins & Harrington, 1966). To build-up gravity-darkened (GD+GF) models, we employed the ZPEKTR code described in a previous work (Levenhagen, 2014). The computed GD models depart from normal non-LTE model spectra. The simulations consider the star as a rigid rotator obeying a Roche mass distribution and suppose that the stellar rotation does not influence its core. The models are characterized by a set of parameters, such as the surface temperature, radius and gravity taken at the poles and equator, the stellar mass, the stellar rotation rate , and the aspect angle .
Since Be star discs are situated along the equatorial plane, to associate the aspect angle i with the disc inclination is a reasonable assumption. For each model, we made a computational mesh of thousands of area elements at the stellar surface. Each element has its local parameters and (), where defines the local latitude, in agreement with the Von Zeipel’s expression (von Zeipel, 1924a, b; Lovekin et al., 2006). The local atmosphere structure and radiative transfer is again calculated in non-LTE using TLUSTY and SYNSPEC codes. The stellar spectrum is evaluated from the integration of the outgoing specific intensities coming from all visible elements in the line-of-sight. The whole set of model spectra is used as a base to fit the observed spectra with the Amoeba algorithm (Nelder & Mead, 1965).
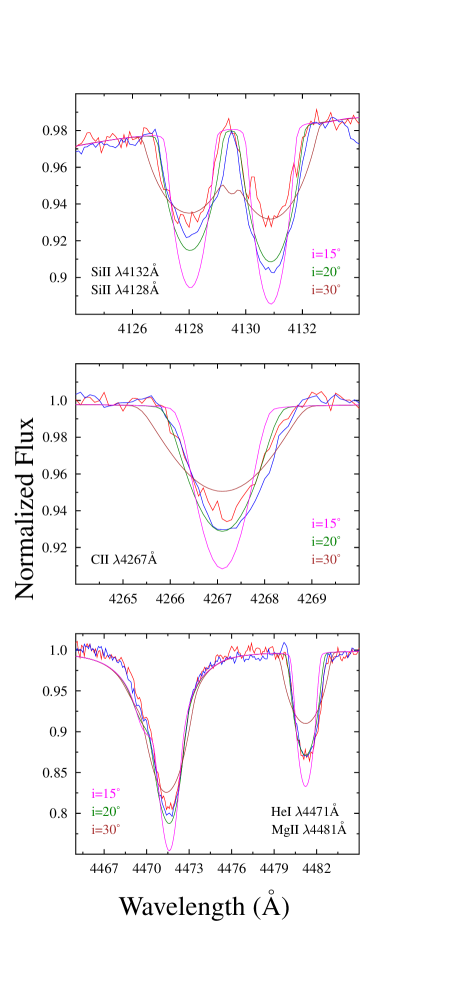
Figure 3 shows the best fits of Si ii 4128, 4131 Å, C ii 4267 Å, He i 4471 Å and Mg ii 4481 Å profiles with gravity-darkened synthetic spectra. The basic parameters derived from these profiles are given in the right column of Table 2. For comparison purposes, we present spectra computed considering ∘ and ∘ . From these fittings, it is possible to infer that the best choice for the aspect angle is a value near ∘ . As expected, the bottle-shaped, sharp H emission of Psc is only compatible with a small value. The aspect angle ∘ inferred from the fittings is perhaps close to its lower absolute limit, since values below ∘ would lead to a break-up scenario for this star, assuming typical parameters of a main sequence B6V star. The H emission suggests even lower angles, although ∘ would produce much deeper atmospheric profiles than those observed for most lines. These constraints on the inclination should be read with caution since they are limited by the assumption of stellar profile formation. It is difficult to precisely establish the value for from the absorption profile fitting since the Mg ii line appears to be filled in by the disc emission. This is possibly the case for the Si ii and C ii profiles as well, which may be filled in by different amounts.
| SED | Line profiles | ||
|---|---|---|---|
| Teff | K | Tpole | K |
| c.g.s. | Teq | K | |
| yr | Rp | ||
| Re | |||
| c.g.s. | |||
| c.g.s. | |||
| km s-1 | |||
| 20∘ 3∘ |
4 Line emission modelling
We modelled the emission-line profiles with a modified version of the SHELLSPEC v.39 code (Budaj & Richards, 2004), following the general outlines given in Hummel & Vrancken (2000), where the circumstellar environment is supposed to be described by an axisymmetric disc, using an exponential law for the vertical gas density distribution and a radial power-law gradient. Each gas voxel is orbiting the star at a radius with Keplerian velocity given by:
| (2) |
and a projected Doppler velocity shift:
| (3) |
where stands for the aspect angle ( for pole-on view) and the azimuth angle concerning the line-of-sight.
Since photons originate mostly in an optically thin disc region, the Keplerian shear along the line of sight increases the Doppler gradients. We adopt the geometrical prescription for the Doppler gradient from Horne & Marsh (1986):
| (4) |
where is the thickness of the emission layer.
We compute the H emission profiles by solving the line transfer equation, in LTE conditions, along the line-of-sight in the static transfer approximation. An optically thin recombination line emission prevails at the circumstellar disc medium density. The total absorption coefficient takes into account the H i bound-free opacity (Mihalas, 1978; Gray, 2005) and H i free-free opacity (Mihalas, 1978). A pure hydrogen disc is assumed to model the Balmer lines. Thomson (Mihalas, 1978) and Rayleigh (Kurucz, 1970) processes contribute to the total scattering. The total emission coefficient is considered as the sum of the thermal emissivity, computed in LTE, and the scattering emissivity. The monochromatic optical depth is given by (Hummel & Vrancken, 2000):
| (5) |
where stands for the quantum oscillator strength, is the gas density distribution, and the resulting velocity field depends on the thermal broadening, the shear velocity and the disc expansion velocity, assuming a radial temperature profile (Stee & de Araujo, 1994):
| (6) |
We compute the emergent flux from the integration, over the solid angle, of the outcoming specific intensities from each pixel. At each pixel we evaluate the local physical variables (such as the gas density, the thermal profile, the Keplerian and expanding velocities) and after that we integrate the optical depths for each frequency point. The solution of the radiative transfer equation, reads:
| (7) |
where is the incident intensity of the radiation in a layer with optical depth . The monochromatic flux is and the circumstellar material is assumed to be distributed along a thin disc with inner radius and outer radius with inclination angle . The gas density follows a radial power-law depending on the distance from the disc inner radius and height from the disc midplane (Hummel & Vrancken, 2000):
| (8) |
where is the power-law index for the radial gradient, is the reference gas density and is the disc scale height, which is a function of the disc radius, speed of sound and local disc velocity, given by (Hummel & Vrancken, 2000):
| (9) |
where follows from the mass and momentum conservation expressions and the gas state equation:
| (10) |
where stands for the disc temperature, is the universal gas constant and is the adiabatic expansion constant for mono-atomic gases. Through the whole fitting process, we fix the disc inclination angle as obtained in the gravity-darkened line profile models, and vary the base gas density , the power-law index and the disc radius. Our modelling portrays a first-order approximation for the emission line profile, providing constraints on the proposed disc parameters. A self-consistent description of the disc temperature and density structure is needed to accurately model the profiles.
5 Discussion
The fitting of photometric fluxes and observed stellar spectra with non-LTE models constrain the stellar parameters to Teff K, c.g.s. units and km s-1, which is compatible with a B6Ve spectral classification (Figure 2).
This result is in agreement with other studies on this object. Theodossiou & Danezis (1991) provide Teff= K, while Slettebak & Reynolds (1978) and Hanuschik et al. (1996) suggest = 100 km s-1.
Higher Teff estimates were considered by Arcos et al. (2018), who derived Teff = K, = c.g.s. units, = km s-1and assigned a B4V spectral type. Their parameters were derived by the fitting of non-LTE model spectra to He i 4471 Å and Mg ii 4481 Å, with a best fit reduced of 22.6.
Lower temperature and gravity values were reported by Frémat et al. (2005), who estimated Teff K, = c.g.s. units and = km s-1as the apparent parameters (i.e. neglecting rotation effects) of the star, also derived by the fitting of non-LTE spectra. The different set of parameters found for this object in the literature could arise from several reasons, ranging from the accuracy of the stellar atmospheres models (e.g. number of ions, number of explicit levels, among other parameters) to the actual disc activity status. In high active phases, the disc emission can distort the line profiles and change its core depth, FWHM and wings, even for He i profiles.
Assuming rigid rotation and taking into account gravity darkening effects, the best fitting model has pole temperature Tpole= 15556 K, equator temperature Teq= 13476 K, pole gravity = 3.99 and equator gravity = 3.74 c.g.s. units (Figure 3) with a figure-of-merit 0.64% (Balian & Eddy, 1977).
This calculated FOM value shows that the observed and fitted data are in good agreement. The best-fitting model has an aspect angle ∘ and leads, for a B6 star, to a equatorial velocity km s-1assuming = 90 km/s.
This value is well below the critical limit of km/s for a B6 object (Porter, 1996; Townsend et al., 2004), in agreement with Jones et al. (2008). Lower values are reported by Catanzaro (2013) with ∘ and = 75 km/s, implying a critical km/s.
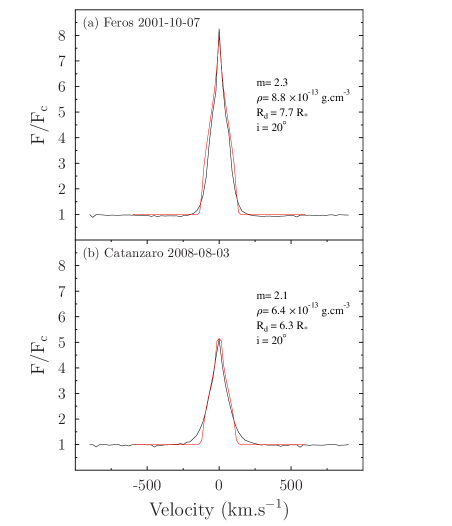
Two representative H line profiles and their fittings are presented in Figure 4 as an example of higher and lower emission phases of Psc. The spectra was normalized by the local continuum. In this figure, we display the model spectra in red. These spectra observed in 2001 and 2008 were selected for fitting our modified SHELLSPEC models assuming , 10∘ 50∘ and g cm-3. The overall line profile fittings are good, except the H wings that are not always well described by the model disc emission (Figure 4, lower panel). We can see significant emission in the H line wings well beyond the maximum expected Keplerian velocity. Such extra emission may be due to scattering of emission line photons in a low-density hot circumstellar gas.
The base gas density in the stellar disc varied within g cm-3and the radial exponent , adopting ∘ . The external disc radius changed from 7.7to 6.3, reflecting variations in mass loss or even viscous processes in the disc.
Besides our FEROS data, several authors observed the H line profiles of Psc with different instrumentation (Slettebak & Reynolds, 1978; Andrillat & Fehrenbach, 1982; Hanuschik et al., 1988; Hanuschik et al., 1996; Banerjee et al., 2000; Saad et al., 2006; Silaj et al., 2010) and recently, many amateur astronomers contributing to the BeSS database. The whole set of observations are not uniformly sampled in time. Over the last 40 years, one can see many gaps of months or years, which harm periodicity estimations. The H emission profiles always remain bottle-shaped, but their peak strengths and equivalent widths changed over the last 40 years (Figure 5). From this figure, it is possible to see only one interval with a suitable time sample to draw a disc feeding scenario, from the end of 2008 until 2010, with the shape of an ascending ramp. From that, we could probe a short time scale of a few months required to feed the disc. It is worth noticing that the equivalent widths vary between 10 and 20 Å with some correlation between equivalent widths and peak strengths, in particular during the transition to brighter line emission in 2006.
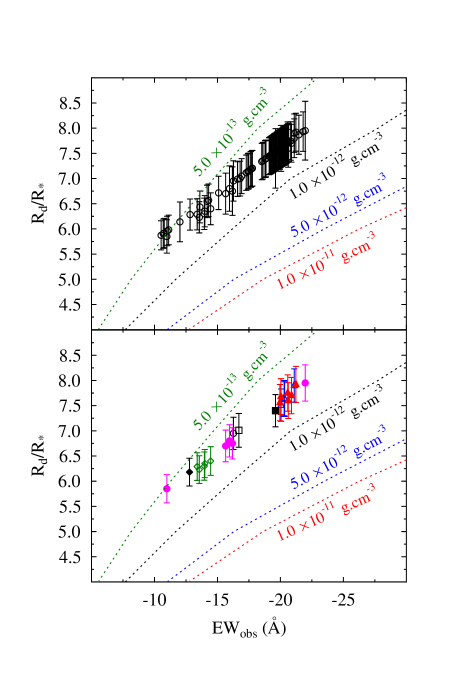
These archival data allow the investigation of basic disc parameters over a long time frame. In Figure 6, we show the range of disc radii as a function of equivalent widths for all data (top panel) and excluding the lower resolution amateur data (bottom panel). We found a good agreement between those data sets. Theoretical models with different gas densities g cm-3are displayed in both plots. We see that, in both plots, the whole data set fits between 5.5 and 7.8 . Also, the data indicate a gas density region between g cm-3and g cm-3.
The gas densities found in this work are in overall agreement with the values found in the literature. A lower limit of g cm-3 was obtained by Catanzaro (2013) while in the upper tail a value of g cm-3, with ∘ and was found by Jones et al. (2008) and Silaj et al. (2010) using interferometric observations.
The dip seen in Figure 5, both in EW and peak height time series near MJD 54000, and in Figure 7 would suggest the occurrence of stellar brightening changes, maybe due to recent ejected material very close to the star, scattering more light to the observer. However, by inspecting the Hipparcos light curves we see that the photometry data changed only 0.03 mag during the whole mission. As the Hipparcos photometric band is large, it is mainly dominated by the continuum. So, the variability we see in peak height and EW is perhaps produced mainly by the line and not by the continuum. To mimic this stellar brightening effect, we artificially added and subtracted a factor of 0.03 mag from the continuum and re-normalized the spectra. In this case, small changes of around 1.3% in gas density and 1.2% in the stellar disc radius are obtained. Supposing, on the contrary, an upper limit case with around 0.25 mag of variation in the continuum, which is the order of magnitude seen in recent photometry by amateurs in the AAVSO database, we would have a fluctuation of about 5% in the disc radius and 12% in the gas density. Nevertheless, these data are heterogeneous and may contain non-intrinsic RMS contributions at that level. Roughly one magnitude continuum brightening would be required to produce the observed dip in the normalized line peak. However, further indication of relative continuum stability regarding the EWs and peak strengths may be found in ASAS-3 (Pojmanski et al., 2005) V-band light curve, where broadband variations below 0.2 mag on this particular time-scale are seen during the dip.


6 Conclusion
We present the analysis of a comprehensive H line profile data set of the Be star Psc. Physical parameters of the stellar photosphere are estimated using both photometry data from the literature and fittings of line profiles with non-LTE stellar atmospheres models with geometric flattening and gravity darkening. We derive a disc inclination of . Lower values showed worse fittings of C ii, Si ii, He i 4471 Å and Mg ii 4481 Å line profiles and yield equatorial velocities higher than the critical velocity.
Observing the whole H EW and peak strength data sets, due to the unevenly-spaced time sampling, it was not possible to find periodicities in the disc activity. However, the observed line emission variations suggest that the disc feeding occurs on timescales of a few months. Simultaneous photometric data suggests that most of large EW variations are due to the line emission.
Our fittings of H with disc models point out that the disc changed its geometrical extent, over the last 40 years, ranging between 5.5 to 7.8 . The mean base gas density is estimated around g cm-3 and its radial profile is described by a power-law with index between and . The model parameters derived from the optical spectra in this work are in reasonable agreement with the values proposed in previous works on this object (Jones et al., 2008; Catanzaro, 2013).
Acknowledgements
The authors are grateful to Ivan Hubeny for his valuable advice with the codes SYNSPEC and TLUSTY, and also to Dr. Ján Budaj for his assistance with the SHELLSPEC code. The authors want to acknowledge an anonymous reviewer for valuable comments and suggestions which helped to improve this work. This research handled data from the European Space Agency (ESA) mission Gaia (https://www.cosmos.esa.int/gaia), processed by the Gaia Data Processing and Analysis Consortium (DPAC, https://www.cosmos.esa.int/web/gaia/dpac/consortium). Funding for the DPAC has been provided by national institutions, in particular, the institutions participating in the Gaia Multilateral Agreement. This publication made use of data products from the Two Micron All Sky Survey, which is a joint project of the University of Massachusetts and the Infrared Processing and Analysis Center/California Institute of Technology, funded by the National Aeronautics and Space Administration and the National Science Foundation. This work has made use of the BeSS database, operated at LESIA, Observatoire de Meudon, France: http://basebe.obspm.fr. The CNPq (Conselho Nacional de Desenvolvimento Científico e Tecnológico) supported this research through grants 307095/2008-8 and 307660/2011-7. FAPESP (Fundação de Amparo à Pesquisa do Estado de São Paulo) supported this research through grant no. 2010/06816-4. The FEROS observations at the European Southern Observatory (ESO) were carried out within the Observatório Nacional ON/ESO and ON/IAG agreements, under FAPESP project 1998/10138-8.
Data availability
The data underlying this article will be shared on reasonable request to the corresponding author.
Reference
- Abt et al. (2002) Abt H. A., Levato H., Grosso M., 2002, ApJ, 573, 359
- Amôres & Lépine (2007) Amôres E. B., Lépine J. R. D., 2007, AJ, 133, 1519
- Andrillat & Fehrenbach (1982) Andrillat Y., Fehrenbach C., 1982, A&AS, 48, 93
- Arcos et al. (2018) Arcos C., Kanaan S., Chávez J., Vanzi L., Araya I., Curé M., 2018, MNRAS, 474, 5287
- Balian & Eddy (1977) Balian H. G., Eddy N. W., 1977, Nuclear Instruments and Methods, 145, 389
- Banerjee et al. (2000) Banerjee D. P. K., Rawat S. D., Janardhan P., 2000, A&AS, 147, 229
- Bjorkman & Cassinelli (1993) Bjorkman J. E., Cassinelli J. P., 1993, ApJ, 409, 429
- Budaj & Richards (2004) Budaj J., Richards M. T., 2004, Contributions of the Astronomical Observatory Skalnate Pleso, 34, 167
- Capitanio et al. (2017) Capitanio L., Lallement R., Vergely J. L., Elyajouri M., Monreal-Ibero A., 2017, A&A, 606, A65
- Cardelli et al. (1989) Cardelli J. A., Clayton G. C., Mathis J. S., 1989, ApJ, 345, 245
- Carroll (1933) Carroll J. A., 1933, MNRAS, 93, 478
- Catanzaro (2013) Catanzaro G., 2013, A&A, 550, A79
- Cidale & Ringuelet (1989) Cidale L. S., Ringuelet A. E., 1989, PASP, 101, 417
- Collins (1963) Collins George W. I., 1963, ApJ, 138, 1134
- Collins & Harrington (1966) Collins George W. I., Harrington J. P., 1966, ApJ, 146, 152
- de Almeida et al. (2020) de Almeida E. S. G. d., et al., 2020, A&A, 636, A110
- Drimmel et al. (2003) Drimmel R., Cabrera-Lavers A., López-Corredoira M., 2003, A&A, 409, 205
- Ducati (2002) Ducati J. R., 2002, VizieR Online Data Catalog,
- Frémat et al. (2005) Frémat Y., Zorec J., Hubert A. M., Floquet M., 2005, A&A, 440, 305
- Gaia Collaboration (2016) Gaia Collaboration 2016, VizieR Online Data Catalog, p. I/337
- Gaia Collaboration et al. (2016) Gaia Collaboration et al., 2016, A&A, 595, A2
- Gaia Collaboration et al. (2018) Gaia Collaboration et al., 2018, A&A, 616, A1
- Gray (2005) Gray D. F., 2005, The Observation and Analysis of Stellar Photospheres. Cambridge University Press
- Green et al. (2018) Green G. M., et al., 2018, MNRAS, 478, 651
- Grevesse & Sauval (1998) Grevesse N., Sauval A. J., 1998, Space Sci. Rev., 85, 161
- Gudennavar et al. (2012) Gudennavar S. B., Bubbly S. G., Preethi K., Murthy J., 2012, ApJS, 199, 8
- Hanuschik et al. (1988) Hanuschik R. W., Kozok J. R., Kaiser D., 1988, A&A, 189, 147
- Hanuschik et al. (1996) Hanuschik R. W., Hummel W., Sutorius E., Dietle O., Thimm G., 1996, A&AS, 116, 309
- Horne & Marsh (1986) Horne K., Marsh T. R., 1986, MNRAS, 218, 761
- Huang (1972) Huang S.-S., 1972, ApJ, 171, 549
- Hubeny (1988) Hubeny I., 1988, Computer Physics Communications, 52, 103
- Hubeny et al. (1994) Hubeny I., Hummer D. G., Lanz T., 1994, A&A, 282, 151
- Hummel & Vrancken (2000) Hummel W., Vrancken M., 2000, A&A, 359, 1075
- Johnson & Mitchell (1975) Johnson H. L., Mitchell R. I., 1975, Rev. Mex. Astron. Astrofis., 1, 299
- Jones et al. (2008) Jones C. E., Tycner C., Sigut T. A. A., Benson J. A., Hutter D. J., 2008, ApJ, 687, 598
- Jones et al. (2011) Jones C. E., Tycner C., Smith A. D., 2011, AJ, 141, 150
- Kaufer et al. (1999) Kaufer A., Stahl O., Tubbesing S., Nørregaard P., Avila G., Francois P., Pasquini L., Pizzella A., 1999, The Messenger, 95, 8
- Kervella et al. (2019) Kervella P., Arenou F., Mignard F., Thévenin F., 2019, A&A, 623, A72
- Kharchenko (2001) Kharchenko N. V., 2001, Kinematika i Fizika Nebesnykh Tel, 17, 409
- Kurucz (1970) Kurucz R. L., 1970, SAO Special Report, 309
- Levenhagen (2014) Levenhagen R. S., 2014, ApJ, 797, 29
- Levenhagen & Künzel (2011) Levenhagen R. S., Künzel R., 2011, New Astron., 16, 307
- Levenhagen & Leister (2004) Levenhagen R. S., Leister N. V., 2004, AJ, 127, 1176
- Levenhagen & Leister (2006) Levenhagen R. S., Leister N. V., 2006, MNRAS, 371, 252
- Levenhagen et al. (2011) Levenhagen R. S., Leister N. V., Künzel R., 2011, A&A, 533, A75
- Levenhagen et al. (2013a) Levenhagen R. S., Künzel R., Leister N. V., 2013a, New Astron., 18, 55
- Levenhagen et al. (2013b) Levenhagen R. S., Künzel R., Leister N. V., 2013b, New Astron., 21, 27
- Lovekin et al. (2006) Lovekin C. C., Deupree R. G., Short C. I., 2006, ApJ, 643, 460
- Luri et al. (2018) Luri X., et al., 2018, A&A, 616, A9
- Marlborough (1969) Marlborough J. M., 1969, ApJ, 156, 135
- Meynet (2008) Meynet G., 2008, in Charbonnel C., Zahn J. P., eds, EAS Publications Series Vol. 32, EAS Publications Series. pp 187–232 (arXiv:0708.3185), doi:10.1051/eas:0832006
- Mihalas (1978) Mihalas D., 1978, Stellar atmospheres. W H Freeman & Co.
- Morel & Magnenat (1978) Morel M., Magnenat P., 1978, A&AS, 34, 477
- Moultaka et al. (2004) Moultaka J., Ilovaisky S. A., Prugniel P., Soubiran C., 2004, PASP, 116, 693
- Neiner et al. (2011) Neiner C., de Batz B., Cochard F., Floquet M., Mekkas A., Desnoux V., 2011, AJ, 142, 149
- Nelder & Mead (1965) Nelder J. A., Mead R., 1965, Computer Journal, 7, 308
- Ochsenbein et al. (2000) Ochsenbein F., Bauer P., Marcout J., 2000, A&AS, 143, 23
- Perryman et al. (1997) Perryman M. A. C., et al., 1997, A&A, 323, 49
- Pojmanski et al. (2005) Pojmanski G., Pilecki B., Szczygiel D., 2005, Acta Astron., 55, 275
- Porter (1996) Porter J. M., 1996, MNRAS, 280, L31
- Rímulo et al. (2018) Rímulo L. R., et al., 2018, MNRAS, 476, 3555
- Rivinius et al. (2013) Rivinius T., Carciofi A. C., Martayan C., 2013, A&ARv, 21, 69
- Roxburgh et al. (1965) Roxburgh I. W., Griffith J. S., Sweet P. A., 1965, Z. Astrophys., 61, 203
- Saad et al. (2006) Saad S. M., et al., 2006, A&A, 450, 427
- Schaller et al. (1992) Schaller G., Schaerer D., Meynet G., Maeder A., 1992, A&AS, 96, 269
- Silaj et al. (2010) Silaj J., Jones C. E., Tycner C., Sigut T. A. A., Smith A. D., 2010, ApJS, 187, 228
- Skrutskie et al. (2006) Skrutskie M. F., et al., 2006, AJ, 131, 1163
- Slettebak & Reynolds (1978) Slettebak A., Reynolds R. C., 1978, ApJS, 38, 205
- Stee & de Araujo (1994) Stee P., de Araujo F. X., 1994, A&A, 292, 221
- Stefl et al. (2009) Stefl S., et al., 2009, A&A, 504, 929
- Straatman et al. (2016) Straatman C. M. S., et al., 2016, ApJ, 830, 51
- Suffak et al. (2020) Suffak M. W., Jones C. E., Tycner C., Henry G. W., Carciofi A. C., Mota B. C., Rubio A. C., 2020, ApJ, 890, 86
- Tassoul (1978) Tassoul J.-L., 1978, Theory of rotating stars. Princeton University Press
- Theodossiou & Danezis (1991) Theodossiou E., Danezis E., 1991, Ap&SS, 183, 91
- Townsend et al. (2004) Townsend R. H. D., Owocki S. P., Howarth I. D., 2004, MNRAS, 350, 189
- von Zeipel (1924a) von Zeipel H., 1924a, MNRAS, 84, 665
- von Zeipel (1924b) von Zeipel H., 1924b, MNRAS, 84, 684
- Wade & Rucinski (1985) Wade R. A., Rucinski S. M., 1985, A&AS, 60, 471
- Wang et al. (2018) Wang L., Gies D. R., Peters G. J., 2018, ApJ, 853, 156
- Zorec et al. (2005) Zorec J., Frémat Y., Cidale L., 2005, A&A, 441, 235