A pragmatic adaptive enrichment design for selecting the right target population for cancer immunotherapies
Abstract
One of the challenges in the design of confirmatory trials is to deal with uncertainties regarding the optimal target population for a novel drug. Adaptive enrichment designs (AED) which allow for a data-driven selection of one or more pre-specified biomarker subpopulations at an interim analysis have been proposed in this setting but practical case studies of AEDs are still relatively rare. We present the design of an AED with a binary endpoint in the highly dynamic setting of cancer immunotherapy. The trial was initiated as a conventional trial in early triple-negative breast cancer but amended to an AED based on emerging data external to the trial suggesting that PD-L1 status could be a predictive biomarker. Operating characteristics are discussed including the concept of a minimal detectable difference, that is, the smallest observed treatment effect that would lead to a statistically significant result in at least one of the target populations at the interim or the final analysis, respectively, in the setting of AED.
1 Introduction
Cancer immunotherapy (CIT) has revolutionized the treatment of cancer patients. CIT is able to stimulate and promote the immune system and to engage it in the fight against cancer. The immune system normally recognizes and eliminates most early tumor cells, but immunological checkpoints (e.g. PD-L1) constitute a significant obstacle to effective antitumor immune responses 1. An important class of CITs are PD1 and PD-L1 inhibitors 1. PD-L1 protein expression on tumor or immune cells has emerged as a potential predictive biomarker for sensitivity to such CITs. However, uncertainty remains on the value of PD-L1 as a predictive biomarker which may vary by cancer type or stage 2, as immune-based interactions are dynamic and complex in nature.
A major topic in research and development of CITs is thus the identification and confirmation of subgroups of patients where a treatment is (most) effective 3 and dealing with uncertainties regarding the optimal target population is an important consideration in the design of pivotal CIT trials. If there is confidence at the time of the design of the pivotal trial that the biomarker has the ability to identify patients who will benefit from the treatment, then the trial can be limited to the biomarker-positive patients (that is, the trial is enriched at the beginning). If the biomarker is appropriately developed but confidence in its ability to fully identify the correct biomarker population is lacking, then a separate Phase II study investigating the biomarker population could be conducted to inform the Phase III trial design. Alternatively, a single confirmatory adaptive enrichment design (AED) could be conducted which allows a data-driven selection of one or more pre-specified biomarker subpopulations at an interim analysis, and the confirmatory proof of efficacy in the selected subset at the end of the trial 4, 5.
Regulatory guidance documents for confirmatory adaptive designs are available and stress the importance of prospective planning of adaptations and strong type I error control 6, 7. Moreover, an ICH guideline 8 on adaptive trials is in preparation. However, although the methodological foundation for adaptive designs was established more than 30 years ago, their impact in drug development has not been as high as anticipated 9. In particular, practical case studies of AEDs are still rare. For example, according to a recent review of 59 medicines for which an adaptive clinical trial had been submitted to the EMA Scientific Advice, only 5/59 (8%) concerned AED and for only one of them, it could be established that the corresponding trial was actually initiated 10.
In this article, we present a case study of a confirmatory AED in CIT. This trial compares a CIT (atezolizumab) plus chemotherapy versus chemotherapy alone in early triple-negative breast cancer (TNBC) with pathological complete response as the primary (binary) endpoint. The trial was originally planned as a conventional randomized trial in all-comers but then converted to an AED based on emerging data external to the trial suggesting that PD-L1 could be a predictive biomarker for the atezolizumab treatment effect in TNBC. The remainder of this article is structured as follows. Section 2 outlines the general methodological framework for an AED with a binary clinical endpoint. This section also contains a discussion of the minimal detectable difference (MDD), an important concept for the design of a trial. In Section 3, the methodology is applied to our case study. The article concludes with a discussion.
2 Adaptive enrichment designs with binary endpoints
2.1 General description
At the design stage of a trial, it is often uncertain whether all patients or only a targeted subgroup will benefit from the experimental treatment. Adaptive enrichment designs (AED) which allow for a data-driven population selection at interim analyses have been proposed in this setting 4, 11. The general methodology to control for multiple testing in such designs via -value combination tests and the closed testing principle was described in Brannath et al 12.
In this section, we summarize the theory of AEDs with a focus on methods relevant to our case study which is a two-stage AED with two sub-populations defined by a dichotomized biomarker and a binary endpoint (responder vs non-responder). We refer to Section 11.2 of Wassmer and Brannath 13 for a detailed discussion of the general case with multiple stages and sub-populations and general endpoints and to 14 for a systematic review of methods for identification and confirmation of targeted subgroups in clinical trials. In the last part of this section, we discuss the calculation of the minimum detectable difference (MDD), which translates the local significance levels to the clinically more interpretable treatment effect scale. To our knowledge the MDD has not been discussed in the AED setting previously.
Let denote the full population, the sub-population of subjects tested positive for a binary biomarker of interest, and the subgroup of biomarker-negative subjects. The true response probability in the experimental arm in and is denoted by with and the corresponding probability in the control arm is . The two one-sided null-hypotheses of interest are versus the alternatives for .
A flow chart of a pivotal AED in this setting is shown in Figure 1. In stage 1 of the trial, patients from the full population are randomized to the experimental treatment or control and and are co-primary populations. After data from stage 1 is available, a pre-specified interim analysis is conducted and one of the following decisions is taken based on decision criteria as discussed in Section 2.3:
-
1.
Stop early for efficacy in or or both.
-
2.
Stop early for futility in both and .
-
3.
Continue to stage 2 with as the target population, that is, randomize an additional patients from in stage 2, and only test at the final analysis.
-
4.
Continue to stage 2 with as the target population, that is, randomize an additional patients from in stage 2, and only test at the final analysis.
-
5.
Continue to stage 2 with and as co-primary populations, that is, randomize an additional patients from in stage 2, and test both and at the final analysis.
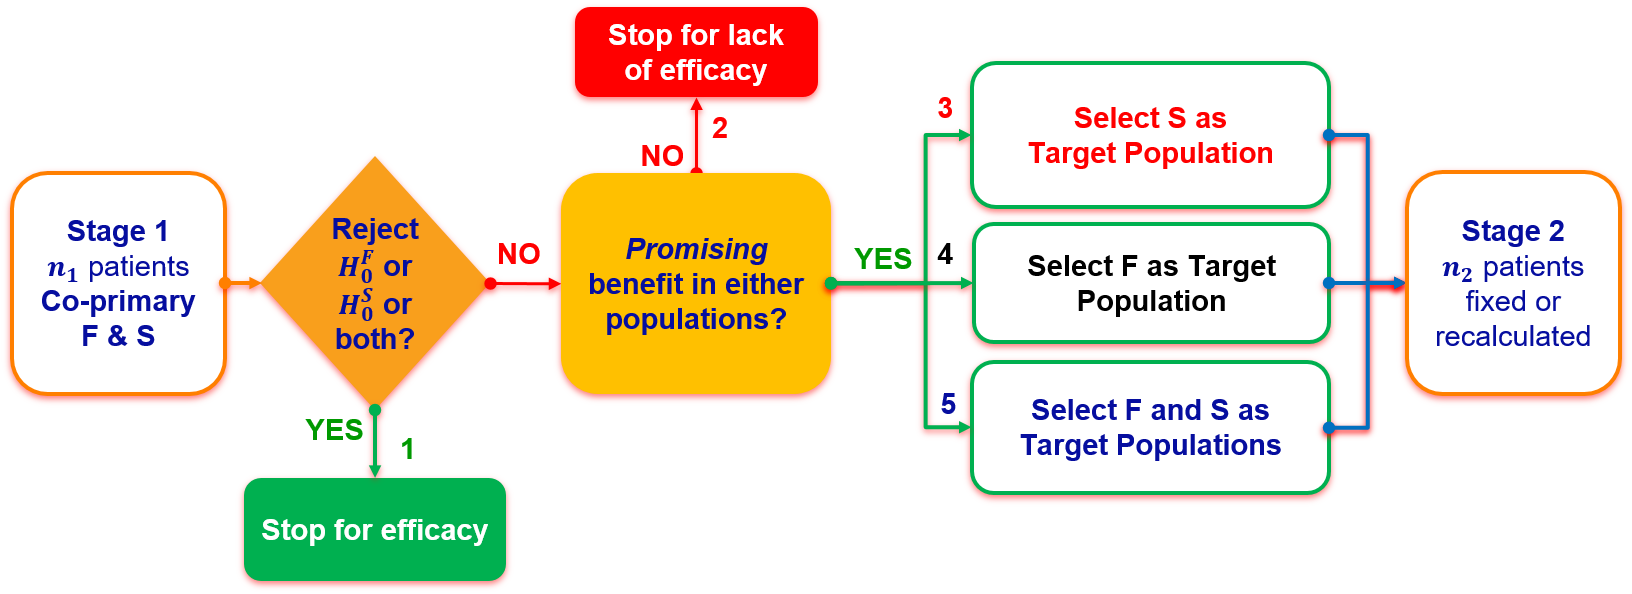
Decision 1 provides an early opportunity to declare efficacy in case an overwhelming benefit is observed in or (or both). Decision 2 avoids exposing additional patients to a potentially inefficacious experimental treatment. The other three decisions are applicable if a promising signal is seen but it is not pronounced enough for an early read-out.
Decision 3 is chosen when the biomarker is strongly predictive of treatment benefit, hence maximizing the power to reject as well as avoiding to expose patients in to an ineffective treatment with some potential safety reactions. Decisions 4 and 5 are appropriate if a promising signal is observed in both and (or ). Dropping as a target population in Decision 4 is sensible when e.g. the predictive value of the relevant biomarker is weak, hence dropping and maximizing the probability to reject .
2.2 Type I error control
In an AED, type I error can be controlled by combining closed testing 15 with adaptive -value combination. Denote the unadjusted stage-wise one-sided -values (testing for superiority of the intervention arm) corresponding to the null hypotheses () based on data from stage () by .
Multiplicity in target populations is circumvented by using a closed testing procedure. For two target populations, the closed testing principle implies that significance in or can only be declared if the test of the intersection null hypothesis can also be rejected. Several choices for the test of the intersection hypothesis are possible, see Section 11.2 of Wassmer and Brannath 13. We use the Simes test 16 because it protects type I error without requiring strong assumptions and is more powerful than the Bonferroni test.
The design of the second stage of a two-stage AED, especially selection of the target population(s) and associated test hypothesis(es), is driven by trial data from the first stage which prohibits “naive” analyses via pooling data across stages. To remedy this, stage-wise -values can be combined by using inverse normal combination tests 17. Define -values corresponding to stage 1 -values by for and corresponding values for stage 2 accordingly. A combined -value accross both stages is then defined as with non-negative weights and satisfying . The -value corresponding to , that is, , is referred to as the combined -value.
The weights have to be pre-specified at the design stage. In our case study, we use the common definition of the weights according to the pre-planned stage-wise sample sizes and : and . These weights are optimal if the actual stage-wise sample sizes are proportional to the planned stage-wise sample sizes in each population. Note that discrepancies from this proportionality are expected in case the trial is enriched at stage 2 and only subjects from are recruited. However, it has been shown that the associated power loss from this is rather limited in all but extreme cases which is unlikely to our setting 17.
Regardless of the adaptations after stage 1, and follow the same bivariate distribution as a standard group sequential test with two interim analyses at information fractions and . Thus, standard statistical software for group sequential designs can be used for the determination of local significance levels and after each stage which allow for early stopping for efficacy and protect the ovarall significance levels across both -tests.
Following the aforementioned close-test principle and combined p-value combination approach, overall test decisions which control the family-wise type I error in the strong sense are then defined as follows:
-
•
is rejected after stage 1 if and .
-
•
is rejected after stage 1 if and .
-
•
is rejected after stage 2 if is a target population in stage 2, with and .
-
•
is rejected after stage 2 if if is a target population in stage 2, with and .
Stopping for futility is discussed in Section 2.3.
2.3 Decision criteria, determination of sample size and other design parameters
If the AED cannot be stopped for compelling efficacy after stage 1, a decision must be made whether to stop for futility or to continue to stage 2 with one or both populations. Decision criteria may be based on the observed treatment effect in and (and/or ) after stage 1 (e.g. 11 and our case study), conditional or predictive power (e.g. 18), or Bayesian decision theory (e.g. 19, 20, 21). While type I error control is guaranteed regardless of how these choices are made, the decision criteria affect the probability of correct decisions after stage 1 and study power.
In general, the design parameters for an AED include (1) the sample sizes and of stage 1 and 2, rescectively, where could be re-calculated at the interim analysis, (2) the -spending approach for early stopping for efficacy, (3) the exact decision criteria (thresholds) used for population selection criteria as well as for early stopping for futility.
In practice, these design parameters are usually determined by running simulations across a range of plausible scenarios and evaluating design characteristics such as: the overall power of the study, that is, the probability of a statistically significant result for either of the target populations or both at either the interim or final analysis, the conditional power, that is, the probability of a significant result conditional on continuing to stage 2, and the probability of making the “correct” decision(s) at the interim analysis. Overall power measures the success probability of the entire AED whereas conditional power assesses the probability of success of the additional investment into stage 2. Usually, a trade-off between overall and conditional power needs to be made because maximizing the latter leads to aggressive thresholds for futility stopping and population selection which may reduce overall power.
Of note, often “biomarker status” could be used as stratification factor for randomization and analysis. We adopt a common practice, which is to neglect this in sample size calculation for the case study in this paper.
2.4 Minimal detectable difference
In Section 2.2, it was outlined how to determine local significance levels and , that is, boundary values based on which test decisions can be taken as described at the end of Section 2.2.
To support clinical interpretation of these local significance levels, it is useful to express them on the treatment effect scale. We denote this as the minimal detectable difference (MDD), that is, the smallest observed absolute risk difference between the two groups which would lead to rejection of the corresponding null hypothesis after stage 1 or 2, respectively.
MDDs (also called boundary values on the treatment effect scale) are routinely provided for single stage or group-sequential trials by standard software such as rpact 22 (version 2.0.5) and an extension to AEDs is described below.
We first consider a single stage trial and a statistical test of the null hypothesis versus the alternative at the one-sided significance level . The observed proportion of in the control arm serves as a nuisance parameter in this setting and, typically, it is assumed to correspond to the hypothesized control proportion from the sample size calculation. Given , the MDD corresponds to the observed difference between the two arms which would lead to a -value of exactly using e.g. a signed (one-sided) chi-squared test for hypothesis testing. Numerically, the MDD can be calculated with any one dimensional root (zero) finding algorithm. If there is substantial uncertainty regarding the true response probability in the control arm, the MDD should be calculated for a range of plausible values.
In an AED, MDDs which lead to the rejection of the respective population null hypothesis after stage 1 can be calculated in the same way as for a single stage trial. The only additional complication is that the corresponding null hypothesis for each population can only be rejected if the intersection hypothesis is also rejected. If Simes test is used to test the intersection hypothesis, the intersection hypothesis and the null hypothesis for can both be rejected after stage 1 if either (that is, alone is responsible for the rejection of the intersection null hypothesis) or if both and (that is, contributes to the rejection of the intersection null hypothesis). Consequently, two MDDs can be calculated for : First, a conservative MDD for which assumes that alone is responsible for rejection of the intersection null hypothesis and corresponds to the MDD for a single stage trial based on the “adjusted” -value . Second, a more liberal MDD which is only applicable if contributes to the rejection of the intersection null hypothesis (and hence is also significant with a smaller -value than ), and corresponds to the MDD for a single stage trial based on the raw -value . Both, the conservative and liberal MDD will be useful in design discussions with the drug development team. In an analogous way, two MDDs can be calculated for .
MDD calculations after stage 2 are based on the combination test and require additional consistency assumptions to achieve a unique solution. First, we assume that the estimated proportions in each arms are identical for stage 1 and stage 2 data, respectively.
If only continues to stage 2, the intersection test is only relevant for the stage 1 data and it is plausible to additionally assume consistency in the driver for the treatment effect, that is, that the stage 1 -value for Simes test is driven by alone and given by . Thus, the MDD for after stage 2 corresponds to the observed difference between the two arms which would lead to a -value of exactly using the combination test based on the adjusted stage 1 -value and the raw stage 2 -value . If only continues to stage 2, the MDD can be calculated in an analogous way.
If both and continue to stage 2, we propose to calculate a conservative MDD for using an adjusted stage 1 -value and an adjusted stage 2 -value for the combination test (assuming that the intersection test is driven by alone in both stages) and a more liberal MDD for based on the raw stage 1 -value and the raw stage 2 -value (which is only valid if contributes to the rejection of the intersection test in both stages). In the same way, a conservative and a liberal MDD can be calculated for .
As described above, MDDs can only be derived under additional assumptions. While these assumptions will often be approximately true, it is important to recognize that formal test decisions should be based on the local significance levels and and not on the MDD. However, the MDD is on a clinically relevant scale, and as such extremely helpful for a discussion of the trial design with the cross-functional clinical development teams. For example, if the MDD is very small, this indicates that it is possible that the observed treatment effect is not clinically relevant but that the trial is nevertheless statistically significant. This would make it very difficult to market the drug and hence, such a finding may lead to a re-consideration of the trial sample size.
3 Application: the IMpassion031 trial
3.1 The original IMpassion031 trial design
IMpassion031 is a global Phase III, double-blind, 1:1 randomized, multicenter, placebo-controlled study which is conducted to evaluate the efficacy and safety of neoadjuvant treatment with nab-paclitaxel + doxorubicin + cyclophosphamide and either atezolizumab or placebo in invasive stage II/III early triple-negative breast cancer (TNBC). The CIT atezolizumab is an anti-programmed death-ligand 1 (PD-L1) monoclonal antibody that blocks the binding of PD-L1 to PD-1 and B7.1 receptors, thereby restoring tumor-specific immunity. The primary efficacy endpoint of IMpassion031 is pathological complete response (pCR), a binary clinical endpoint evaluated at surgery which takes place approximately 6 months after randomization for patients in both arms. pCR in this study is defined as absence of residual invasive cancer in the complete resected breast specimen and all sampled regional lymph nodes following completion of neoadjuvant therapy 23. The original IMpassion031 trial had a fixed non-adaptive design with a one-sided significance level of 2.5% and a target sample size of 204 subjects from the overall population , randomized 1:1 to receive either atezolizumab in combination with chemotherapy or chemotherapy alone. This yields a power of 79% to detect an increase of 20% pCR rate in the combo arm from a true pCR rate of 48% in the mono arm, accounting for 5% drop-out rate in both treatment arms, whereby drop-outs are considered non-responders. Chi-square test for two proportions was considered.
The trial was initiated on 24th July 2017 and recruitment of the original 204 subjects independent of PD-L1 status was completed on 12th June 2018, with 205 patients actually enrolled. During patient follow-up and prior to study unblinding, data external to the trial emerged suggesting that PD-L1 could be a predictive biomarker for the treatment effect of atezolizumab in metastatic or locally advanced TNBC (IMpassion130 24). Although results of IMpassion130 were compelling with respect to the predictive nature of PD-L1 biomarker, the extent to which this finding would apply to the early TNBC setting was uncertain. Therefore, the original fixed design was changed to an AED to address this potential predictive biomarker population hypothesis. PD-L1 status was dichotomized according to a pre-specified cut-point which has been previously used and validated in the pivotal trial in advanced TNBC 25.
3.2 The IMpassion031 AED
By the time of the protocol amendment, that is, when transforming the trial to an AED, the target sample size for the original design had already been fully enrolled and follow-up was ongoing. Thus, this phase of the trial was assigned as stage 1 of the new AED with subjects.
The new AED design has the following features. The overall one-sided type-I error level is % and both used a 1:1 randomization ratio. After the interim analysis at the end of stage 1, to safeguard the scientific integrity of the study, an independent data monitoring committee will look at unblinded data to make recommendations to the trial sponsor regarding early stopping for efficacy or futility or continuing into stage 2 with the target population(s) selected, following the general framework laid down in Section 2 and displayed in Figure 1. The sample size of subjects for stage 2 is determined based on its favorable design characteristics such as power (see below) without adding too much operational complication such as extension of study duration. Importantly, the protocol amendment was completed and submitted to regulatory authorities while the treatment assignment remained double-blinded, hence protecting the integrity of the trial.
Type I error control is implemented by combining closed testing via Simes test with -value combination using inverse normal combination tests as described in Section 2. In order to allow for an acceptably high probability that the trial stops after stage 1, that is, the sample size of the original trial, 50% of the overall type I error is spent at stage 1 which implies local significance levels of and .
Adaptive sample size re-calculation after stage 1 is not considered since the design with fixed stage 2 sample has sufficient power and allowed to control the overall trial timelines. The selection of target population(s) for stage 2 and futility decisions are based on the observed treatment effect, that is, the difference of pCR rates between the two arms, after stage 1 in the PD-L1 positive population and its counterpart, the PD-L1 negative population . Based on clinical trial simulations (reported below) and discussion with clinicians, futility decision thresholds % and % are chosen. Thus, if the observed treatement effect in the PD-L1 positive population is % after stage 1, it is included as a target population in stage 2. Similarly, if the observed treatment effect in the PD-L1 negative population is % after stage 1, the full population is included as a target population in stage 2. If both treatment effects exceed the threshold, both populations are included and tested as co-primary populations at the final analysis. If neither treatment effect is above the threshold, the trial stops for futility. Decisions concerning are predicated on the observed treatment in the PD-L1 negative population instead of the full population to avoid cases where the benefit in is strongly driven by , hence minimizing the risk of exposing patients in to a potentially futile treatment independent of its activity in .
Simulations are used to investigate the properties of the chosen AED and the decision thresholds and . Three scenarios are reported here which all assume a prevalence of 47% of the PD-L1 positive subgroups (based on internal and external information such as Kwa et. al 26), a pCR rate of 48% in the control arm, and a treatment effect of 20% in the PD-L1 positive subgroup. The treatment effect in PD-L1 negative subjects is varied between 4%, 12%, and 20% (Table 1). The original trial design assumed a homogenous treatment effect of 20% in the full population but scenarios with a reduced treatment effect in PD-L1 negative patients are also plausible in view of the external information that triggered the amendment to IMpassion031. Of note, all simulations assumed a drop-out rate of 5% in both treatment arms and stages independent of the pCR outcome and that drop-outs were considered non-responders. Therefore, as an example, an underlying control arm pCR of 0.480.95=0.456 is considered in our simulation”.
Results of the simulations are displayed in Tables 2-4. In addition to the chosen decision thresholds of % and %, results for an alternative set of more aggressive decision thresholds % and ’=12% are also displayed for comparison purposes. Reported results for each scenario represent averages over 100,000 simulated trials.
Under the original trial assumptions (scenario 1), the overall probability to stop for efficacy (that is, reject either or or both) after stage 1 is 64% compared to a power of 79% for the original trial design (Table 2). This quantifies the price for the additional flexibility of two co-primary populations, the choice of the target population for stage 2, and a second opportunity to declare efficacy after stage 2. The futility decision thresholds and do not impact the estimated probabilities of stopping for efficacy at stage 1. However, the more aggressive (higher) decision thresholds almost double the likelihood for futility stopping in all scenarios, whereas they reduce the likelihood of continuing to stage 2 with only patients from . Similarly, using the more aggressive thresholds reduce the chance of continuing to stage 2 with both and whereas the chance of continuing only in is slightly increased in all scenarios. This latter finding is mainly due to the fact that many of the simulated trials which would continue to stage 2 with both and for the less aggressive thresholds continue with only for the more aggressive thresholds due to the larger increase from to compared to the increase from to . Hence, % and % are considered the better choice due to the lower chance of stopping for futility as well as higher chance to continue in either or both and , which provides more confidence to clinicians based on the mode of action of our active treatment.
The overall power for the revised IMpassion031 design is 88% (versus 79% for the original design) for scenario 1, 76% (versus 57%) for scenario 2, and 67% (versus 35%) for scenario 3 (Table 3). While the power is still below 80% for scenarios with a reduced treatment benefit in PD-L1 negative patients, it is substantially increased compared to the original design. An even larger increase in power would have required a larger stage 2 sample size, which would have put challenges on recruitment feasibility and timelines, in particular if one would only continue with in stage 2.
More aggressive thresholds for assessing futility and population selection would lead to a general drop in overall power (Table 3) but increase the conditional power, that is, the conditional rejection probabilities if stage 2 is activated (Tables 4). However, one needs to take into account the greater risk of not activating stage 2 with the more aggressive thresholds.
Finally, MDDs for IMpassion 031 are displayed in Table 5. An observed difference in response rates of at least 17% in or at least 25% in (or a difference of both at least 16% in and at least 22% in jointly) is required for an efficacy stop after stage 1. After stage 2, the smallest MDD is 12% for which applies if and are both tested at stage 2 and the treatment effect in alone is also at least 17%. These MDDs were all considered to correspond to clinically relevant effect sizes.
Of note, the futility boundaries at the interim were % and % (consistent with a treatment effect of % in ). These values are smaller than the calculated MDDs after stage 2. If this were not the case, the same observed treatment effect might lead to a futility stop at the interim analysis but also to a rejection of the null hypothesis at the final analysis. This would be incoherent and should lead to a re-assessment of the planned futility boundaries.
4 Discussion
The world of cancer immunotherapies (CITs) is highly dynamic and data external to an ongoing trial is evolving quickly. In this paper, we showed that it is possible to incorporate emerging data regarding the most appropriate target population into an ongoing trial by amending it to an adaptive enrichment trial (AED). The implemented two-stage AED allows for both efficacy and futility stopping after stage 1, as well as for population selection for stage 2. Importantly, the protocol was amended and submitted to regulatory agencies while stage 1 was still ongoing and prior to any unblinding of the double-blind trial, hence protecting the integrity of the design.
This paper also introduced the concept of the minimal detectable difference (MDD) to AED, which is relevant for the discussion of the design with stakeholders beyond biostatistics.
The proposed AED in CIT addresses several important considerations highlighted in the recent adaptive trials guidance by the FDA for enrichment designs 6: First, the design combines established statistical methods to protect the familywise type I error in the strong sense. Second, the data external to the trial provided a strong rationale that the benefit-risk profile may be more favorable in the PD-L1 positive subgroup. Third, the PD-L1 assay and the threshold used to define PD-L1 positivity had been previously validated 25. Fourth, stage 1 of the trials was large enough to characterize the treatment effect in the complement population, that is, the PD-L1 negative subgroup, even in the situation when only PD-L1 positive subjects would be included in stage 2.
However, our proposal also has several limitations. The amendment was promptly implemented following the release of the external data, but this occurred only after recruitment to stage 1 of the trial had already been completed. This prevented optimization of some design parameters of the AED such as the stage 1 sample size. Moreover, our derivation of the MDD relied on the simple dependence of Simes’ test on the p-values from each population. If more complex intersection tests are employed, e.g. the test proposed by Spiessen and Debois 27, this would further complicate the quantification of the dependence of test decisions for each population on the intersection test. In addition, we focused on hypothesis testing but did not cover estimation and inference in AEDs which is an important area of current research. We refer to Chapter 8 of Wassmer and Brannath 13 for a general discussion for adaptive trials and to Kunzman et al 28 for a discussion of estimation in the context of AEDs. Finally, the current setting of a binary endpoint is methodologically easier than the time-to-event setting, which is frequent in oncology, where additional complications arise 11, 29.
In summary, this case study demonstrated that AED are an efficient way to circumvent emerging uncertainties about the target population for cancer immunotherapy. AEDs are still relatively rarely used in clinical development and we hope that this paper promotes their use and increases the confidence that such designs are feasible in practice.
5 Software
The code and the results of all computations described in this paper are available as a GitHub repository: https://github.com/nguyenducanhvn101087/Enrichment_Adaptive_Design
6 Data Availability Statement
Data sharing is not applicable to this article as no new data were created or analyzed in this study.
References
- Chen and Mellman 2013 Daniel S. Chen and Ira Mellman. Oncology Meets Immunology: The Cancer-Immunity Cycle. Immunity, 39(1):1–10, July 2013. doi: 10.1016/j.immuni.2013.07.012. URL https://doi.org/10.1016/j.immuni.2013.07.012.
- Davis and Patel 2019 Andrew A. Davis and Vaibhav G. Patel. The role of PD-L1 expression as a predictive biomarker: an analysis of all US food and drug administration (FDA) approvals of immune checkpoint inhibitors. Journal for ImmunoTherapy of Cancer, 7(1), October 2019. doi: 10.1186/s40425-019-0768-9. URL https://doi.org/10.1186/s40425-019-0768-9.
- George et al. 2019 Anil P. George, Timothy M. Kuzel, Yi Zhang, and Bin Zhang. The Discovery of Biomarkers in Cancer Immunotherapy. Computational and Structural Biotechnology Journal, 17:484–497, 2019. doi: 10.1016/j.csbj.2019.03.015. URL https://doi.org/10.1016/j.csbj.2019.03.015.
- Wang et al. 2007 Sue-Jane Wang, Robert T. O'Neill, and H. M. James Hung. Approaches to evaluation of treatment effect in randomized clinical trials with genomic subset. Pharmaceutical Statistics, 6(3):227–244, 2007. doi: 10.1002/pst.300. URL https://doi.org/10.1002/pst.300.
- Rufibach et al. 2016 Kaspar Rufibach, Meng Chen, and Hoa Nguyen. Comparison of different clinical development plans for confirmatory subpopulation selection. Contemporary Clinical Trials, 47:78–84, March 2016. doi: 10.1016/j.cct.2015.12.014. URL https://doi.org/10.1016/j.cct.2015.12.014.
- FDA 2019 US FDA. Adaptive Designs for Clinical Trials of Drugs and Biologics - Guidance for Industry, 2019. URL https://www.fda.gov/media/78495/download.
- EMA 2007 EMA. Reflection Paper On Methodological Issues In Confirmatory Clinical Trials Planned With An Adaptive Design, 2007. URL https://www.ema.europa.eu/en/documents/scientific-guideline/reflection-paper-methodological-issues-confirmatory-clinical-trials-planned-adaptive-design_en.pdf.
- ICH 2019 ICH. E20: Adaptive Clinical Trials, 2019. URL https://database.ich.org/sites/default/files/E20_FinalConceptPaper_2019_1107_0.pdf.
- Bauer et al. 2015 Peter Bauer, Frank Bretz, Vladimir Dragalin, Franz König, and Gernot Wassmer. Twenty-five years of confirmatory adaptive designs: opportunities and pitfalls. Statistics in Medicine, 35(3):325–347, March 2015. doi: 10.1002/sim.6472. URL https://doi.org/10.1002/sim.6472.
- Collignon et al. 2018 Olivier Collignon, Franz Koenig, Armin Koch, Robert James Hemmings, Frank Pétavy, Agnès Saint-Raymond, Marisa Papaluca-Amati, and Martin Posch. Adaptive designs in clinical trials: from scientific advice to marketing authorisation to the European Medicine Agency. Trials, 19(1), November 2018. doi: 10.1186/s13063-018-3012-x. URL https://doi.org/10.1186/s13063-018-3012-x.
- Jenkins et al. 2010 Martin Jenkins, Andrew Stone, and Christopher Jennison. An adaptive seamless phase II/III design for oncology trials with subpopulation selection using correlated survival endpoints†. Pharmaceutical Statistics, 10(4):347–356, December 2010. doi: 10.1002/pst.472. URL https://doi.org/10.1002/pst.472.
- Brannath et al. 2009 Werner Brannath, Emmanuel Zuber, Michael Branson, Frank Bretz, Paul Gallo, Martin Posch, and Amy Racine-Poon. Confirmatory adaptive designs with Bayesian decision tools for a targeted therapy in oncology. Statistics in Medicine, 28(10):1445–1463, May 2009. doi: 10.1002/sim.3559. URL https://doi.org/10.1002/sim.3559.
- Wassmer and Brannath 2016 Gernot Wassmer and Werner Brannath. Group sequential and confirmatory adaptive designs in clinical trials. Springer, Switzerland, 2016. ISBN 978-3-319-32560-6.
- Ondra et al. 2015 Thomas Ondra, Alex Dmitrienko, Tim Friede, Alexandra Graf, Frank Miller, Nigel Stallard, and Martin Posch. Methods for identification and confirmation of targeted subgroups in clinical trials: A systematic review. Journal of Biopharmaceutical Statistics, 26(1):99–119, September 2015. doi: 10.1080/10543406.2015.1092034. URL https://doi.org/10.1080/10543406.2015.1092034.
- Marcus et al. 1976 Ruth Marcus, Eric Peritz, and K. R. Gabriel. On Closed Testing Procedures with Special Reference to Ordered Analysis of Variance. Biometrika, 63(3):655–660, 1976. ISSN 00063444. URL http://www.jstor.org/stable/2335748.
- Sarkar and Chang 1997 Sanat K. Sarkar and Chung-Kuei Chang. The Simes Method for Multiple Hypothesis Testing with Positively Dependent Test Statistics. Journal of the American Statistical Association, 92(440):1601–1608, December 1997. doi: 10.1080/01621459.1997.10473682. URL https://doi.org/10.1080/01621459.1997.10473682.
- Lehmacher and Wassmer 1999 Walter Lehmacher and Gernot Wassmer. Adaptive Sample Size Calculations in Group Sequential Trials. Biometrics, 55(4):1286–1290, December 1999. doi: 10.1111/j.0006-341x.1999.01286.x. URL https://doi.org/10.1111/j.0006-341x.1999.01286.x.
- Bhatt and Mehta 2016 Deepak L. Bhatt and Cyrus Mehta. Adaptive Designs for Clinical Trials. New England Journal of Medicine, 375(1):65–74, July 2016. doi: 10.1056/nejmra1510061. URL https://doi.org/10.1056/nejmra1510061.
- Götte et al. 2014 Heiko Götte, Margarita Donica, and Giacomo Mordenti. Improving Probabilities of Correct Interim Decision in Population Enrichment Designs. Journal of Biopharmaceutical Statistics, 25(5):1020–1038, June 2014. doi: 10.1080/10543406.2014.929583. URL https://doi.org/10.1080/10543406.2014.929583.
- Krisam and Kieser 2015 Johannes Krisam and Meinhard Kieser. Optimal Decision Rules for Biomarker-Based Subgroup Selection for a Targeted Therapy in Oncology. International Journal of Molecular Sciences, 16(12):10354–10375, May 2015. doi: 10.3390/ijms160510354. URL https://doi.org/10.3390/ijms160510354.
- Ondra et al. 2017 Thomas Ondra, Sebastian Jobjörnsson, Robert A Beckman, Carl-Fredrik Burman, Franz König, Nigel Stallard, and Martin Posch. Optimized adaptive enrichment designs. Statistical Methods in Medical Research, 28(7):2096–2111, December 2017. doi: 10.1177/0962280217747312. URL https://doi.org/10.1177/0962280217747312.
- G and F 2019 Wassmer G and Pahlke F. rpact: Confirmatory Adaptive Clinical Trial Design and Analysis, 2019. URL https://CRAN.R-project.org/package=rpact. R package version 2.0.5.
- FDA 2014 US FDA. Pathologic Complete Response in Neoadjuvant Treatment of High-Risk Early-Stage Breast Cancer: Use as an Endpoint to Support Accelerated Approval, 2014. URL https://www.fda.gov/regulatory-information/search-fda-guidance-documents/pathologic-complete-response-neoadjuvant-treatment-high-risk-early-stage-breast-cancer-use-endpoint.
- Release 2018 Esmo 2018 Press Release. Some Patients With Metastatic Triple Negative Breast Cancer Live Longer With Immunotherapy, 2018. URL https://www.esmo.org/Press-Office/Press-Releases/IMpassion130-atezolizumab-nab-pac-triple-negative-breast-cancer-Schmid.
- Roche 2019 Hoffmann-La Roche. A Study of Atezolizumab in Combination With Nab-Paclitaxel Compared With Placebo With Nab-Paclitaxel for Participants With Previously Untreated Metastatic Triple-Negative Breast Cancer (IMpassion130), 2019. URL https://clinicaltrials.gov/ct2/show/NCT02425891.
- Kwa and Adams 2018 Maryann J. Kwa and Sylvia Adams. Checkpoint inhibitors in triple-negative breast cancer (TNBC): Where to go from here. Cancer, 124(10):2086–2103, February 2018. doi: 10.1002/cncr.31272. URL https://doi.org/10.1002/cncr.31272.
- Spiessens and Debois 2010 Bart Spiessens and Muriel Debois. Adjusted significance levels for subgroup analyses in clinical trials. Contemporary Clinical Trials, 31(6):647–656, November 2010. doi: 10.1016/j.cct.2010.08.011. URL https://doi.org/10.1016/j.cct.2010.08.011.
- Kunzmann et al. 2017 Kevin Kunzmann, Laura Benner, and Meinhard Kieser. Point estimation in adaptive enrichment designs. Statistics in Medicine, 36(25):3935–3947, August 2017. doi: 10.1002/sim.7412. URL https://doi.org/10.1002/sim.7412.
- Magirr et al. 2016 Dominic Magirr, Thomas Jaki, Franz Koenig, and Martin Posch. Sample Size Reassessment and Hypothesis Testing in Adaptive Survival Trials. PLOS ONE, 11(2):e0146465, February 2016. doi: 10.1371/journal.pone.0146465. URL https://doi.org/10.1371/journal.pone.0146465.
7 Tables
Table 1: Scenarios investigated in the clinical trial simulations
| Scenario | ||||
| 1 | 0.20 | 0.20 | 0.20 | 0.48 |
| 2 | 0.20 | 0.12 | 0.16 | 0.48 |
| 3 | 0.20 | 0.04 | 0.12 | 0.48 |
-
is the pCR rate in intervention arm for population , . is the pCR rate in control arm assumed to be the same for and . Numbers in the table refer to true pCR rates.
Table 2: Relative Frequencies of Decisions at Stage 1 for IMpassion031 for the different scenarios and different futility decision thresholds
| Decision | Scen. 1 | Scen. 2 | Scen. 3 | Scen. 1 | Scen. 2 | Scen. 3 |
| 1a - Stop after stage 1: efficacy in F only | 0.27 | 0.12 | 0.04 | 0.27 | 0.12 | 0.04 |
| 1b - Stop after stage 1: efficacy in S only | 0.01 | 0.04 | 0.10 | 0.01 | 0.04 | 0.10 |
| 1c - Stop after stage 1: efficacy in F and S | 0.36 | 0.29 | 0.19 | 0.36 | 0.29 | 0.19 |
| 2 - Stop after stage 1: futility | 0.04 | 0.10 | 0.17 | 0.08 | 0.19 | 0.29 |
| 3- Continue to stage 2: S only | 0.08 | 0.22 | 0.38 | 0.07 | 0.18 | 0.29 |
| 4- Continue to stage 2: F only | 0.14 | 0.11 | 0.06 | 0.17 | 0.14 | 0.06 |
| 5- Continue to stage 2: F and S | 0.10 | 0.11 | 0.07 | 0.03 | 0.04 | 0.02 |
Table 3: Overall statistical power for IMpassion031 for the different scenarios and different futility decision thresholds
| Scen. 1 | Scen. 2 | Scen. 3 | Scen. 1 | Scen. 2 | Scen. 3 | |
| Power F | 0.80 | 0.54 | 0.28 | 0.79 | 0.52 | 0.27 |
| Power S | 0.49 | 0.57 | 0.61 | 0.45 | 0.51 | 0.55 |
| Power (F or S) | 0.88 | 0.76 | 0.67 | 0.86 | 0.71 | 0.61 |
| Power (F and S) | 0.41 | 0.35 | 0.22 | 0.38 | 0.32 | 0.20 |
| Power (F or S) considers statistical significance achieved for either F | ||||||
| or S or both | ||||||
Table 4: Conditional power (CP): Power conditional on activation of stage 2 for IMpassion031 for the different scenarios and different futility decision thresholds
| Scen. 1 | Scen. 2 | Scen. 3 | Scen. 1 | Scen. 2 | Scen. 3 | |
| CP F if only F tested in stage 2 | 0.67 | 0.46 | 0.27 | 0.74 | 0.57 | 0.40 |
| CP S if only S tested in stage 2 | 0.77 | 0.76 | 0.74 | 0.84 | 0.83 | 0.82 |
| CP (F or S) if F and S tested in stage 2 | 0.82 | 0.72 | 0.61 | 0.86 | 0.79 | 0.68 |
Table 5: Minimal detectable differences (MDDs) for the IMpassion031 trial, that is, approximate minimum absolute risk differences that would lead to a significant result in that population after the respective stage.
| Stage | Subgroup S | Full population F |
| Stage 1 | 0.25 [0.22] | 0.17 [0.16] |
| Stage 2 | ||
| - only S tested in stage 2 | 0.16 | |
| - only F tested in stage 2 | 0.13 | |
| - F and S included in stage 2 | 0.20 [0.17] | 0.14 [0.12] |
| All MDDs assume a pCR probability of 0.480.95=0.456 in | ||
| the control arm accounting for 5% drop-outs. Numbers in | ||
| brackets are valid if the respective other population drives the | ||
| intersection test, that is, both populations statistically | ||
| significant but the respective other population has a lower | ||
| -value. | ||