Strong evidence of from a unitary multichannel reanalysis of elastic scattering data with crossing-symmetry constraints
Abstract
An analysis is presented of elastic -wave phase shifts and inelasticities up to 2 GeV, aimed at identifying the corresponding excited resonances and focusing on the vs. controversy. The approach employs an improved parametrization in terms of a manifestly unitary and analytic three-channel -matrix with its complex-energy pole positions. The included channels are , , and , the latter two being effective in the sense that they mimic several experimentally observed decay modes with nearby thresholds. In an alternative fit, the mode is replaced by , which is also an experimentally relevant channel. The improvement with respect to prior work amounts to the enforcement of maximum crossing symmetry through once-subtracted dispersion relations called GKPY equations. A separate analysis concerns the pion electromagnetic form factor, which again demonstrates the enormous importance of guaranteeing unitarity and analyticity when dealing with very broad and highly inelastic resonances. In the case of vs. , the failure to do so is shown to give rise to an error in the predicted mass of about 170 MeV. A clear picture emerges from these analyses, identifying five vector states below 2 GeV, viz. , , , , and , with being indisputably the most important excited resonance. The stability of the fits as well as the imposition of unitarity, analyticity, and approximate crossing symmetry in the analyses lend very strong support to these assignments. The possibly far-reaching consequences for meson spectroscopy are discussed.
pacs:
14.40.Cs, 13.25.Jx, 11.55-m, 11.55.FwI Introduction
The experimental status of meson resonances with masses ranging from 1 to 2 GeV is very poor. Many states expected from the quark model have not been observed so far, whereas several apparently normal resonances listed in the PDG tables PDG2020 do not fit in with mainstream quark models like, for instance, the relativized meson model by Godfrey and Isgur (GI) PRD32p189 . In Ref. APPBPS5p1007 some of the obvious discrepancies were briefly reviewed, e.g. concerning the many observed states (with ) to be contrasted with the much fewer ones predicted in the GI model. Another disagreement is the relatively low mass of the strange vector meson , the first radial excitation of , which is predicted almost 200 MeV higher in the GI and similar quark models. On the other hand, , the first radial excitation of , is listed by the PDG as PDG2020 , which is difficult to reconcile with a lighter , as the latter state contains one strange quark and one light quark instead of two light quarks. However, under the entry in the PDG meson listings one finds a large variety of experimental observations, with a huge mass range of 1208–1624 MeV, also depending on the particular strong decay mode. As a matter of fact, there have been many indications of a lighter , roughly in the range 1.25–1.3 GeV, which we shall examine in more detail in the next section.
The importance of more accurately knowing the mass, and of course that of , should not be underestimated. Quark models based on the usual Coulomb-plus-linear interquark potential, with a running strong coupling constant in the Coulombic part, predict increasing radial splittings for lighter quarks. Therefore, a mass significantly lower than the value predicted in the GI and largely equivalent models would pose a serious challenge to such approaches. Now, it is true that the precise mass of a broad resonance like depends on the way the corresponding scattering data are analyzed. In that respect, the usual Breit-Wigner (BW) parametrizations can be very unreliable, possibly leading to deviations of the order of 10 MeV for and even more than 100 MeV in the case of PRD96p113004 . The reason is that multi-BW parametrizations typically do not satisfy unitarity, which becomes a very serious issue in highly inelastic processes like those in which is observed. Another problem, this time on the theoretical side, is the usual static approach to mesonic resonances in most quark models, treating them as manifestly stable bound states of a quark and an antiquark. Coupled-channel effects from meson loops, due to both open and closed meson-meson decay channels, may give rise to sizable mass shifts, alongside producing a large width. For instance, in the multichannel unitarized quark model of Ref. PRD27p1527 a bare mass of 1.48 GeV is lowered by about 190 MeV owing to coupled channels, resulting in a physical mass of 1.29 GeV. However, in the latter model a completely different confinement interaction is employed, leaving doubts about the precise size of such unitarization effects in mainstream quark models. Moreover, also the ground states as well as the higher radial excitations may suffer considerable mass shifts PRD27p1527 , so that a refit of all parameters will have to be carried out when unitarizing any particular model.
A further important piece of information comes from recent lattice-QCD calculations. In Ref. ARXIV13116579 masses of light and strange hadrons were computed in an unquenched simulation, but with only (anti)quark interpolators included and so resulting in purely real spectra. Thus, the mass of the first radial excitation of was found to be slightly above 1.6 GeV. On the other hand, in Ref. PRD88p054508 members of the same lattice collaboration study -wave scattering in a simulation with both quark-antiquark and meson-meson interpolators. Here, they employ Lüscher’s NPB354p531 method to extract phase shifts from discrete energy levels for different lattice sizes. The resulting phases are in good agreement with the data, including the mass and even its width in an extrapolation to the physical pion mass. The big surprise is the mass of the first radial excitation of , coming out at GeV, that is, about 300 MeV lower than in the former lattice simulation, without meson-meson interpolators. Admittedly, the latter calculation amounts to an approximation, as only the decay channel is included, thus treating the as a purely elastic resonance. Nevertheless, the importance of accounting for unitarity when doing spectroscopy in a quantitatively reliable fashion is unmistakable corroborated.
The present paper aims at clarifying the status of and also the higher vector excitations, by reanalyzing old data on scattering, viz. elastic phase shifts and inelasticities up to about 2 GeV. The employed model of analysis is a manifestly unitary three-channel -matrix parametrization, in which the complex pole positions of the different resonances are explicitly included through generalized BW-type expressions. Moreover, (approximate) crossing symmetry is enforced by minimizing in the fits the difference between the experimental real parts of amplitudes and the theoretical ones resulting from dispersion relations. The three included channels are , as well as the effective channels and , with the latter ones mimicking final states. For further details, see Sec. III.
The paper’s organization is as follows. Section II extensively reviews the status of vs. in decades of literature. Section III describes the done -matrix analyses of phase shifts and inelasticities with the imposed crossing-symmetry constraints. In Sec. IV an analysis of the pion electromagnetic form factor further illustrates the necessity of a unitary and analytic approach to very broad inelastic resonances. Section V is devoted to a general discussion of the results and conclusions.
II vs. in experiment and models
The first time a resonance was included in the PDG tables dates back to 1974 PDG1974 , with the entry in the data-card listings called . Its mass and width were listed as 1256 MeV and 130 MeV, respectively, from Ref. NPB47p61 . In the latter paper, evidence was found of two opposite-parity spin-1 resonances at about 1250 MeV in annihilations at rest. The vector state could correspond to the and the pseudo-vector () to what is nowadays called PDG2020 . To our knowledge, though, the earliest indication of a possible goes back to 1970 and was reported in Ref. PRD1p27 , also cited in Ref. PDG1974 . In this experiment, neutral bosons were observed in photoproduction on protons, including a resonance at about 1240 MeV with a width of roughly 100 MeV PRD1p27 . The authors tentatively identified this state with the pseudo-vector “” (now ) meson. However, not having determined the quantum numbers, they concluded:
“It is possible that this particle could be an as-yet-undiscovered vector meson” .
No further vector mesons were found in the energy region 1.3–2.0 GeV with a cross section larger than 5% of that of (90% confidence level PRD1p27 ).
Over the following years several experiments and analyses LNC8p659 ; NPB76p375 ; PLB52p493 ; NCA39p374 ; NCA49p207 ; ZPC4p169 ; PLB92p211 ; JETPL37p733 reported a possible roughly in the range 1.2–1.3 GeV. The most affirmative identification was the enhancement observed PLB92p211 in photoproduction on protons, with mass GeV, width GeV, and a dominant vector component. Note that this paper is cited in the PDG PDG2020 under the entry, in spite of the 200-MeV mass discrepancy. Also referred there PDG2020 is Ref. ZPC4p169 , concerning the mode as well.
In 1982 ZPC13p43 and 1983 PRD27p1527 , 1982 two quark-model calculations PRD27p1527 ; ZPC13p43 reported support for a below 1.3 GeV, while also describing its small cross section. Starting with Ref. PRD27p1527 , this above-mentioned unitarized multichannel quark model PRD27p1527 was applied to vector and pseudoscalar mesons. The resulting -wave cross section reasonably reproduced the mass, width, and pole position, while also predicting a pole with a real part of 1.29 GeV, though with a too small width. At this energy, the cross section revealed a very small enhancement on top of the tail (see Ref. PRD27p1527 , FIG. 4). Furthermore, the relativistic quark model of Ref. ZPC13p43 predicted a at about 1.22 GeV, explaining its small width as a combined effect of the nodal structure of the radially excited and the Lorentz-contracted wave functions of the outgoing two pions. Also of interest is the amplitude analysis of the coupled system in Ref. ZPC29p107 , which explained the difficulty to observe a in scattering between 1.1 and 1.3 GeV as being due to a small yet dominant inelastic background in that energy region.
The entry in the PDG was maintained up till 1986 PDG1986 . Things changed in 1987 with a combined analysis ZPC33p407 of two-pion and four-pion data from and processes, resulting in the postulation of two excited resonances, with the masses 1.465 and 1.7 GeV. Curiously, no below 1.3 GeV was even considered in the different fits to the data, in spite of its systematic inclusion in the PDG tables since 1974. As a matter of fact, no mention at all of such a resonance was made in Ref. ZPC33p407 . On the other hand, the GI relativized quark model PRD32p189 mentioned above was explicitly cited, for having predicted the at a mass of 1.45 GeV and the corresponding state at 1.66 GeV, i.e., values very close to the ones found in these fits ZPC33p407 . A key feature in the latter analysis is the authors’ (unproven) conjecture, in the context of the vector-meson-dominance model for photoproduction, that the off-diagonal transitions and have cross sections comparable to the transitions and , which correspond to the diffractive photoproduction of the “” meson (now called ) and “g(1690)” (now PDG2020 ), respectively. The subsequent 1988 PDG edition PDG1988 then included the new entries and , while completely eliminating the and oddly accommodating the observation of Ref. PLB92p211 under . This state of affairs has remained unaltered so far PDG2020 .
One of the authors of Ref. ZPC33p407 published several more papers on the and related issues, which merit some further attention. The first of these appeared in 1991 PLB269p450 , in a reaction to a new observation NPBPS21p105 of a below 1.3 GeV, with mass 1266 MeV and width 166 MeV. These vector-resonance parameters resulted from a partial-wave amplitude analysis of the system observed with the LASS spectrometer at SLAC for the reaction at 11 GeV. In Ref. PLB269p450 the authors claimed that
“the interpretation of the LASS state at 1.27 GeV as a radial excitation of the can in all probability be ruled out on the basis of its very small electromagnetic coupling” .
Note, however, that Ref. NPBPS21p105 did not make any statement about this coupling or the associated width. Instead, the authors of Ref. PLB269p450 carried out a BW fit including , a “” with fixed GeV and GeV, a “” with fixed GeV and GeV, and a “” with mass and width to be adjusted to the data, resulting in GeV and GeV. The problem is that such a BW description of overlapping resonances violates -matrix unitarity NCA107p2511 , which is all the more serious for extremely broad states, as in the present case. Moreover, the conclusion PLB269p450 that the found width is too small was based on a comparison with GI model predictions PRD32p189 , the very same ones that were claimed to be incompatible with a prior ZPC33p407 analysis of and . Another curiosity in Ref. PLB269p450 is the following conclusion: “Thus there does not seem to be a strong case for the interpretation of the LASS state as an exotic” . This contrasts with several later collaborative works ZPC59p621 ; ZPC60p187 ; ZPC62p455 ; PRD60p114011 of one of the authors of Ref. PLB269p450 , which advocated the interpretation of the LASS “” resonance as a crypto-exotic four-quark state (having non-exotic quantum numbers). However, such an assignment would require ZPC60p187 the existence of a narrow isoscalar partner state “” at about 1.1 GeV, for which there is no experimental evidence. The very broad PDG2020 is the only isoscalar resonance with a nearby mass and it is easily interpreted as a normal unflavored state.
Despite the dominant consensus on at 1.45 GeV and the corresponding state at 1.7 GeV, several later experiments and analyses contradict this picture. The OBELIX PLB414p220 spin-parity analysis of annihilations at very low momentum resulted in the clear identification of a resonance with mass GeV and width GeV, i.e., values compatible with those NPBPS21p105 of the LASS collaboration. More recently, a combined 2-channel -matrix and generalized BW analysis of -wave phase shifts and inelasticities up to 1.9 GeV was carried out NPA807p145 , satisfying analyticity and multichannel unitarity. As a result, not only was a firmly established for both methods of analysis, but evidence of higher excitations was also found, viz. at roughly 1.6 and 1.9 GeV. Remarkably, a further state at about 1.45–1.47 GeV could be accommodated as well, though its inclusion in the fits turned out to be almost immaterial. A generalization of the mentioned 2-channel -matrix parametrization to three channels in Ref. PRD81p016001 largely confirmed these results, the most significant difference being the prediction of a higher excitation at about 1.8 GeV instead of 1.9 GeV. Let us finish this discussion of the literature on vs. by quoting D. V. Bugg PR397p257 :
“It is not clear how to assign states to these [Regge] trajectories. The does not seem to fit naturally as the first radial excitation of the .”
In the next section we shall outline in detail our present method of analysis, which amounts to a further improvement of the analyses performed in Refs. NPA807p145 and PRD81p016001 , by also imposing constraints from crossing symmetry.
III from an analysis with crossing-symmetry constraints
The most recent confirmation of , fully supported by physical and mathematical arguments, resulted from a dispersive analysis PRD94p116013 of the amplitudes in three coupled -wave decay channels, with a built-in crossing-symmetry condition in the channel. A more detailed account of this work appeared in the PhD thesis of one of the present authors (VN) Nazari-thesis , from which we have selected the most important results and figures for the present paper and section.
Besides the channel, for which experimental phase shifts and inelasticities were available, two additional, effective channels were included in the analysis, which should simulate the dominant three- and four-body decays of the excitations. The problem here is that higher resonances have many observed decay channels, which would be unfeasible to account for completely in our -matrix approach, as it would lead to a proliferation of Riemann sheets and complex poles. Therefore, we are guided by the decay modes in the PDG listings PDG2020 , considerations from channel couplings, and the phase shifts themselves. Thus, under the PDG entry, we notice the modes , , , and , all included in the decays. Now, , , and all decay mostly to , so that we have three decay channels of an excited vector state that do not lie very far apart and all lead to a quasi-final state of , with being of course the true final state. And then there is the channel, which will naturally be dominated by the (alias ) resonance, with central threshold in the same energy ballpark. So we mimic these decays by including one channel, with threshold at 1055 MeV. Of course, the mentioned four channels have central thresholds that lie 195–385 MeV PDG2020 higher, but the involved resonances are extremely broad, so that opening our effective channel at the threshold seems reasonable. As for the third effective channel to be included in our analysis, we note that an isovector vector state couples very strongly to a -wave state, which is just a matter of recoupling coefficients of spin, isospin, and orbital angular momentum PRD27p1527 . Indeed, under the PDG PDG2020 entry, we see the decay mode among the ‘dominant’ decays, besides the already considered , , and modes. Now, the central PDG threshold mass of the channel is 1550 MeV, but also the is a relatively broad resonance, so that it is reasonable to open this channel at a somewhat lower energy. Thus, a value of 1512 MeV was obtained already in Ref. PRD81p016001 , upon fitting the -wave phase shifts, which is the threshold value we keep in the present analysis, too. Note that in Refs. PRD81p016001 ; Nazari-thesis this effective channel was called , but we now prefer to call it . Clearly, the channel will also contribute to the decays just as to those of , in spite of this mode not being listed under the PDG entry PDG2020 . Nevertheless, the designation appears more appropriate for our third effective decay channel.
These three channels were included in the analyses in Refs. PRD81p016001 ; PRD94p116013 ; Nazari-thesis , the methods and results of which we discuss below. However, when considering decays, special attention should be paid to the decay mode observed in several experiments PDG2020 . So in order to have a more complete analysis, we now also do a fit replacing the channel by , with threshold at 922 MeV. The corresponding results we will discuss below, right after presentation of methots used in our fits.
The simple phenomenological approach in this description is not based on some model with a phenomenological potential, but rather on a careful analysis of the -matrix poles of certain resonances on different Riemann sheets of the complex energy plane. Among the free parameters in the amplitudes, fitted to the experimental data and to dispersion relations called GKPY equations PRD83p074004 , are the complex pole positions themselves, making the obtained results largely model-independent. This also allows to avoid problems from searching for poles by analytically continuing the amplitudes into the complex energy or momentum plane, as the pole postions are determined directly in the fits.
The amplitudes are fully unitary and analytical, viz. of the form
| (1) |
where is the effective two-pion mass squared and the are -matrix elements. For example, in the case of the channel, such an element reads
| (2) |
and expressions for other matrix elements are given in Eq. 6 of Ref. PRD81p016001 . Phase shifts and inelasticities are denoted by and . For simplicity, they will be just called and further on in the text. The -matrix factors and stand for resonant and background parts, respectively, while are the Jost functions, which contain all the dynamics of the interacting particles, both in individual channels and between them. The momenta in a given channel are denoted by and the uniformizing variable is defined as
| (3) |
where and are the thresholds of the second and third channel, respectively. The variable transforms the eight-sheeted Riemann surface into a simpler complex plane. A resonance pole is given by , with the resonance mass and its full width. So for , we have
| (4) |
and the resonance contributions are defined as
| (5) |
where is the number of all poles. The background function has the form
| (6) |
with the Heaviside function ( for ) and where and are real numbers.
In the analysis of Ref. PRD81p016001 , (prior to Ref. PRD94p116013 ), the whole mathematical formalism described above was presented, and poles connected to a given resonance yet lying on different Riemann sheets were grouped into so-called clusters. These Riemann sheets depend on the number and type of analyzed channels. In the -channel case, the -matrix is defined on a -sheeted Riemann surface. Riemann sheets are numbered according to the signs of the imaginary parts of the relative momenta in all channels. So for three channels there are eight Riemann sheets on which the poles can lie, and they are numbered as follows: , , , , , , , and . Grouping into clusters is achieved by a weak albeit significant restriction on the freedom of the poles’ movement, always occurring as a result of the coupling between channels. As a result of fits to data for phase shifts and inelasticities in the channel below 2 GeV (see Chapter III and FIG. 2 in Ref. PRD81p016001 ), five resonances lying on various Riemann sheets were thus found, namely , , , , and .
The same amplitudes were then used in the later works PRD94p116013 ; Nazari-thesis . However, three important changes were introduced:
-
a)
the restrictions on the movement of poles as a function of coupling between channels were removed;
-
b)
the tested amplitudes (in , , , and waves) were subjected to the limitation resulting from fulfilling crossing symmetry in the channel up to about 1100 MeV;
-
c)
a threshold expansion with four parameters was used below about 640 MeV.
Removing the restrictions in point a) only lead to significant shifts of pole positions for two of them, associated with the cluster. They shift by several hundred MeV and thus produce very small phase shifts and inelasticity, typical for a weak background. It can be said that these become “background poles”. Two other poles of and all the others of the higher states shift by only a few MeV or less. The limitation in point b) is done by introducing in a component corresponding to the mentioned crossing symmetry (CS). The imposition of this symmetry is controlled by
| (7) |
where is number of chosen energies (between the threshold and 1100 MeV) at which is calculated, and is fixed at 0.01 in order to make the size of comparable to the other contributions to (i.e., the parts). Furthermore, is the real part of the amplitude used to fit the data and the GKPY equations, while is the same quantity yet calculated through the dispersion relations
| (8) | |||||
Here, is the crossing matrix between channels with isospin and , is the -wave scattering-length vector for isospin , and are the corresponding kernels for once-subtracted dispersion relations with imposed crossing symmetry. As demonstrated in Ref. PRD83p074004 , these dispersion relations produce significantly smaller errors in the computed amplitudes (actually in their real parts, from Eq. (8)) than the well-known Roy PLB36p353 dispersion relations with two subtractions. In practice, the integrals in Eq. (8) are done from the threshold up to about 2 GeV, because data are lacking at higher energies and so-called driving terms are used thereabove. These driving terms have the same structure as the kernel, but are not related to the experimental input amplitudes . Their and dependence is given by Regge parametrization.
The amplitudes in Ref. PRD81p016001 had a bad threshold behavior, i.e., they produced incorrect scattering lengths. Nevertheless, this did not prevent obtaining very reasonable results for the resonance pole positions of the different s for lying far above the threshold. However, when carrying out fits to the GKPY equations in Refs. PRD94p116013 ; Nazari-thesis , the threshold behavior of the amplitudes became very important, since the integrals in Eq. (8) start at threshold and the amplitudes there are the least suppressed by the dependence of the kernels on (for explicit formulae of the kernels, see the Appendix of Ref. PRD83p074004 ).
In order to improve the near-threshold behavior of the amplitudes (point c) above) from Ref. PRD81p016001 , the original amplitude in Eqs. (1)–(6) is replaced by a polynomial below about 640 MeV (this value resulted from fits to the data and the GKPY equations). The polynomial is merely a generalized near-threshold expansion in powers of the pion momentum , viz.
| (9) | |||||
where and are just scattering length and effective range, respectively, which can be fixed or fitted to the data and to the dispersion relations. The parameters and are free in the fits to the data and to the GKPY equations, being used to smoothly match the phase shifts from the polynomial (i.e., their values and first derivatives) to the multichannel ones determined by Eqs. (1)–(6) at the matching energy of about 640 MeV. This value is still below the pole mass of , so the effective-range approximation can be used within these limits, as opposed to, for example, the wave and the low-lying , in which case the matching energy must be well below 500 MeV.
This way the wave is fitted simultaneously to the dispersion relations and the experimental data. The is defined as
| (10) |
where defined in Eq. (7) includes input from all 6 important partial waves (: , , , , , and ) and contains only phase shifts and inelasticities of the wave (hereafter just called wave). Merely this wave is adjusted during the fits and changes to all in Eq. (8) are caused exclusively by modifications of this single wave. The free parameters are: mass and width of all -wave resonances, i.e., for (8 parameters), (16 parameters), (8 parameters), (8 parameters), and (8 parameters), the matching energy, and the effective-range parameter from the background part in Eq. (6) ( is fixed at to avoid violating unitarity in the inelasticities above 1.7 GeV). Thus, the maximum number of free parameters in the fits is 50. The parameters and in the polynomial defined in Eq. (9) are kept fixed at the values 0.0381 and 0.00523 , respectively.
To avoid ending up in some local minima instead of the global one, the fits are performed sequentially with an increasing number of free parameters, viz. as follows:
-
•
1st step: only matching energy, background parameter , and , i.e., 10 free parameters;
-
•
2nd step: as in the 1st step, plus , i.e., 26 free parameters;
-
•
3rd step: as in the 2nd step, plus , i.e., 34 free parameters;
-
•
4th step: as in the 3rd step, plus , i.e., 42 free parameters;
-
•
5th step: as in the 4th step, plus , i.e., 50 parameters.
Additionally, the fits are at each stage carried out repeatedly with a different number and values of the added resonance’s initial parameters. The fitted parameters in each step serve as starting parameters in the next step. In the first step, also the matching energy and background parameter are taken at different initial values. The total number of employed parameters (50) and their respective numbers for each resonance are the smallest ones that lead to good values of . Increasing them further does no longer give rise to a significant improvement in .
As already mentioned above, a relevant decay mode not considered in our analysis so far is , which is included under both the and PDG PDG2020 entries, with the corresponding resonance mass ranges of 1250–1624 MeV and 1550–1800 MeV, respectively. Our choice to do the main analysis with an effective channel instead of the channel was based on the consideration that the effective one should be more important, as it is believed to account for several observed decay modes. Redoing our analysis while replacing the channel by just amounts to changing the threshold value to 922 MeV, down from 1055 MeV, whereafter again fits to the experimental data and the GKPY equations are carried out. As a result, the masses of all resonances (i.e., the real parts of the poles) change only slightly: by +0.1 MeV, by +9.7 MeV, by +6.5 MeV, by +2.4 MeV, and by -7.5 MeV.
These small changes again show the stability and reliability of the obtained results. Moreover, comparing the quality of the two fits (values of ) as presented in Table 1, we see that they are essentially equivalent. The number of degrees of freedom (n.d.f.) in the fit equals 297, that is, 191 data points + 626 (26 energies for 6 partial waves) minus 50 free parameters. In the fit with the channel, the energy dependence of the phase shift and inelasticity does not undergo any significant qualitative modification and only small quantitative changes.
| channel | ||||
|---|---|---|---|---|
| 403.1 | 1.357 | 294.1 | 109.0 | |
| 406.4 | 1.368 | 296.0 | 110.4 |
The following description focuses on our analysis with as the second channel.
The introduction of the three modifications a), b), and c) does not cause as significant alterations in the -wave as in the -wave treated in Ref. PRD94p116013 , but it brings about several numerical changes. First of all, it is guaranteed that this new amplitude is not only unitary and analytic like in Ref. PRD81p016001 , but it also has the correct threshold behavior and fulfills the crossing-symmetry condition from the threshold up to about 1100 MeV. This modified amplitude, when fitted to the data given in Ref. PRD94p116013 as well as to the GKPY equations, results in a set of pole clusters from which these resonance poles, i.e., the ones having by far the largest effect on the whole amplitude, are presented in Table 2.
| Resonance | Riemann Sheet | , (MeV) |
|---|---|---|
| II | , | |
| III | , | |
| III | , | |
| IV | , | |
| VI | , |
In order to efficiently take into account the influence of all higher decay channels not included in the Jost function in Eq. (5), the simplest possible background is introduced (see Eq. (6)) and fitted to the data as well as the GKPY equations. As a result, a constant and small phase of almost -20∘ and a smoothly increasing small inelasticity are obtained.
The results presented in Figs. 1–5 are based on the fits carried out in Refs. PRD94p116013 ; Nazari-thesis . Figure 1 displays the phase shifts and inelasticities fitted to the also shown experimental data. Inspecting this figure and Table 1, we clearly see that the curves reproduce the data very well, all the way from the corresponding thresholds up to almost 2 GeV, especially when considering the small errors of the phase shifts. Experimental data are from Batley2008 -Hyams75 for the phase shifts and from Batley2008 -Hyams73 ,Hyams75 for inelasticity.
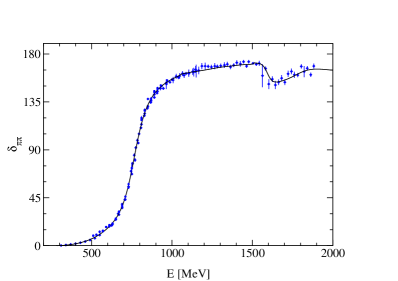
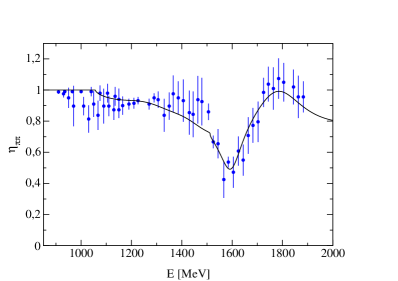
Figure 2 shows the -wave phase shifts due to the individual resonances, corresponding to poles (all members of a cluster for a given resonance) on different Riemann sheets. Of course, only the full phase shift has the correct threshold behavior, given by a polynomial with fixed scattering length and effective range. As one would expect, has by far the largest influence on the overall phase, dominating the contributions of the excitations. Moreover, the second most important resonance is clearly , whereas the smallest effect is due to . The visible yet rather insignificant kinks in the phase-shift and inelasticity curves right above 1.5 GeV correspond to the opening of the sharp effective threshold. Clearly, they do not affect the quality of the fits at all. Nevertheless, from a theoretical point of view it would be desirable to somehow smear out this threshold so as to account for the width, and the same for the channel. An empirical way to do this was formulated in Ref. EPJC71p1762 , by allowing for complex masses in the final state. The resulting violation of -matrix unitarity was then corrected by redefining with the help of a factorization valid for an arbitrary complex symmetric matrix. This may be the subject of future work along the lines of the present analysis.
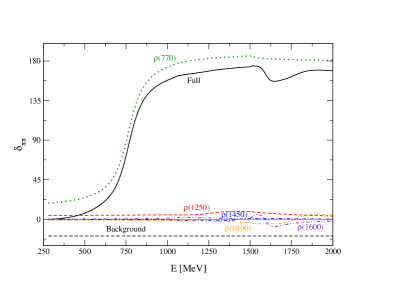
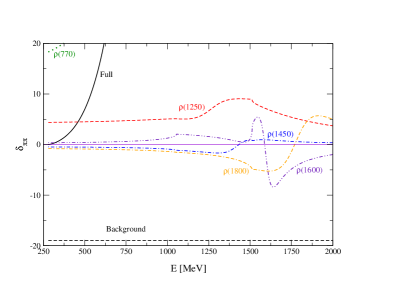
To properly assess the contribution of individual resonances to the full amplitude, it is very clarifying to compute it before and after removing those resonances. Figure 3 displays phase shifts for the full amplitude and that without terms from individual resonances. As the amplitude of is strongly dominant, especially below 1 GeV, changes by removing this resonance are not shown, because they would be too large. Once again one can clearly see how important the role of is, in contrast with most notably . Its influence dominates between 1.0 GeV and 1.5 GeV, being comparable to that of and thereabove. The contribution is quite small over the entire tested energy range.
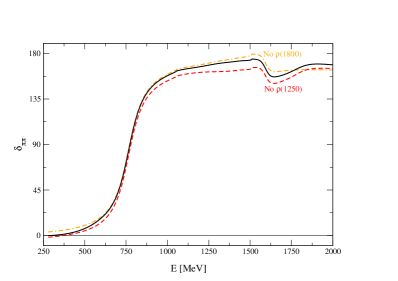
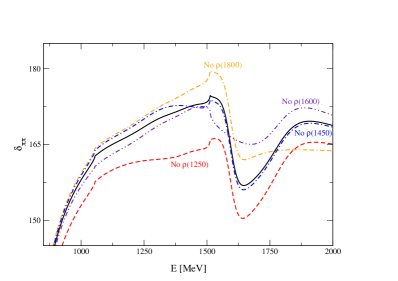
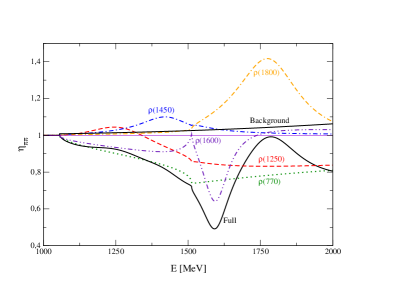
Figure 4 shows the inelasticity for the full amplitude and also the individual resonances. One can see very well that even below 1.5 GeV (near the threshold) inelasticity due to the amplitude significantly differs from 1 and together with part from that of almost completely determines the inelasticity of the full amplitude. Contributions from and largely cancel each other between the and thresholds. Above roughly 1.5 GeV, determines the energy dependence of almost entirely, interfering with the still large but already rather unstructured part comparable in size to that of . The contribution of to is very small above 1.5 GeV. As expected, it only has a minor maximum at about 1.4 GeV. The significant drop in the full inelasticity at about 1.6 GeV is mostly determined by , after the opening of the channel. The role of the background in building is small, showing a slow and smooth rise.
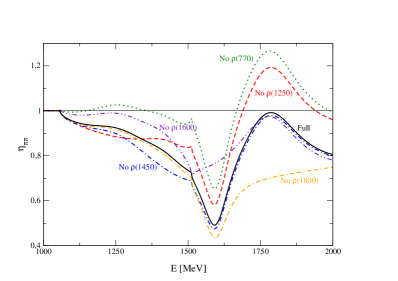
Just as in the case of the phase shift, the energy dependence of the inelasticity for the amplitude without a given resonance, i.e., by omitting all poles associated with it on the different Riemann sheets, is very informative. In Fig. 5, we see that removing would cause the largest change (after that caused by ) to the inelasticity curve as compared to the one due to the full amplitude. Similarly, a significant modification would be caused by leaving out or , but only around 1600 MeV or thereabove, respectively. Finally, also here we observe that without there would only be a modest change to , over a relatively small energy region below 1.5 GeV, having little effect on the shape of the inelasticity curve.
Considering the relationship between resonances and the inelasticity, one should refer to Eqs. (2)–(5). According to unitarity, the Jost functions in Eq. (5) are constructed in such a way that their ratio in the unitary -matrix (Eqs. (1,2)) has a modulus equal to one in the whole elastic region. This is due to the full symmetry between the poles and the zeros there. In the inelastic region (), this symmetry is automatically removed ( is no longer purely imaginary) and the moduli of numerators and denominators are not equal anymore. The large number of complex poles (characteristic of such a multiresonance analysis in a three-channel approach) needed to describe the data and to meet the crossing-symmetry condition naturally leads to various interferences among all these poles, resulting in a total inelasticity consistent with unitarity and the conditions imposed on the fits. Of course, the moduli of the ratios corresponding to individual resonances (i.e., clusters of corresponding poles) do not have to fulfill the unitarity condition of being smaller than 1, as can be seen in Fig. 4. The same is true for the tiny contribution to the inelasticity due to the background term defined in Eq. (6). Only mutual interferences among all resonances (poles) and the background produce the physical (unitary) result. The sometimes reported unitary inelasticity of a particular resonance corresponds to such a physical result (full in Fig. 4), but is limited and calculated in the energy range selected for a given resonance.
IV from an analysis of the pion electromagnetic form factor
Vector isovector mesons below 2 GeV play a very important role in, for example, the determination of the pion electromagnetic (EM) form factor. When analyzing cross sections of production, this form factor appears explicitly and contains information on the dynamics of all these mesons:
| (11) | |||||
where the pion “velocity” , is the amplitude for - mixing interference, and the phase is the -wave phase shift determined at .
An analysis in Ref. PRD96p113004 compared two different approaches to determining . The first one was based on the popular Gounaris-Sakurai (GS) PRL21p244 model constructed by assuming that, for a wide energy range of the elastic region up to 1 GeV, the -wave isovector scattering phase shift satisfies a two-parameter effective-range formula of the Chew-Mandelstam type, i.e.,
| (12) |
where is the pion momentum in the CM system and is a simple logarithmic function of and . The pion EM form factor is then given by
| (13) |
Using the fact that at the left-hand side of Eq. (12) vanishes and, comparing with a Breit-Wigner distribution formula, the first derivative of the phase shift can be given by , one can express directly in terms of the mass and width.
The other approach employed in Ref. PRD96p113004 was based on a very simple unitary and analytic (UA) formula with two symmetric poles and zeroes representing a resonance. The left-hand cut was simulated with one pole (and a symmetric zero). In this way, it was shown PRD96p113004 that fits to experimental cross sections and to elastic phase shifts (from GKPY equation) made independently using the GS model and the UA approach give very different results for the resonance parameters, especially its mass. As one can see in Table 3, the mass difference is much larger than the estimated errors, which are similar in size to those in the PDG tables PDG2020 .
| GS | UA | |
|---|---|---|
| MeV | MeV | |
| MeV | MeV |
More significant differences were found in Ref. PRD96p113004 for the two higher states, in fits to cross sections up to pion momentum squared GeV2. The authors of this analysis pointed out that a generalization of the GS model above the inelastic threshold done in many experimental works
“is without any deeper physical background, as the original G.-S. model for the meson contribution was constructed from the -wave isoscalar scattering phase shift given by the generalized effective- range formula of the Chew-Mandelstam type, which is evidently valid only in the elastic region.”
Nevertheless, to check the quantitative differences between the GS model and the UA approach above 1 GeV, the authors did as in some experimental analyses, i.e., they carried out fits to the data with three states, viz. , , and using the GS model. Then they compared the results to those obtained from their enhanced unitary and analytic amplitude with poles as degrees of freedom. The results are presented in Table 4 and compared to those from the PDG PDG2020 . It is worth noting that the number of free parameters in the UA analysis is smaller (11) than in the GS model (14). And despite the fact that the values of per degree of freedom are 1.84 (UA) and 0.98 (GS), the results of the UA analysis are much more realistic. In particular, we should draw attention to the 171 MeV lower mass found in the UA approach as compared to the GS model, which difference is much larger than the reported errors in Table 4.
| Parameter | PDG (MeV) | GS (MeV) | UA (MeV) |
|---|---|---|---|
| 775.26 0.25 | 774.81 0.01 | 763.88 0.04 | |
| 1465.00 25.00 | 1497.70 1.07 | 1326.35 3.46 | |
| 1720.00 20.00 | 1848.40 0.09 | 1770.54 5.49 | |
| 147.80 0.90 | 149.22 0.01 | 144.28 0.01 | |
| 400.00 60.00 | 442.15 0.54 | 324.13 12.01 | |
| 250.00 100.00 | 322.48 0.69 | 268.98 11.40 | |
| 0.98 | 1.84 | ||
| 14 param. | 11 param. |
Similarly, significant differences can be found in the literature for the mass of the very same resonance, which can often be easily explained by comparing their values found in e.g. BW and simple “pole” approaches. In a BW amplitude, the mass of a resonance is determined by the energy at which the phase shift passes 90∘ ( for two interacting equal-mass particles). The unitary “pole” amplitude (like the UA one used above and in Ref PRD96p113004 ) has, for one single resonance, two symmetric poles (and corresponding zeros) at . Then, the phase shift is given by and it is clear that the value is attained for (i.e., ). This difference gets larger according as increases. For difference between and ”pole” mass defined by real part of is about 8 MeV, which explains the discrepancy seen in Table 3 and found in many other theoretical and experimental analyses PDG2020 . For this discrepancy is several dozen MeV, which is less than the differences seen in Table 4. However, above 1 GeV one is dealing with a few very broad and highly inelastic resonances and a simple reasoning like for is completely insufficient, requiring to also account for other phenomena typical of resonance interference. It is worth noting here that by making fits using the BW and ”pole” approaches and comparing and for the one can additionally request that the decay width be the same in both approaches. Then the difference between these masses is about 5 MeV.
A very good example of such an analysis, which is both qualitative and quantitative in explaining the phase-shift behavior around 1250 MeV and the determination of the pole position in the amplitude, is Ref. ZPC29p107 . In this work entitled “Why is the not Observed in the Scattering ?”, an -matrix parametrization of the and partial amplitudes is analyzed and compared with the parametrization as a sum of the inelastic resonance term and the background amplitude. A most important qualitative conclusion is that even a small inelastic background around 1300 MeV can completely hide a in the channel, leading to a non-resonant behavior there of the phase shifts. The quantitative results of this analysis confirm this conclusion: in order to describe the experimental data very well, a background of only a few degrees around 1300 MeV is sufficient, the real part of the pole then comes out at about 1220 MeV, the width is roughly 320 MeV, and , the latter ratio being in reasonable agreement with the available experimental data PDG2020 .
V Conclusions
The results of our combined analyses unmistakable demonstrate the necessity to include a resonance at about 1.26 GeV. The stability of the fitted pole positions as well as the manifest fulfillment of multichannel unitarity and optimized crossing symmetry in our approach lend strong support to the reliability of our excited states, including the ones at about 1.42 GeV, 1.60 GeV, and 1.78 GeV. Straightforward spectroscopic arguments then impose the following quark-model assignments: /, /, /, and / Confirmation of these four states, which were already found in a previous analysis PRD81p016001 , poses serious problems to mainstream quark models, unless at least is interpreted as a crypto-exotic tetraquark state, for which there is no experimental or theoretical support (also see the discussion of “” above). A at 1.25 GeV is very hard to reconcile with the GI PRD32p189 model and similar ones, based on a Coulomb-plus-linear confining potential with a running strong coupling constant . The only way out would be to consider the GI a “bare” quark-antiquark bound state that upon unitarization turns into the physical resonance, similarly as in the unitarized quark model of Ref. PRD27p1527 . However, the latter model also predicts mass shifts for all other states, especially the ground state , besides employing a completely different confinement mechanism. Therefore, the complete spectrum including unitarization effects would have to be computed again in the GI and similar models, after refitting the parameters. But even more seriously, it is practically inconceivable that the state in the GI model at 2.0 GeV could be lowered by unitarization to 1.6 GeV. The problem is that the radial splitting between the first and second excitation for mesons with light quarks in the GI model is larger than 500 MeV PRD32p189 . This gives rise to huge discrepancies with the observed spectra PDG2020 not only for vector states, but also for tensors like the APPBPS5p1007 ; PRD81p016001 , as already mentioned in Sec. I. Therefore, one must either present very convincing arguments why some of the resonances identified in the present and previous NPA807p145 ; PRD81p016001 analyses should be interpeted as crypto-exotic states, or consider the possibility that the Coulomb-plus-linear confining potential with a running coupling constant is inadequate, at least in the way it is usually implemented in quark models.
Regardless of these considerations, we believe to have made a convincing case for , which should finally be rehabilitated in the PDG tables with a separate entry. Further expertimental analyses that do respect multichannel -matrix unitarity would be most welcome, of course, besides realistic model and lattice calculations accounting for unitarization effects.
The problem with new experimental data is that they will most likely result from production processes and not elastic scattering, making their direct inclusion in an analysis as described in the present paper problematic. A possible way out would be applying the formalism for relating production and scattering amplitudes as outlined in Ref. AP323p1215 to our multichannel -matrix approach. Also this will be a topic of future research.
Acknowledgments
We are indebted to E. van Beveren for providing us with many references concerning the resonance and one of us (G.R.) also for prior collaboration and many discussions on this topic. This work was partly financed by a Polish research project with no. 2018/29/B/ST2/02576 (National Science Center).
References
- (1) P. A. Zyla et al. [Particle Data Group], PTEP 2020, 083C01 (2020).
- (2) S. Godfrey and N. Isgur, Phys. Rev. D 32, 189 (1985).
- (3) G. Rupp, S. Coito, and E. van Beveren, Acta Phys. Polon. Supp. 5, 1007 (2012) [arXiv:1209.1475 [hep-ph]].
- (4) E. Bartos, S. Dubnicka, A. Liptaj, A. Z. Dubnickova, and R. Kaminski, Phys. Rev. D 96, 113004 (2017).
- (5) E. van Beveren, G. Rupp, T. A. Rijken, and C. Dullemond, Phys. Rev. D 27, 1527 (1983).
- (6) G. P. Engel, C. B. Lang, D. Mohler, and A. Schäfer, PoS Hadron 2013, 118 (2013) [arXiv:1311.6579 [hep-ph]].
- (7) S. Prelovsek, L. Leskovec, C. B. Lang, and D. Mohler, Phys. Rev. D 88, 054508 (2013) [arXiv:1307.0736 [hep-lat]].
- (8) M. Luscher, Nucl. Phys. B 354, 531 (1991).
- (9) V. Chaloupka et al. [Particle Data Group], Phys. Lett. B 50, 1 (1974).
- (10) P. Frenkiel, C. Ghesquiere, E. Lillestol, S. U. Chung, J. Diaz, A. Ferrando, and L. Montanet, Nucl. Phys. B 47, 61 (1972).
- (11) R. L. Anderson et al., Phys. Rev. D 1, 27 (1970).
- (12) A. Bramon, Lett. Nuovo Cim. 8, 659 (1973)].
- (13) J. Ballam et al., Nucl. Phys. B 76, 375 (1974).
- (14) M. Conversi, L. Paoluzi, F. Ceradini, and M. Grilli, Phys. Lett. 52B, 493 (1974).
- (15) S. Bartalucci et al., Nuovo Cim. A 39, 374 (1977).
- (16) S. Bartalucci et al., Nuovo Cim. A 49, 207 (1979).
- (17) D. P. Barber et al. [LAMP2 Group], Z. Phys. C 4, 169 (1980).
- (18) D. Aston et al. [Bonn-CERN-Ecole Poly-Glasgow-Lancaster-Manchester-Orsay-Paris-Rutherford-Sheffield Collaboration], Phys. Lett. B 92, 211 (1980) [Erratum-ibid 95, 461 (1980)].
- (19) L. M. Kurdadze et al., JETP Lett. 37, 733 (1983) [Pisma Zh. Eksp. Teor. Fiz. 37, 613 (1983)].
- (20) S. B. Gerasimov and A. B. Govorkov, Z. Phys. C 13, 43 (1982).
- (21) V. K. Henner, Z. Phys. C 29, 107 (1985).
- (22) M. Aguilar-Benitez et al. [Particle Data Group], Phys. Lett. B 170, 1 (1986).
- (23) A. Donnachie and H. Mirzaie, Z. Phys. C 33, 407 (1987).
- (24) G. P. Yost et al. [Particle Data Group], Phys. Lett. B 204, 1 (1988).
- (25) A. Donnachie and A. B. Clegg, Phys. Lett. B 269, 450 (1991).
- (26) D. Aston et al., Nucl. Phys. B Proc. Suppl. 21, 105 (1991).
- (27) V. K. Henner and D. N. Wolfson, Nuovo Cim. A 107, 2511 (1994).
- (28) A. Donnachie and Y. S. Kalashnikova, Z. Phys. C 59, 621 (1993).
- (29) A. Donnachie, Y. S. Kalashnikova, and A. B. Clegg, Z. Phys. C 60, 187 (1993).
- (30) A. B. Clegg and A. Donnachie, Z. Phys. C 62, 455 (1994).
- (31) A. Donnachie and Y. S. Kalashnikova, Phys. Rev. D 60, 114011 (1999) [arXiv:hep-ph/9901334].
- (32) A. Bertin et al. [OBELIX Collaboration], Phys. Lett. B 414, 220 (1997).
- (33) Y. S. Surovtsev and P. Bydzovsky, Nucl. Phys. A 807, 145 (2008).
- (34) Y. S. Surovtsev, P. Bydzovsky, R. Kaminski, and M. Nagy, Phys. Rev. D 81, 016001 (2010).
- (35) D. V. Bugg, Phys. Rept. 397, 257 (2004) [arXiv:hep-ex/0412045].
- (36) P. Bydzovsky, R. Kaminski, and V. Nazari, Phys. Rev. D 94, 116013 (2016) [arXiv:1611.10070 [hep-ph]].
-
(37)
V. Nazari, ”Study on Spectroscopy of Light Mesons”, PhD thesis, Institute of Nuclear Physics, Polish Academy of Sciences,
February 2017.
In order to obtain an electronic copy, please send an email to vahabnazari@gmail.com - (38) R. Garcia-Martin, R. Kaminski, J. R. Pelaez, J. Ruiz de Elvira, and F. J. Yndurain, Phys. Rev. D 83, 074004 (2011) [arXiv:1102.2183 [hep-ph]].
- (39) S. M. Roy, Phys. Lett. B 36, 353 (1971).
- (40) J. R. Batley et al. (NA48/2 Collaboration). Eur. Phys. J. C 54, 411, (2008).
- (41) S. Pislak et al. (BNL-E865 Collaboration). Phys. Rev. Lett. 87, 221801, (2011).
- (42) S. D. Protopopescu et al. Phys. Rev. D 7, 1279, (1973).
- (43) B. Hyams et al. Nucl. Phys. B 64, 134, (1973).
- (44) P. Estabrooks and A. D. Martin. Nucl. Phys. B 79, 301, (1974).
- (45) B. Hyams et al. Nucl. Phys. B 100, 205, (1975).
- (46) S. Coito, G. Rupp, and E. van Beveren, Eur. Phys. J. C 71, 1762 (2011) [arXiv:1008.5100 [hep-ph]].
- (47) G. J. Gounaris and J. J. Sakurai, Phys. Rev. Lett. 21, 244 (1968).
- (48) E. van Beveren and G. Rupp, Annals Phys. 323, 1215 (2008) [arXiv:0706.4119 [hep-ph]].