Reddening-free indices to identify Be star candidates
Abstract
Astronomical databases currently provide high-volume spectroscopic and photometric data. While spectroscopic data is better suited to the analysis of many astronomical objects, photometric data is relatively easier to obtain due to shorter telescope usage time. Therefore, there is a growing need to use photometric information to automatically identify objects for further detailed studies, specially H emission line stars such as Be stars. Photometric color-color diagrams (CCDs) are commonly used to identify this kind of objects. However, their identification in CCDs is further complicated by the reddening effect caused by both the circumstellar and interstellar gas. This effect prevents the generalization of candidate identification systems. Therefore, in this work we evaluate the use of neural networks to identify Be star candidates from a set of OB-type stars. The networks are trained using a labeled subset of the VPHAS+ and 2MASS databases, with filters H, and . In order to avoid the reddening effect, we propose and evaluate the use of reddening-free indices to enhance the generalization of the model to other databases and objects. To test the validity of the approach, we manually labeled a subset of the database, and use it to evaluate candidate identification models. We also labeled an independent dataset for cross dataset evaluation. We evaluate the recall of the models at a 99% precision level on both test sets. Our results show that the proposed features provide a significant improvement over the original filter magnitudes.
Keywords:
Stellar Classification OB-type stars Be stars VPHAS+ 2MASS IPHAS SDSS LAMOST1 Introduction
In the big data era, free access to databases in different wavelength ranges, from gamma-rays to radio waves, together with machine-learning methods, has drastically incremented the possibility to study and identify different types of peculiar line-emission stars using photometric information (e.g., Vioque et al., 2019 [30]; Akras et al., 2019 [2]; Pérez-Ortiz et al., 2017 [21]).
While spectroscopic techniques are excellent to perform accurate stellar classification and deepen into the study of various spectral features, the telescope time required to obtain such information is longer compared to obtaining photometric data.
The goal of this work is then to use the potential of photometric data to search for emission-line star candidates. These can be later observed and be confirmed spectroscopically as such. Particularly, we are interested in detecting Be star candidates.
Be stars are emission-line objects that rotate at high speed (Jaschek et al., 1981 [15]; Struve, O., 1931 [28]) and constitute unique astrophysical laboratories. They are of interest in various branches of stellar physics dedicated to the study of mechanisms of mass loss, angular momentum distribution, astroseismology, among others.
The rest of this section describes Be stars in detail, classical techniques to detect plausible candidates as well as previous star candidate proposals based on machine-learning methods.
1.1 Be stars
Be stars are defined as non-supergiant spectral B-type stars that exhibit, or have exhibited, one or more hydrogen lines in emission (Jaschek et al., 1981 [15]; Collins, II, G., 1987 [7]), particularly the H line. In some cases, it is also possible to observe the presence of once-ionized helium and metal lines in emission. Thus, this definition not only applies to B-type stars but also to late O- and early A-type stars.
The analysis of spectrophotometric observations of Be stars at different wavelengths, combined with interferometric and polarimetric data (Gies et al., 2007 [11]; Meilland et al., 2007 [18], among others), indicate that the different properties shown by these stars could be interpreted by the existence of an optically-thin gaseous circumstellar equatorial disk in Keplerian motion (see Rivinius et al., 2013 [25]). This suggests that the high rotation speed would play a significant role in the development of the equatorial disk (e.g., Struve, O., 1931 [28]; Huang, S., 1972 [14]; Quirrenbach, A., 1993 [23]; Quirrenbach et al., 1994 [24]; Hirata, R., 1995 [13]). However, despite the increasing observational evidence that Be stars do not rotate at their critical rotational speed (Zorec et al. 2016 [31], Zorec et al. 2017 [32], Aidelman et al. 2018 [1], Cochetti et al., 2019 [6]), there is still no consensus on disk formation mechanism(s).
Other observed effects induced by stellar rotation during the main sequence phase of hot stars, are the development of axi-symmetric winds, the modification in pulsation modes, changes in metallicity or the presence of magnetic fields (see Peters et al., 2020 [22]; Rivinius et al., 2013 [25]). These properties make Be stars perfect stellar laboratories, of interest in different astrophysical topics, as mentioned above.
In this context, the discovery, classification and analysis of a considerable sample of Be stars in different environments are necessary to understand their nature.
1.2 Related work
To the best of our knowledge, there are no previous works focused on Be stars that use the reddening-free indices as we propose in this work (see section 2.2). Therefore we briefly summarize work similar to ours.
Pérez-Ortiz et al. (2017 [21]) select Be star candidates using light curves of the band obtained from OGLE-IV data (Udalski et al., 2015 [29]). They train classification trees, random forest, gradient boosted trees, support vector machines (SVM) and K-nearest neighbours on OGLE-III data. To evaluate the models, they compare the average f-score from 10-fold cross validation. While random forests achieve the best scores, most models behave similarly. To improve the cross-dataset robustness of their models, they employ a custom feature based on fourier coefficients of the data. They propose 50 new Be star candidates selected from OGLE-IV data.
Vioque et al., (2019 [30]) use photometric data similar to ours which includes a passband filter for the H wavelength. However, their sources include many other filters, resulting in 48 variables for each sample. In order to avoid problems caused by interstellar extinction, they select objects for which the effect of this phenomena is negligible. They apply Principal Component Analysis (PCA) to reduce the features to a 12 latent dimensions which contain 99.99% of variability. Afterwards, they employ a neural network composed of three linear layers to classify candidates.
Akras et al., (2019 [2]) identify symbiotic stars from other objects. Their data includes various photometric filters that can detect H. They perform a thorough manual evaluation of color-color111A color index is defined as the difference of two magnitudes at different wavelengths (). Magnitude is a unitless measure of the brightness of an object on a logarithmic scale in a defined passband. The brighter an object, the more negative the value of its magnitude diagrams (CCDs) to identify feature combinations which can separate these stars from other kinds of similar objects. Afterwards, they repeat this approach to classify symbiotic stars into subsets. Their approach can identify a small subset of previously labeled symbiotic stars and also proposes 125 new candidates. They employ a combination of k-nearest neighbours, linear discriminant analysis, and classification trees as models.
1.3 Proposed work
One technique commonly used to identify classical Be star candidates relies on photometric color-color diagrams. These diagrams use differences of apparent magnitudes between narrow-band filters, such as H passband, and broad-band filters centered at other given wavelengths, such as the filters or . However, these colors are affected by interstellar extinction. Therefore, in this work we propose to use the reddening-free photometric indices, as described in section 2.2.
The construction of the indices from different apparent magnitudes opens up the potential of broad-band and narrow-band photometric data together with machine-learning techniques to quickly obtain a significant number of Be star candidates observed in any direction in the sky. Subsequently, this method will allow us to carry out a rapid and accurate spectroscopic follow-up of these stars to confirm their classification and properties.
2 Datasets and Features
2.1 Datasets
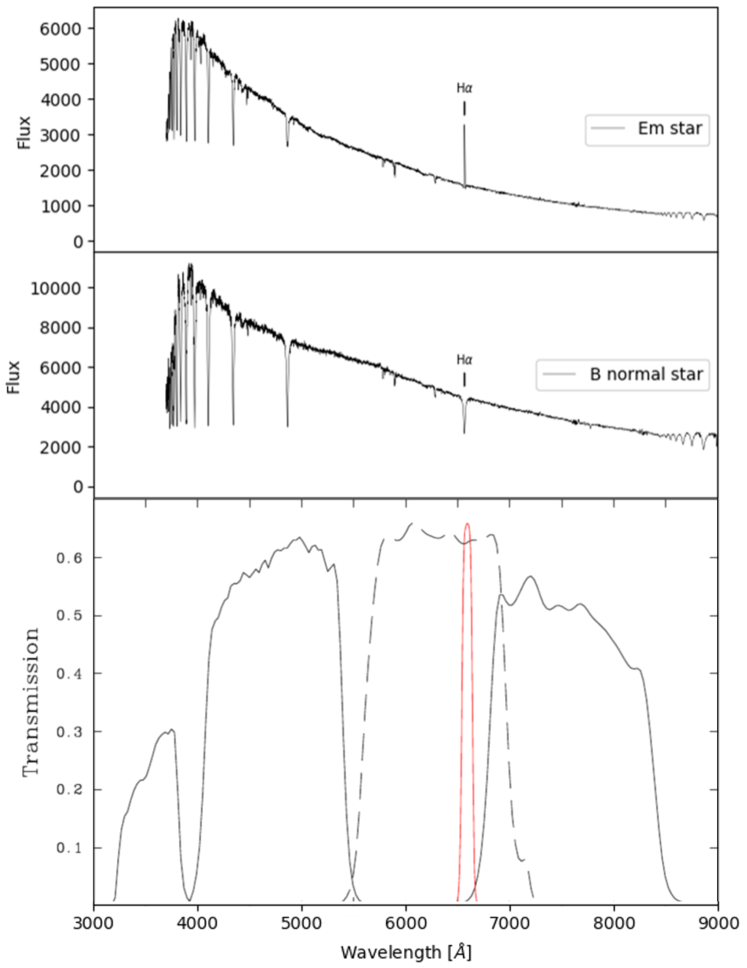
We use the data published by Mohr-Smith et al. (2017 [20]) on the Carina Arm region (). These authors used data from the VST Photometric H Survey of the Southern Galactic Plane and Bulge (VPHAS+; Drew et al., 2014 [10]) in , H, filters (see Figure 1 bottom panel) combined with magnitudes from the Two Micron All Sky Survey (2MASS; Skrutskie et al., 2006 [27]). Performing fittings to the spectral energy distribution, Mohr-Smith et al. grouped the sample of OB-type stars in four groups: emission-line stars (EM), sub- and over-luminous stars, and normal stars. The features of the dataset consist of the fluxes at the 8 filters mentioned above. The dataset contains a sample of OB-type stars labeled with four classes. Since we are only interested in detecting emission-line stars from the other classes, we group all non-EM stars into a single set called Normal OB. The resulting class distribution is shown in Table 1.
To test the inter-database accuracy of the model, we manually labeled a subset of OB-type stars classified spectroscopically by Liu et al. (2019 [17]). The photometric data of this subset was obtained from VPHAS+ dr2 (for the southern hemisphere). Data in filters , H were from the INT Photometric H Survey of the Northern Galactic Plane (IPHAS dr2; Barentsen et al., 2014 [4]) while the data in filters were obtained from the Sloan Digital Sky Survey (SDSS dr12; Alam et a., 2015 [3]), for the northern hemisphere. Additionally, the data in filters for both hemispheres were obtained from the 2MASS. Spectroscopic data is available from the Large Sky Area Multi-Object Fiber Spectroscopic Telescope (LAMOST dr5; Cui et al, 2012 [8]).
We selected stars which have both photometric and spectroscopic data. Among the 22901 OB-stars classified by Liu, only 1113 have measurements for the same set of 8 filters used by Mohr-Smith et al.
Via visual inspection of the spectra, we were able to label 283 stars (among 1113 OB-stars with photometry). We identified OB-stars that present the H line in emission (see Figure 1 middle and upper panel). As shown in Table 1, we identify 98 objects as EM stars.
| Dataset | Normal OB | EM | Total |
|---|---|---|---|
| Mohr-Smith et al. (2017 [20]) | 5629 | 248 | 5877 |
| Liu et al. (2019 [17]) | 185 | 98 | 283 |
2.2 Features
As mentioned in Section 2.1, the data used corresponds to magnitudes (hereinafter original features) obtained in seven different broad-band filters: , , , , , , and , and in one narrow-band filter, H. However, the intrinsic magnitude of an object can be affected by several factors, such as the distance to the star and the interstellar extinction. Particularly, in the latter, the interstellar material (dust and gas) located between the observer and the object absorbs part of its radiation (mainly ultraviolet light). A priori, neither the amount of interstellar material in the visual direction nor the distance to the star are known. For these reasons, the use of magnitudes (available in the databases) as a tool to try to classify objects of different morphology or characteristics is not enough.
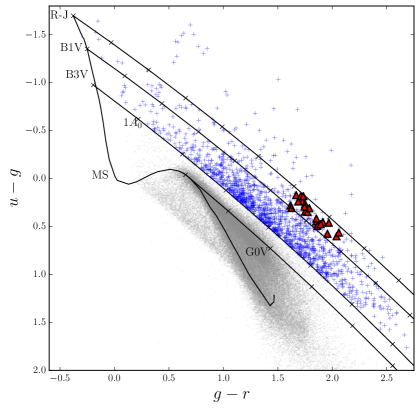
On the other hand, although the color index is independent of distance, it is still affected by interstellar reddening, as shown in Figure 2. The left panel shows the CCD done by Mohr-Smith et al. (2015 [19]) with the stars detected in the Carina Arm region (gray dots). The blue crosses represent B-type stars whose location in the diagram is affected by the interstellar extinction.
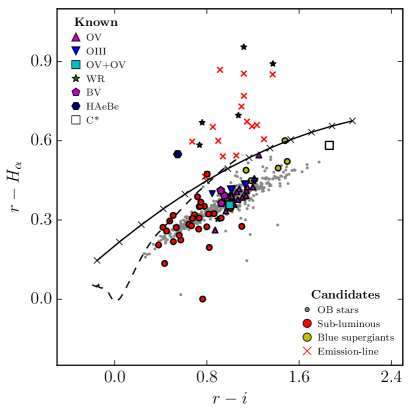
In particular, as previously mentioned, one technique commonly used to identify classical Be star candidates is to use CCDs that combine a narrow-band filter centered at the H line and a filter that samples the nearby continuum region. Figure 2 (right panel) shows () versus () diagram with the location of stars with different characteristics (Mohr-Smith et al., 2015 [19]). As seen in this figure, Be stars (red crosses) are separated from other objects because they show an excess emission in H. However, the presence of other astrophysical sources, such as Wolf Rayet (WR) and Herbig AeBe (HAeBe) stars, in the same region can still be observed.
For all the aforementioned, in order to avoid the effects of interstellar extinction and distance, we propose the use of the reddening-free indices (hereinafter features). This index was introduced by Johnson & Morgan, (1955 [16]) and it is defined as:
| (1) |
where is the apparent (observed) magnitude and is the apparent magnitude corrected by interstellar extinction effect in four (in some cases three) different filters centered at given wavelength , , were and are the extinction coefficient for and for the 222Filter corresponds to Johnson’s photometric system. filter, respectively. The values adopted in this work were those calculated by Schlafly et al. (2011 [26]) for a selective absorption coefficient333The selective absorption coefficient relates the absorption coefficient in the visual, , with the excess color , through the ratio . .
3 Experiments
3.1 Metodology
In order to test the suitability of the features, we trained and evaluated models with the original magnitudes and the features, separately. Additionally, we use Neighborhood Components Analysis (NCA; Goldberg et al., 2005 [12]) to perform dimensionality reduction to 2 components from the 56 variables of the features (built with the combinations of the 8 original magnitudes taken from 3) and generate another set of features (see Table 2). The 2-dimensional projection obtained by NCA can provide diagrams similar to the CCD commonly used in astronomy, albeit using latent variables (see section 3.2).
We also compare different models in terms of their relative performances. We use a simple logistic regression as a baseline, and compare it against Support Vector Machines (SVM) with Linear and Gaussian kernels, with in both cases. We also compare Neural Networks with 1 hidden layer with linear units and activation function.
Given that candidate selection is essentially a binary classification task, the most natural overall performance metric is the F-score. However, since the goal of our work is to avoid manual verification of stars with a low probability of being Be stars, we focus on reducing the number of selected candidates. Therefore, we prefer to evaluate models in terms of their recall at a 99% level of precision444We note that Purity and Completeness are commonly used as synonyms for Precision and Recall, respectively. These terms are more prevalent in astronomy.. That is, for each model we set a threshold so that its precision is around 99% and measure the resulting recall.
All models are trained on the Mohr-Smith dataset (see Section 2.1). Given the small sample size of the datasets, we use random subsampling cross validation with random splits to obtain average values of each measure. We perform a 90/10 split, obtaining train/test sizes of approximately and samples. For each split, a model is trained on Mohr-Smith, and evaluated on its test set. Afterwards, the same model is evaluated on the Liu dataset, using all samples as a test set. The same threshold used to obtain 99% precision for Mohr-Smith is also employed when evaluating the Liu dataset.
3.2 Results
Table 3 shows the recall rate for various model and feature combinations. The best result on the Liu dataset was obtained with Neural Network using features, obtaining a 25% recall rate. For the Mohr-Smith dataset, all models perform similarly.
Linear models, however, don’t generalize as well as non-linear models for Liu. Nonetheless, a simple linear model with a non-linear dimensionality reduction such as NCA (Figure 4) can obtain almost 14% recall in Liu. This indicates that the classes are not linearly separable even in the 56 dimensional space of the features.
In the case of SVM, results are somewhat erratic (Figure 3). This may be due to the fact that calibrating a SVM to output probabilities is usually difficult, given that the probability estimation model must be fitted on top of the SVM after the model is trained.
Given the recall increment when using features (%) from the best model using magnitudes (Gaussian SVM) to the best model using features (Neural Network), we can conclude that these features indeed help with the identification of H emitting stars.
| Model | Features | Mohr-Smith (Recall) | Liu (Recall) |
|---|---|---|---|
| Log. Regression | Magnitudes | 84.2 (7)% | 5.7 (0.1)% |
| Log. Regression | 81.3 (12)% | 5.5 (10)% | |
| Log. Regression | NCA | 74.6(11)% | 13.9 (9)% |
| SVM (Linear) | Magnitudes | 82.4(14)% | 0(0)% |
| SVM (Linear) | 85.2(9)% | 9.2 (11)% | |
| SVM (Gaussian) | Magnitudes | 85.2(11)% | 13.1 (2)% |
| SVM (Gaussian) | 37.2(3)% | 4.7 (3)% | |
| Neural Network | Magnitudes | 84.8(8)% | 9.5(4)% |
| Neural Network | 85.2(14)% | 25 ()% |
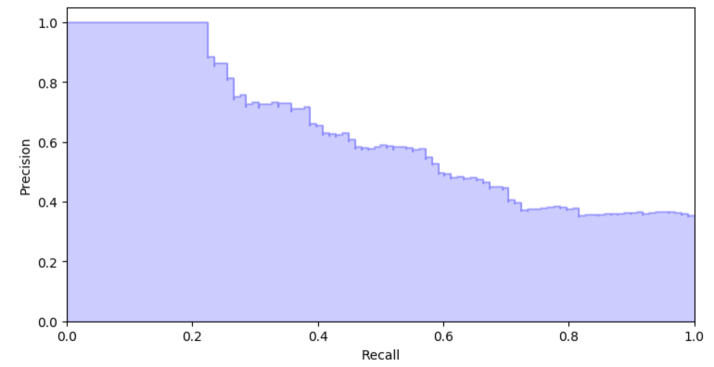
Figure 3 shows precision-recall curves evaluated in Liu dataset for a Neural Network model using the features. As listed in Table 3, the model achieves a 25% recall rate with 100% precision. For larger values of recall, precision rates drop in an approximately linear fashion, which indicates a good balance between these two metrics.
3.3 Recall Rate Analysis
We plot the 2-dimensional NCA features for both test set of Mohr-Smith and Liu (Figure 4). As can be seen in the figure, a significant number of EM stars fall in the region of normal OB stars, and vice versa. For this reason, we decided to visually inspect the spectra of some objects in which this situation occurred.
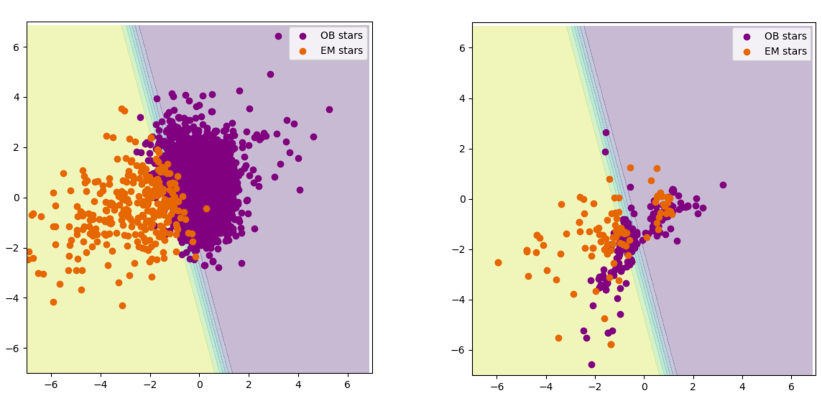
The high number of false-negative cases (reflected in the low recall rate) may be due to the detection limits existing in each observation technique. In most of the objects classified as false negatives, the H line profile is observed with the wings in emission (absorption) and the nucleus in absorption (emission) (Catanzaro, G., 2013 [5]; Dimitrov et al., 2018 [9]). However, if the emission is not intense enough, it is not reflected in the photometry since the values of the color indices and parameters correspond to that of a normal star.
On the other hand, false-negative and false-positive cases may also be due to the variability of the Be phenomenon. This effect is probably due to a significant increase in the circumstellar material that intensifies the emission in H. Subsequently, this intensity decreases with time and may disappear completely (Rivinius et al., 2013 [25]; Dimitrov et al., 2018 [9]). Since the photometric and spectroscopic data are not simultaneous, it may happen that the photometric data does not reflect an emission in the H passband even if the emission H line in the spectrum is observed. Therefore, for a correct photometric classification of these stars, it is necessary to carry out spectroscopic follow-up close in time between both observation modes.
4 Conclusions and Future Work
In this work, we have compared different classification models to distinguish objects with emission in the H line from normal OB stars. The models are trained with photometric data collected from various sources. Afterward, these models can be employed to identify Be star candidates, a type of H emitting OB stars.
We also propose the use of the reddening-free indices to remove unwanted variations caused by interstellar extinction effects. Experiments show these features improve the cross-dataset performance of the classification models, obtaining up to 25% recall for 99% precision on an unseen dataset. Meanwhile, the best model trained with the original features obtains at most 13.1% recall at the same precision level.
In order to test the cross-dataset performance of the models, we manually labeled samples obtained from different sources to form a new test set. Posterior analysis shows that there is significant variability in the cross-dataset test samples, which the model cannot learn given the original training data.
The presented models can detect H emitting stars, which are good candidates for Be stars. However, confirmation requires spectroscopic follow up. We plan on expanding the pipeline and train classification models to also identify different classes of H emitting objects, including Be stars, with a higher degree of automation. We will also focus on expanding the data sources used, in order to both train a more robust model and test with more variable sets of objects.
Acknowledgements
This work is based on data obtained as part of the INT H photometric study of the northern galactic plane (IPHAS; https://www.iphas.org), VST Photometric H Survey of the Southern Galactic Plane and Bulge (VPHAS+; https://www.vphasplus.org), Two Micron All Sky Survey (2MASS, https://irsa.ipac.caltech.edu/Missions/2mass.html), Sloan Digital Sky Survey (SDSS; https://www.sdss.org) and The Large Sky Area Multi-Object Fibre Spectroscopic Telescope (LAMOST; http://www.lamost.org).
YA is grateful to L. Cidale, G. Baume and A. Smith Castelli for their helpful comments and suggestions.
References
- [1] Aidelman, Y., Cidale, L.S., Zorec, J., Panei, J.A.: Open clusters. III. Fundamental parameters of B stars in NGC 6087, NGC 6250, NGC 6383, and NGC 6530 B-type stars with circumstellar envelopes. A&A610, A30 (Feb 2018). https://doi.org/10.1051/0004-6361/201730995
- [2] Akras, S., Leal-Ferreira, M.L., Guzman-Ramirez, L., Ramos-Larios, G.: A machine learning approach for identification and classification of symbiotic stars using 2MASS and WISE. MNRAS483(4), 5077–5104 (Mar 2019). https://doi.org/10.1093/mnras/sty3359
- [3] Alam, S., Albareti, F.D., Prieto, C.A., Anders, F., Anderson, S.F., Anderton, T., Andrews, B.H., Armengaud, E., Aubourg, É., Bailey, S., et al.: The eleventh and twelfth data releases of the sloan digital sky survey: final data from sdss-iii. The Astrophysical Journal Supplement Series 219(1), 12 (2015)
- [4] Barentsen, G., Farnhill, H.J., Drew, J., González-Solares, E., Greimel, R., Irwin, M.J., Miszalski, B., Ruhland, C., Groot, P., Mampaso, A., et al.: The second data release of the int photometric h survey of the northern galactic plane (iphas dr2). Monthly Notices of the Royal Astronomical Society 444(4), 3230–3257 (2014)
- [5] Catanzaro, G.: Spectroscopic atlas of H and H in a sample of northern Be stars. A&A550, A79 (Feb 2013). https://doi.org/10.1051/0004-6361/201220357
- [6] Cochetti, Y.R., Arcos, C., Kanaan, S., Meilland, A., Cidale, L.S., Curé, M.: Spectro-interferometric observations of a sample of Be stars. Setting limits to the geometry and kinematics of stable Be disks. A&A621, A123 (Jan 2019). https://doi.org/10.1051/0004-6361/201833551
- [7] Collins, II, G.W.: The use of terms and definitions in the study of Be stars. In: Slettebak, A., Snow, T.P. (eds.) IAU Colloq. 92: Physics of Be Stars. pp. 3–19 (1987)
- [8] Cui, X.Q., Zhao, Y.H., Chu, Y.Q., Li, G.P., Li, Q., Zhang, L.P., Su, H.J., Yao, Z.Q., Wang, Y.N., Xing, X.Z., Li, X.N., Zhu, Y.T., Wang, G., Gu, B.Z., Luo, A.L., Xu, X.Q., Zhang, Z.C., Liu, G.R., Zhang, H.T., Yang, D.H., Cao, S.Y., Chen, H.Y., Chen, J.J., Chen, K.X., Chen, Y., Chu, J.R., Feng, L., Gong, X.F., Hou, Y.H., Hu, H.Z., Hu, N.S., Hu, Z.W., Jia, L., Jiang, F.H., Jiang, X., Jiang, Z.B., Jin, G., Li, A.H., Li, Y., Li, Y.P., Liu, G.Q., Liu, Z.G., Lu, W.Z., Mao, Y.D., Men, L., Qi, Y.J., Qi, Z.X., Shi, H.M., Tang, Z.H., Tao, Q.S., Wang, D.Q., Wang, D., Wang, G.M., Wang, H., Wang, J.N., Wang, J., Wang, J.L., Wang, J.P., Wang, L., Wang, S.Q., Wang, Y., Wang, Y.F., Xu, L.Z., Xu, Y., Yang, S.H., Yu, Y., Yuan, H., Yuan, X.Y., Zhai, C., Zhang, J., Zhang, Y.X., Zhang, Y., Zhao, M., Zhou, F., Zhou, G.H., Zhu, J., Zou, S.C.: The Large Sky Area Multi-Object Fiber Spectroscopic Telescope (LAMOST). Research in Astronomy and Astrophysics 12(9), 1197–1242 (Sep 2012). https://doi.org/10.1088/1674-4527/12/9/003
- [9] Dimitrov, D.P., Kjurkchieva, D.P., Ivanov, E.I.: A Study of the H Variability of Be Stars. AJ156(2), 61 (Aug 2018). https://doi.org/10.3847/1538-3881/aacbd8
- [10] Drew, J.E., Gonzalez-Solares, E., Greimel, R., Irwin, M.J., Küpcü Yoldas, A., Lewis, J., Barentsen, G., Eislöffel, J., Farnhill, H.J., Martin, W.E., Walsh, J.R., Walton, N.A., Mohr-Smith, M., Raddi, R., Sale, S.E., Wright, N.J., Groot, P., Barlow, M.J., Corradi, R.L.M., Drake, J.J., Fabregat, J., Frew, D.J., Gänsicke, B.T., Knigge, C., Mampaso, A., Morris, R.A.H., Naylor, T., Parker, Q.A., Phillipps, S., Ruhland, C., Steeghs, D., Unruh, Y.C., Vink, J.S., Wesson, R., Zijlstra, A.A.: The VST Photometric H Survey of the Southern Galactic Plane and Bulge (VPHAS+). MNRAS440(3), 2036–2058 (May 2014). https://doi.org/10.1093/mnras/stu394
- [11] Gies, D.R., Bagnuolo, Jr., W.G., Baines, E.K., ten Brummelaar, T.A., Farrington, C.D., Goldfinger, P.J., Grundstrom, E.D., Huang, W., McAlister, H.A., Mérand, A., Sturmann, J., Sturmann, L., Touhami, Y., Turner, N.H., Wingert, D.W., Berger, D.H., McSwain, M.V., Aufdenberg, J.P., Ridgway, S.T., Cochran, A.L., Lester, D.F., Sterling, N.C., Bjorkman, J.E., Bjorkman, K.S., Koubský, P.: CHARA Array K’-Band Measurements of the Angular Dimensions of Be Star Disks. ApJ654, 527–543 (Jan 2007). https://doi.org/10.1086/509144
- [12] Goldberger, J., Hinton, G.E., Roweis, S.T., Salakhutdinov, R.R.: Neighbourhood components analysis. In: Advances in neural information processing systems. pp. 513–520 (2005)
- [13] Hirata, R.: Interpretation of the Long-Term Variation in Late-Type Active Be Stars. PASJ47, 195–218 (Apr 1995)
- [14] Huang, S.S.: Profiles of Emission Lines in be Stars. ApJ171, 549 (Feb 1972). https://doi.org/10.1086/151309
- [15] Jaschek, M., Slettebak, A., Jaschek, C.: Be star terminology. Be Star Newsletter (1981)
- [16] Johnson, H.L., Morgan, W.W.: Some Evidence for a Regional Variation in the Law of Interstellar Reddening. ApJ122, 142 (Jul 1955). https://doi.org/10.1086/146063
- [17] Liu, Z., Cui, W., Liu, C., Huang, Y., Zhao, G., Zhang, B.: A Catalog of OB Stars from LAMOST Spectroscopic Survey. ApJS241(2), 32 (Apr 2019). https://doi.org/10.3847/1538-4365/ab0a0d
- [18] Meilland, A., Stee, P., Vannier, M., Millour, F., Domiciano de Souza, A., Malbet, F., Martayan, C., Paresce, F., Petrov, R.G., Richichi, A., Spang, A.: First direct detection of a Keplerian rotating disk around the Be star Arae using AMBER/VLTI. A&A464, 59–71 (Mar 2007). https://doi.org/10.1051/0004-6361:20064848
- [19] Mohr-Smith, M., Drew, J.E., Barentsen, G., Wright, N.J., Napiwotzki, R., Corradi, R.L.M., Eislöffel, J., Groot, P., Kalari, V., Parker, Q.A., Raddi, R., Sale, S.E., Unruh, Y.C., Vink, J.S., Wesson, R.: New OB star candidates in the Carina Arm around Westerlund 2 from VPHAS+. MNRAS450(4), 3855–3873 (Jul 2015). https://doi.org/10.1093/mnras/stv843
- [20] Mohr-Smith, M., Drew, J.E., Napiwotzki, R., Simón-Díaz, S., Wright, N.J., Barentsen, G., Eislöffel, J., Farnhill, H.J., Greimel, R., Monguió, M., Kalari, V., Parker, Q.A., Vink, J.S.: The deep OB star population in Carina from the VST Photometric H Survey (VPHAS+). MNRAS465(2), 1807–1830 (Feb 2017). https://doi.org/10.1093/mnras/stw2751
- [21] Pérez-Ortiz, M.F., García-Varela, A., Quiroz, A.J., Sabogal, B.E., Hernández, J.: Machine learning techniques to select Be star candidates. An application in the OGLE-IV Gaia south ecliptic pole field. A&A605, A123 (Sep 2017). https://doi.org/10.1051/0004-6361/201628937
- [22] Peters, M., Wisniewski, J.P., Williams, B.F., Lomax, J.R., Choi, Y., Durbin, M., Johnson, L.C., Lewis, A.R., Lutz, J., Sigut, T.A.A., Wallach, A., Dalcanton, J.J.: The Hubble Space Telescope Advanced Camera for Surveys Emission Line Survey of Andromeda. I. Classical Be Stars. AJ159(3), 119 (Mar 2020). https://doi.org/10.3847/1538-3881/ab6d74
- [23] Quirrenbach, A.: Seven Be Stars Resolved by Optical Interferometry. In: American Astronomical Society Meeting Abstracts #182. Bulletin of the American Astronomical Society, vol. 25, p. 916 (May 1993)
- [24] Quirrenbach, A., Buscher, D.F., Mozurkewich, D., Hummel, C.A., Armstrong, J.T.: Maximum-entropy maps of the Be shell star zeta Tauri from optical long-baseline interferometry. A&A283, L13–L16 (Mar 1994)
- [25] Rivinius, T., Carciofi, A.C., Martayan, C.: Classical Be stars. Rapidly rotating B stars with viscous Keplerian decretion disks. A&A Rev.21, 69 (Oct 2013). https://doi.org/10.1007/s00159-013-0069-0
- [26] Schlafly, E.F., Finkbeiner, D.P.: Measuring Reddening with Sloan Digital Sky Survey Stellar Spectra and Recalibrating SFD. ApJ737(2), 103 (Aug 2011). https://doi.org/10.1088/0004-637X/737/2/103
- [27] Skrutskie, M.F., Cutri, R.M., Stiening, R., Weinberg, M.D., Schneider, S., Carpenter, J.M., Beichman, C., Capps, R., Chester, T., Elias, J., Huchra, J., Liebert, J., Lonsdale, C., Monet, D.G., Price, S., Seitzer, P., Jarrett, T., Kirkpatrick, J.D., Gizis, J.E., Howard, E., Evans, T., Fowler, J., Fullmer, L., Hurt, R., Light, R., Kopan, E.L., Marsh, K.A., McCallon, H.L., Tam, R., Van Dyk, S., Wheelock, S.: The Two Micron All Sky Survey (2MASS). AJ131(2), 1163–1183 (Feb 2006). https://doi.org/10.1086/498708
- [28] Struve, O.: On the Origin of Bright Lines in Spectra of Stars of Class B. ApJ73, 94 (Mar 1931). https://doi.org/10.1086/143298
- [29] Udalski, A., Szymański, M., Szymański, G.: Ogle-iv: fourth phase of the optical gravitational lensing experiment. arXiv preprint arXiv:1504.05966 (2015)
- [30] Vioque, M., Oudmaijer, R., Baines, D., Pérez-Martínez, R.: New catalogue of intermediate mass Pre-Main Sequence objects in Gaia DR2 using Machine Learning. In: The Gaia Universe. p. 52 (Apr 2019). https://doi.org/10.5281/zenodo.3237084
- [31] Zorec, J., Frémat, Y., Domiciano de Souza, A., Royer, F., Cidale, L., Hubert, A.M., Semaan, T., Martayan, C., Cochetti, Y.R., Arias, M.L., Aidelman, Y., Stee, P.: Critical study of the distribution of rotational velocities of Be stars. I. Deconvolution methods, effects due to gravity darkening, macroturbulence, and binarity. A&A595, A132 (Nov 2016). https://doi.org/10.1051/0004-6361/201628760
- [32] Zorec, J., Frémat, Y., Domiciano de Souza, A., Royer, F., Cidale, L., Hubert, A.M., Semaan, T., Martayan, C., Cochetti, Y.R., Arias, M.L., Aidelman, Y., Stee, P.: Critical study of the distribution of rotational velocities of Be stars. II: Differential rotation and some hidden effects interfering with the interpretation of the V sin I parameter. A&A602, A83 (Jun 2017). https://doi.org/10.1051/0004-6361/201628761