Unveiling the stellar origin of the Wolf-Rayet nebula NGC 6888 through infrared observations
Abstract
We present a comprehensive infrared (IR) study of the iconic Wolf-Rayet (WR) wind-blown bubble NGC 6888 around WR 136. We use Wide-field Infrared Survey Explorer (WISE), Spitzer IRAC and MIPS and Herschel PACS IR images to produce a sharp view of the distribution of dust around WR 136. We complement these IR photometric observations with Spitzer IRS spectra in the 5–38 m wavelength range. The unprecedented high-resolution IR images allowed us to produce a clean spectral energy distribution, free of contamination from material along the line of sight, to model the properties of the dust in NGC 6888. We use the spectral synthesis code Cloudy to produce a model for NGC 6888 that consistently reproduces its optical and IR properties. Our best model requires a double distribution with the inner shell composed only of gas, whilst the outer shell requires a mix of gas and dust. The dust consists of two populations of grain sizes, one with small sized grains =[0.002–0.008] m and another one with large sized grains =[0.05–0.5] m. The population of big grains is similar to that reported for other red supergiants stars and dominates the total dust mass, which leads us to suggest that the current mass of NGC 6888 is purely due to material ejected from WR 136, with a negligible contribution of swept up interstellar medium. The total mass of this model is 25.5 M⊙, a dust mass of 0.14 M⊙, for a dust-to-gas ratio of . Accordingly, we suggest that the initial stellar mass of WR 136 was 50 M⊙, consistent with current single stellar evolution models.
keywords:
stars: evolution — stars: individual: NGC 6888, WR 136 – stars: winds, outflows — infrared: ISM — stars: Wolf-Rayet1 INTRODUCTION
Wolf-Rayet (WR) stars are formed as the result of the evolution of O-type stars with intial masses M⊙ (Ekström et al., 2012). The single stellar evolutionary scenario suggests that, before entering the WR phase, these stars become red supergiant (RSG) or luminous blue variable (LBV) stars whose slow winds ( km s-1) strip them from their hydrogen-rich outer layers producing dense structures around them (e.g., Cox et al., 2012; Morris et al., 2017). Furthermore, observational evidence suggests that the majority of massive stars are born in binary systems (Sana et al., 2012), which affect their evolution and, consequently, the production of WR stars (Eldridge et al., 2017; Mason et al., 2009). Mass transfer between the binary components or the ejection of a common envelope might also strip the hydrogen-rich envelope of one of the components creating a WR star (see, e.g., Götberg et al., 2018; Ivanova, 2011, and references therein). Nevertheless, WR stars exhibit strong fast winds (1500 km s-1, 10-5 M⊙ yr-1; Hamann et al., 2006) that sweep and compress the previously ejected material. This interaction produces a wind-blown bubble around the WR star and, at the same time, the strong UV flux from the progenitor star ionizes the material (e.g., García-Segura & Mac Low, 1995). The combination of all these effects produces WR nebulae (see Chu, 1981).
WR nebulae have radii as large as 10 pc (e.g., Toalá et al., 2012, 2017) and in some cases exhibit multiple shells due to the eruptive mass ejection of the progenitor star (Marston, 1995a; Marston et al., 1999). This demonstrate the powerful energy injection of very massive stars leveraging their role as one of the main actors shaping and enriching the interstellar medium (ISM). Spectroscopic studies of WR nebulae can unveil the production of heavy elements in their interiors, which can be used to test stellar evolution models and the chemical gradients in their host galaxies (Esteban, et al., 2016; Méndez-Delgado et al., 2020). However, these structures are short-lived and therefore seldomly detected. WR nebulae will experience hydrodynamical instabilities causing them to break and to dissipate into the ISM within a few times 104 yr (Freyer et al., 2006; Toalá & Arthur, 2011). That is, not many WR stars exhibit associated nebulae (Gruendl et al., 2000; Stock & Barlow, 2010), thus, producing detailed studies of known WR nebulae can bring us closer to understanding the violent impact of massive stars in the ISM.
Massive stars have been appointed to be laboratories for studying dust formation, processing and evolution (Wachter et al., 2010; Gvaramadze et al., 2010; Verhoelst et al., 2009). During the RSG and LBV phases these stars reduce their effective temperature, K, allowing the formation of dust in their surroundings. The details of these processes depend on whether the star evolved through a RSG or LBV phase. RSG stars, with their enhanced mass-loss rates ( M⊙ yr-1), may form dust-rich shells with dust sizes as large as a few times 0.1 m (see Scicluna et al., 2015, and references therein). Meanwhile, the eruptive nature of the high mass-loss rate of LBV stars ( M⊙ yr-1; Weis, 2001) may cause the dust to be shielded from stellar radiation, allowing it to grow to sizes as large as 1 m (Kochanek, 2011) as reported for the iconic LBV star Car (Morris et al., 2017). Dust production can also occur at the interacting wind surface of massive binaries. In particular, carbon-rich WR stars (WC) with OB companions have been found to exhibit dust-rich pinwheel nebulae (e.g., Tuthill et al., 1999; Marchenko et al., 2002). Furthermore, it has been suggested that dust can also form in the ejecta of a common envelope phase around a binary system (Lü et al., 2013).
Dust has been found spatially associated with the brightest optical regions of WR nebulae. Early infrared (IR) studies of WR nebulae showed that dust is thermally-heated by the strong ionizing flux from their progenitor stars (van Buren & McCray, 1988). Larger cavities harbouring WR nebulae have also been detected through IR and radio observations and these very likely correspond to the previous bubble carved by the feedback of the progenitor star during the main sequence phase (Marston, 1995b, 1996; Arnal & Cappa, 1996; Cappa et al., 1996). Marston (1991) presented the analysis of far-IR IRAS observations of the WR nebulae NGC 2359, RCW 58 and NGC 6888 and suggested that their dust masses were in the range of 0.25–1.3 . Taking into account the typically-adopted dust-to-gas ratio of 0.01, the total nebular masses of these WR nebulae were too large to have a stellar origin. Accordingly, Marston (1991) attributed them to swept up material from the ISM. A subsequent study presented by Mathis, Casinelli & van der Hucht (1992) demonstrated that these mass estimates can change dramatically if the effects of the radiation field from the star are accounted for.
| Telescope | Instrument | Band | Obs. date | Obs. ID. | Processing level | PI |
| (m) | (yyyy-mm-dd) | |||||
| Spitzer | IRAC | 3.6, 4.5, 5.8, 8.0 | 2005-10-21 | 20726 | Level 2 | J. Hester |
| MIPS | 24 | 2005-09-23 | 20726 | Level 2 | J. Hester | |
| IRS | SL (5–15), LL (14–39) | 2006-11-09 | 30544 | Level 2 | P. Morris | |
| Herschel | PACS | 70, 160 | 2010-12-16 | 1342212042 | Level 3 | M. Groenewegen |
| 100, 160 | 2010-12-16 | 1342212040 | Level 3 | M. Groenewegen | ||
| WISE | 12 | 2010-05-14 | 3031p378_ac51 | Level 3 |
The advent of a new generation of IR satellites provided us with the opportunity of spatially resolve structures in WR nebulae, improving our understanding of dust processing in nebulae around massive stars (see Cichowolski et al., 2020). Furthermore, Spitzer and WISE have been used to unveil a new population of obscured nebulae around LBV and WR stars (Gvaramadze et al., 2010; Toalá et al., 2015). More recently, Herschel observations of M 1-67 around WR 124 were presented by Vamvatira-Nakou et al. (2016). Their radiative transfer model predicted a total nebular mass of 22 with a dust mass of 0.26 . These authors predicted dust particles with sizes between 2 and 10 m in M 1-67, but such large dust particles have never been reported in circumstellar nebulae.
We have started a series of works to analyze publicly available IR observations of WR nebulae using the photoionization code Cloudy (Ferland et al., 2017) in conjunction with detailed synthetic WR spectra obtained from the state-of-the-art Potsdam Wolf-Rayet Models (PoWR) models (Hamann & Gräfener, 2004)111http://www.astro.physik.uni-potsdam.de/PoWR. Our most recent work on the WR nebula M 1-67 showed that there is no need for dust with sizes larger than 1 m to reproduce the nebular and dust properties (Jiménez-Hernández, Arthur & Toalá, 2020, hereinafter Paper I). By combining modern tools we were able to conclude that the origin of M 1-67 might have been due to a common envelope scenario, which makes this WR nebula the first evidence of such process in massive stars.
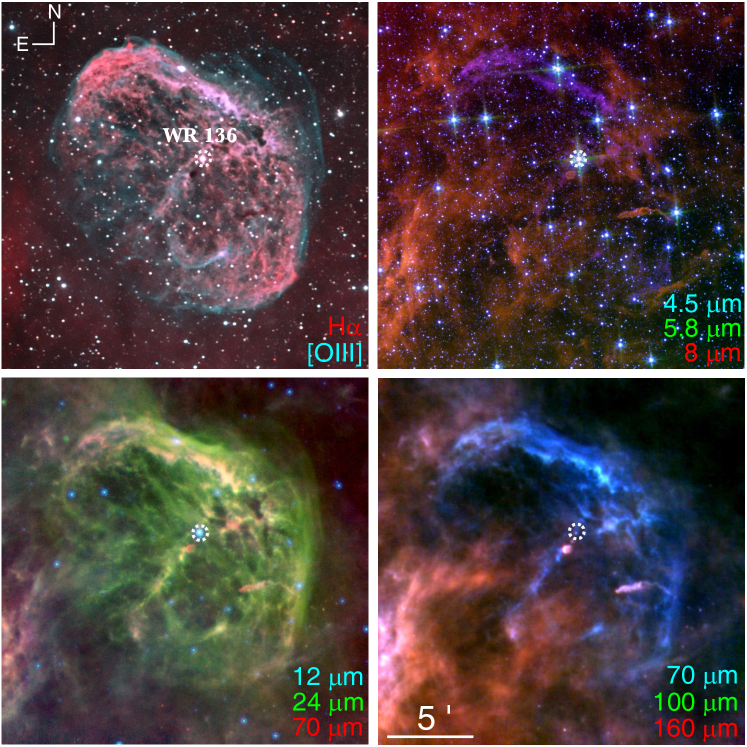
In this paper we present our analysis of the WR nebula NGC 6888 (a.k.a. the Crescent Nebula; see Fig. 1 top left) around WR 136 (a.k.a. HD 192163), one of the most studied galactic WR nebulae. H narrow-band emission images show a filamentary and clumpy structure (Stock & Barlow, 2010), which very likely formed as a result of hydrodynamical instabilities generated through the wind-wind interacting scenario (e.g., García-Segura et al., 1996; Toalá & Arthur, 2011). An outer skin of [O iii] emission encompassing the clumpy structure results from the shock of the expanding RSG material pushed by the WR wind (Gruendl et al., 2000; Moore, Hester & Scowen, 2000). This [O iii] shell also confines the adiabatically-shocked, X-ray-emitting hot bubble (see Toalá et al., 2016, 2014; Wrigge et al., 2005, and references therein).
Several studies have addressed the physical properties of NGC 6888 and in general all these studies result in similar abundances (see Esteban, et al., 2016; Fernández-Martín et al., 2012; Reyes-Pérez et al., 2015; Stock & Barlow, 2014, and references therein). Fernández-Martín et al. (2012) suggested that NGC 6888 is mainly composed of three structures: i) an ellipsoidal inner broken structure formed by shocked shells from the WR and RSG stages, ii) an outer spherical shell presumably formed by the breaking of the main sequence (MS) bubble, and iii) a faint structure around the nebula created by the interaction of the MS winds and the local ISM. Using the ionization code Cloudy, Reyes-Pérez et al. (2015) concluded that NGC 6888 is chemically homogeneous and uniformly filled with low density material, 1 cm-3, in stark contrast to the obvious different morphological components and previous density estimates.
Here we present a complete analysis of the IR emission of NGC 6888. We use images and spectra from WISE, Spitzer and Herschel that cover the 3–160 m wavelength range. The images are used to study the distribution of dust in NGC 6888 in comparison with optical images. The spectral energy distribution (SED) in the IR, in combination with publicly available estimates of the abundances and nebular properties, has been used to model the properties of the dust and ionized components of NGC 6888 with the ionization code Cloudy. Our paper is organised as follows. The observations are presented in Section 2. The analyses of the images, the IR photometry, and the IR spectra are presented in Sections 3, 4 and 5, respectively. Our models of NGC 6888 are presented in Section 6. Finally, the discussion and conclusions are presented in Sections 7 and 8.
2 Observations
2.1 IR images and spectra
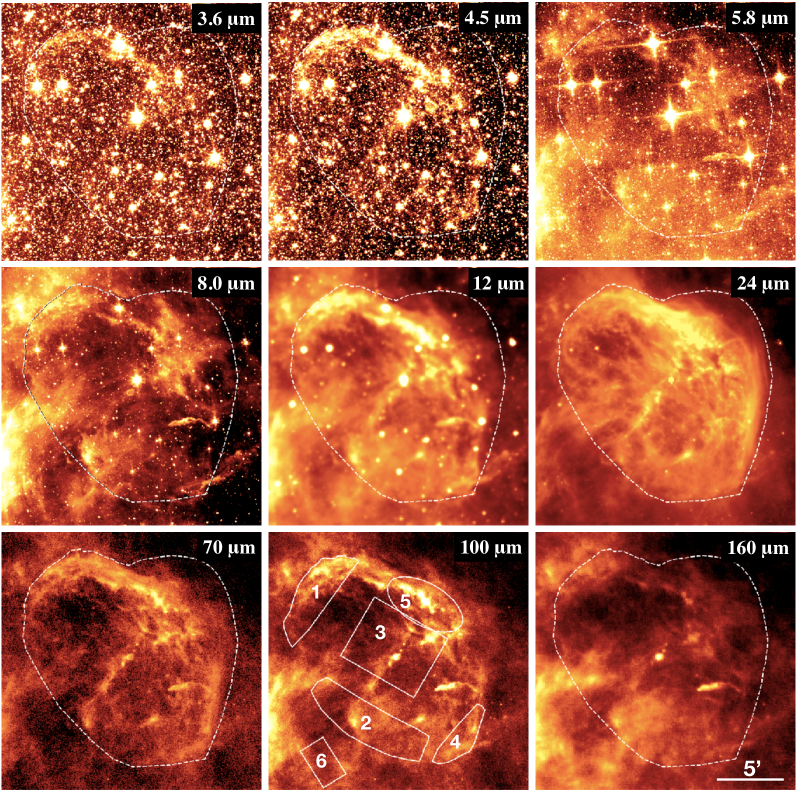
All the IR observations used in the present work have been obtained from the NASA/IPAC Infrared Science Archive222https://irsa.ipac.caltech.edu/frontpage/. Details of the observations such as the telescope, instrument, spectral band, observation date and principal investigator (PI) are listed in Table 1. Archival IR images of NGC 6888 were obtained from WISE, Spitzer IRAC & MIPS, and Herschel PACS observations333The Herschel PACS observations were obtained in the framework of the Mass-loss of Evolved StarS (MESS) project (Groenewegen et al., 2011).. All available IR images are presented in Figure 2.
The available Spitzer Infrared Spectrograph (IRS) observations of NGC 6888 were obtained in stare mode (Houck, et al., 2004).
These spectra were obtained with the low- and high-resolution modules, but unfortunately the high-resolution observations do not have suitable regions for background-subtraction. Thus, we inspected these spectra, but no science was obtained from them. The low-resolution spectra correspond to the Short-Low (SL) and Long-Low (LL) modules covering the 5–38 m wavelength range. The positions of the low-resolution slits are shown in Figure 3.
The Spitzer IRS observations were analysed with the CUbe Builder for IRS Spectra Maps (cubism; Smith et al., 2007a) software. cubism tasks are used to combine spectra from the same position and to produce one-dimensional spectra. We followed the standard reduction processes, which include background subtraction, characterization of noise in the data and bad pixel removal.
2.2 Optical imaging (OARP)
Optical narrow-band images of NGC 6888 were obtained at the Observatorio Astronómico Robótico Primavera (OARP) operated by the University of Guadalajara (Jalisco, Mexico). The facility is used by undergraduate, graduate, and doctoral programs in physics, astronomy and astrophysics. Recently established, was strategically located just over 20 miles west of Guadalajara, where it was free from light pollution and clearer night sky. The observatory utilizes a 0.32m f/8 CDK (Corrected Dall-Kirkham) telescope equipped with a SBIG STL-6303E/LE commercial camera, which uses a Kodak Enhanced KAF-6303E imaging sensor. This sensor consists of a 30722048 pixels array with a size of 99 microns each. In combination with the telescope, it provides a field of view (FoV) of and a plate scale of 073 pixel-1.
Images of NGC 6888 were obtained on 2019 March 9 and 30 for total exposure times of 2 h in the [O iii] filter and 1.5 h in the H filter. These filters have central wavelengths and bandwidths of = 6563 Å and =30 Å, and = 5007 Å and =30 Å, respectively. The detector was set with a binning. The data were bias-subtracted and flat-field corrected following standard Image Reduction and Analysis Facility (iraf) routines (Tody, 1993). A colour-composite optical image of NGC 6888 is presented in the top-left panel of Figure 1.
3 Dust distribution
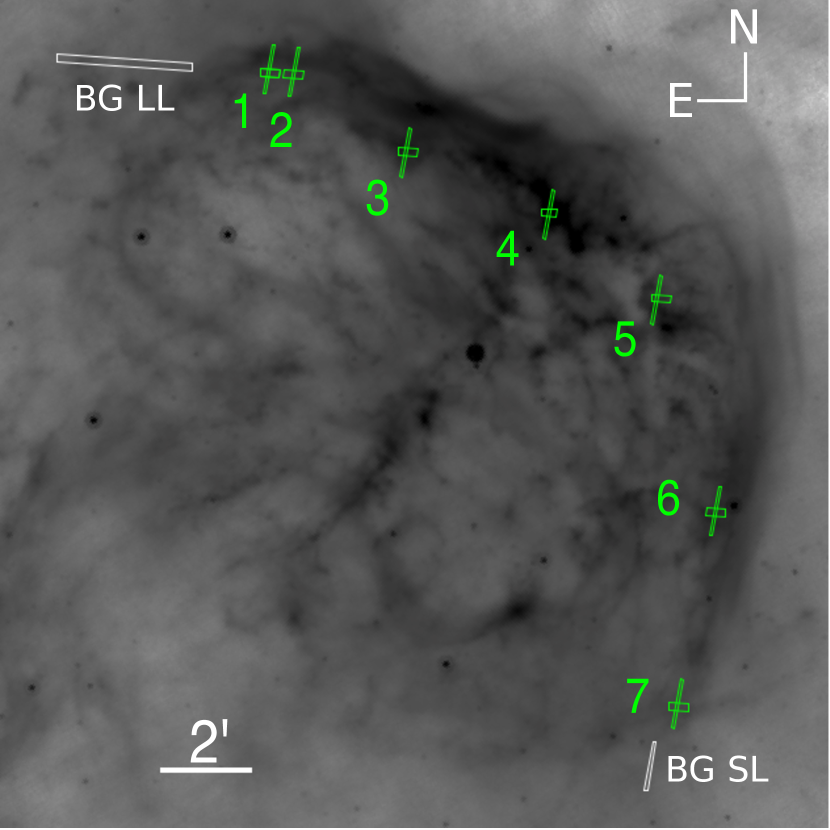
Figure 2 presents the different IR images of NGC 6888 in the 3–160 m wavelength range. All Spitzer IRAC images exhibit a large number of point sources in the vicinity of NGC 6888. The IRAC 3.6 and 4.5 m images show a marginal detection coincident with the brightest optical regions of NGC 6888. Some emission is detected from the NE cap and in a lesser extent from the SW cap. No significant emission from the inner region is detected. The other two IRAC images, 5.8 m and 8.0 m, trace mostly clumps and filaments of the cold surrounding ISM.
The Spitzer MIPS image at 24 m traces the continuum emission from dust present in the WR nebula (Toalá et al., 2015).
The Herschel PACS 70 m image is very similar to that of the Spitzer MIPS, but the PACS 160 m image rather traces the emission from the cold ISM. Meanwhile, the emission in the WISE 12 m and Herschel PACS 100 m images map the contribution from both the nebula and the ISM.
In general, most images presented in Figure 2 trace the morphological features exhibited by the optical image of NGC 6888: the NE and SW caps and the NW blowout. The dark clump and filament described by Fernández-Martín et al. (2012) are clearly visible in the IRAC 5.8 m and 8.0 m images and in the Herschel images, they form part of the cold ISM. For a direct comparison with the optical image, we created three colour-composite IR pictures of NGC 6888 using i) the 4.5, 5.8 and 8 m Spitzer IRAC images, ii) the 12, 24 and 70 m mid-IR images, and iii) the 70, 100 and 160 m Herschel PACS images. These three images are also presented in Figure 1 along with the optical image of NGC 6888. These combinations of images exhibit in great detail the nebular and dust distribution of NGC 6888. The images confirm the suggestion of Toalá et al. (2014) that NGC 6888 is expanding towards a low-density region along the NW direction, which might be producing the expansion of the blowout. At the same time, the colour-composite IR pictures in Figure 1 indicate that NGC 6888 is placed behind a molecular filament.
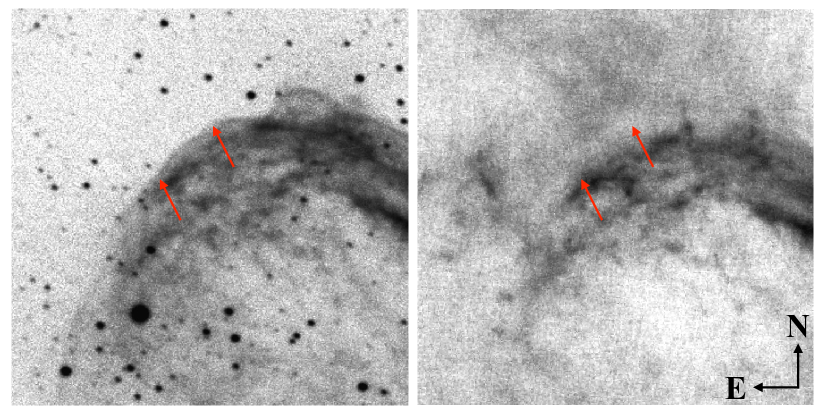
The colour-composite IR panels of Figure 1 disclose an interesting feature. In the three IR panels, there is a dark region separating the contribution from NGC 6888 with that of the ISM. This effect is more clearly seen around the NE cap. The lack of IR emission is spatially coincident with the [O iii] optical emission, which according with Gruendl et al. (2000) traces the expanding shock generated by the wind-wind interaction that created the WR nebula. The diminished IR emission in this layer suggests that dust is being destroyed by the expansion of the shock into the ISM. To further illustrate this, we present in Appendix A close up images of the NE cap of NGC 6888.
4 IR photometry
| Instrument | Complete | Region 1 | Region 2 | Region 3 | Region 4 | Region 5 | Region 6 | NGC 6888 | |
|---|---|---|---|---|---|---|---|---|---|
| (m) | (Jy) | (Jy) | (Jy) | (Jy) | (Jy) | (Jy) | (Jy) | (Jy) | |
| WISE | 12 | ||||||||
| Spitzer MIPS | 24 | ||||||||
| Herschel PACS | 70 | ||||||||
| Herschel PACS | 100 | ||||||||
| Herschel PACS | 160 |
In order to produce a consistent model of the nebular and dust properties of NGC 6888, we extracted the IR photometry of each available image presented in Figure 2 for m. We did not use the Spitzer IRAC observations because they include the contribution from several nebular lines as well as possible low-ionization emission lines from the ISM. Moreover, the large number of background stars hampers an appropriate selection of the extraction region.
The photometry extraction procedure is described in Paper I. We define extraction regions where the integrated flux can be easily computed by adding all the pixels in the image. The contribution from background stars is excised and thus it is not taken into account for the flux estimate. A similar procedure would be performed for background regions, but it shall be noted that the ISM around NGC 6888 is not homogeneous as revealed by the IR images of NGC 6888 shown in the previous section. To minimise the impact of the spatially-varying background, several background regions surrounding NGC 6888 were selected to compute the same number of background-subtracted fluxes. We emphasize that regions SE from NGC 6888 were discarded because they show the strongest contribution from the ISM according to Figures 1 and 2.
The resultant mean and standard deviation of the flux values are used as the flux and its uncertainty (), respectively. Nevertheless, a total error must be computed by adding other uncertainties such as that obtained from the callibration () which depends on each instrument. Thus, the total error can be calculated as
| (1) |
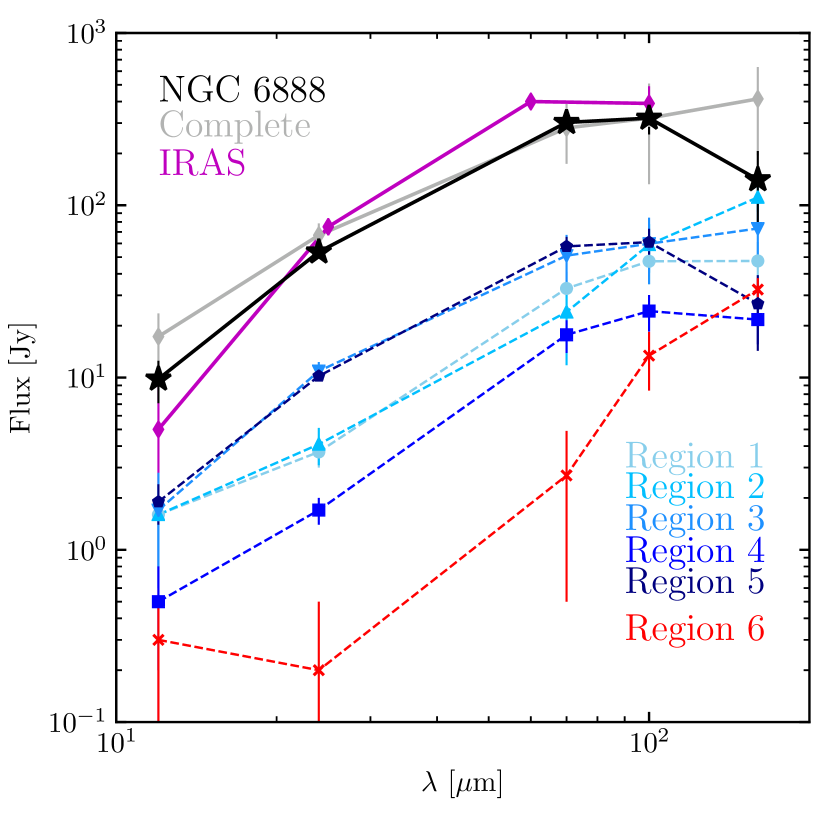
We first extracted the corresponding photometry from an aperture encompassing the emission from the [O iii] line which defines the complete nebular extension of NGC 6888 (see Fig. 1). This aperture is shown as a white dashed-line region in most panels of Figure 2. The resultant flux and error values of this region are listed in Table 2 and illustrated in Figure 4 as a SED labelled as Complete. Figure 4 suggests that the Complete photometry of NGC 6888 peaks at wavelengths longer than 160 m. However, as shown in Figure 2 the dashed-line region includes a significant contribution (depending on the IR image) from gas that very likely has a ISM origin.
To assess the contribution from the ISM in the SED, we explored the variation of the IR SED from different regions within NGC 6888. The bottom-central panel of Figure 2 shows the different extraction regions here considered. Their corresponding photometry is listed in Table 2 and plotted and compared to the Complete SED in Figure 4. This figure shows that the IR SED extracted from Regions 1–5 exhibit significant differences, but these can be explained by considering the SED of Region 6.The SED of this region, defined from an external filament to NGC 6888, increases with wavelength, suggesting the presence of colder dust in the ISM (see Section 6). Since the emission from NGC 6888 is projected against that of the ISM, this effect should also be present in other regions with different relative contributions. For example, the SED of Region 2, defined at the SE edge of NGC 6888, peaks at long wavelengths, i.e., it shows noticeable contribution from the ISM as shown by Region 6.
An inspection of the SED from these different regions led us to conclude that Region 5 has a SED (mostly) free from the contribution from the ISM. Its SED has a peak located around 70–100 m consistent with the IR emission found in other WR nebulae. Assuming that the SED of Region 5 is thus representative of the shape of the SED of NGC 6888, its flux level has been normalised to that of the emission from the whole nebula to create a SED labelled as NGC 6888 that would describe our target. The resultant SED, which we will use to model the dust properties of NGC 6888, is presented in Figure 4 and the corresponding flux values are listed in the last column of Table 2. For comparison we also show in Figure 4 the IRAS SED used in Mathis, Casinelli & van der Hucht (1992). The latter has larger fluxes at mostly all wavelengths except at 12 m. The excess of the IRAS photometry compared to that estimated in this work is very likely due to the contribution from material in the line of sight and the point-like sources unresolved in the IRAS observations.
| Line | Flux (mJy) | Model | |||||||
|---|---|---|---|---|---|---|---|---|---|
| (m) | 1 | 2 | 3 | 4 | 5 | 6 | 7 | (mJy) | |
| [Ar iii] | 8.98 | 1.10.2 | 2.30.8 | 6.74.8 | 8.02.1 | 3.93.3 | 0.51.9 | 0.31.1 | 1.9 |
| S iv | 10.5 | 0.20.05 | 0.70.3 | 5.63.9 | 8.42.2 | 3.12.7 | 0.41.6 | 0.10.5 | 2.2 |
| Ne ii | 12.8 | 5.20.1 | 4.30.5 | 5.41.4 | 6.10.7 | 3.31.4 | 0.90.9 | 1.31.0 | 1.4 |
| Ne iii | 15.5 | 2.90.004 | 3.10.04 | 6.40.05 | 10.80.03 | 3.00.005 | 1.20.03 | 1.00.05 | 2.5 |
| S iii | 18.7 | 8.60.01 | 9.30.2 | 12.40.2 | 17.40.08 | 5.70.01 | 2.10.09 | 2.80.3 | 9.3 |
| S iii | 33.5 | 19.10.02 | 20.20.04 | 26.10.04 | 34.90.05 | 13.00.03 | 5.80.03 | 6.70.05 | 22.6 |
| Si ii | 34.8 | 2.90.02 | 2.40.02 | 2.80.02 | 2.90.03 | 1.80.02 | 1.40.02 | 1.80.02 | 7.8 |
| ([S iii]) | [cm-3] | 420 | 440 | 470 | 520 | 400 | 230 | 350 | 340 |
5 IR spectra
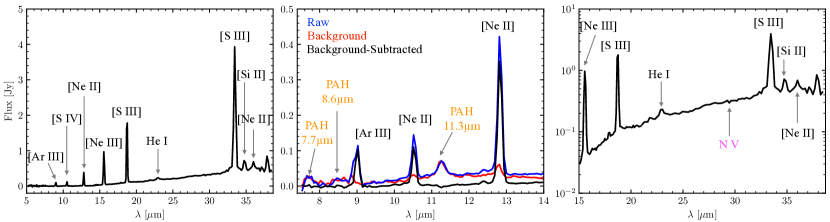
Spitzer IRS spectra of NGC 6888 were extracted from the brightest regions following the N-NW-SW direction. The location of the extraction regions, as shown in Figure 3, are labelled as Slit 1 to 7 and correspond to regions with the lowest or negligible contribution from the ISM. The spectra are very similar with a continuum from dust emission. The dominant emission lines in these spectra are those of [Ne ii] 12.8 m, [Ne iii] 15.5 m, [S iii] 18.7 and 33.5 m, [S iv] 10.5 m, [Ar iii] 8.98 m, and [Si ii] 34.8 m (see Fig. 5). Other less intense lines correspond to He i at 22.9 m and very likely an absorption due to N v at 29.5 m. The latter implies the presence of gas with temperature around 105 K at the mixing layer between the nebular cold (104 K) and the hot X-ray-emitting gas (106 K) filling NGC 6888 (e.g., Gruendl et al., 2004; Fang et al., 2016). As an example, we show in Figure 5 the spectrum from Slit 4 with the most prominent lines labelled.
The IRS spectra can be used to look for the presence of molecules in NGC 6888 such as H2 and polycyclic aromatic hydrocarbons (PAHs) similarly to other nebulae around evolved stars such as planetary nebulae (see, e.g., Mata et al., 2016; Fang et al., 2018; Toalá et al., 2019, and references therein) and, according to St-Louis et al. (1998), the interstellar nebula around WR 7 (NGC 2359). PAH features appear in the spectra of NGC 6888, but, after subtracting the background spectra, these disappear as illustrated in the middle panel of Figure 5 showing the spectral range including the 7.7, 8.6 and 11.3 m PAH features. Furthermore, no H2 lines are detected in the IRS spectra of NGC 6888.
We used the pahfit routines (Smith et al., 2007b) to measure the line intensities and errors for each line for all 7 spectra. The ions, flux and errors of the most prominent lines are listed in Table LABEL:tab:irs. This table shows clear variations in the measured lines from slit to slit. In particular, emission lines from the spectrum 4 exhibit the largest fluxes. We attribute these differences to the variations of the physical properties within the slit positions, e.g., due to the clumpy distribution of gas in NGC 6888. To corroborate this, we have computed the electron densities () using the [S iii] 18.7 and 33.5 m with pyneb (Luridiana et al., 2015). The ([S iii]) values are listed in the bottom row of Table LABEL:tab:irs for each slit position and, indeed, show that Slit 4 has the largest density estimate.
6 DUST MODELING
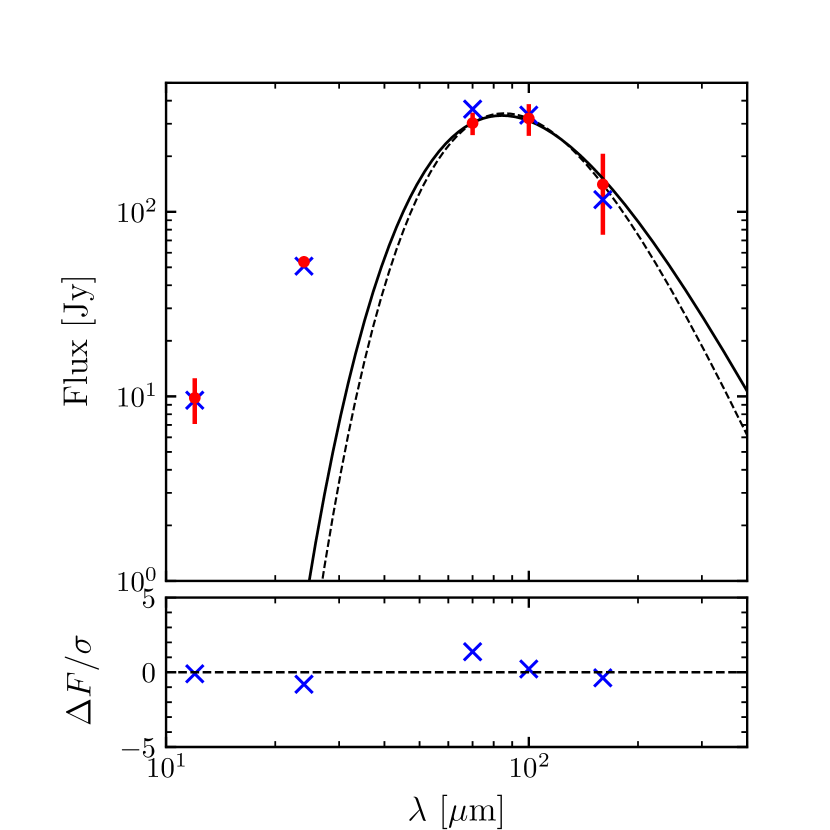
As a first approximation to the dust temperature () and mass (), we fitted a modified blackbody (MBB) model to the IR SED of NGC 6888 with m. Under the assumption that dust is optically thin and that all the dust has a single temperature, the MBB can be expressed as
| (2) |
where is the Planck function and is the dust emissivity adopted to be at the reference wavelength =100 m (Draine, 2003). We fitted the Herschel photometry taking , and as free parameters. The best fit that minimises corresponds to , and . Similar temperatures for WR nebulae have been previously estimated with IRAS observations (e.g., Marston, 1991). However, there is a known degeneracy between and (Juvela et al., 2013) and thus, we computed another model by fixing that resulted in and . We note that the MBB fits are not meant to reproduce the complete IR photometry of NGC 6888, but they can be useful to estimate the temperature of the large grain population, another constrain to our detailed model (see below). Nevertheless, these approximations reveal that the dust grains must be present in a wide range of sizes and temperatures. These two MBB models are plotted in Figure 6 in comparison with the observed IR SED. To further illustrate the differences with the physical properties of the material in the surrounding ISM, we also estimated the dust temperature for the photometry extracted for Region 6 (see Figures 2 and 4) probing this is ISM. The dust temperature for this emission is lower, =16.70.4 K, as expected for cold ISM dust (see Ostrovskii et al., 2020, and references therein).
Our goal is to produce a characterization of the dust properties in
NGC 6888 consistent with the nebular optical properties. For this, we used
the spectral synthesis and plasma simulation code Cloudy
(version 17.01; Ferland et al., 2017) coupled
with the pyCloudy libraries (Morisset, 2013).
The input parameters required by Cloudy are i) the form of the
incident spectrum (a model of the spectrum of WR 136),
ii) the density distribution, iii) abundances, and
iv) the dust properties (chemical composition and size distribution).
With these, Cloudy is able to
produce an emission model which is subsequently processed with
the help of pyCloudy to create synthetic optical long-slit
observations. Furthermore, synthetic IR SED photometry is produced by
using the transmission curves from the different IR instruments used
here444The transmission curves of the WISE, Spitzer
and Herschel instruments were obtained from http://svo2.cab.inta-csic.es/theory/fps/index.php?mode=browse.
The synthetic observations are then compared to previously published
optical studies of NGC 6888 and the IR observations (spectra and IR SED)
presented in the previous sections to
assess the validity of our models.
| Element | E2016 | MD2014 | RP2015 | Model |
|---|---|---|---|---|
| He | 11.230.06 | 11.210.03 | 11.21 | 11.23 |
| O | 8.190.13 | 8.200.09 | 8.20 | 8.05 |
| C | – | 8.860.31 | 8.86 | 8.86 |
| N | 8.270.18 | 8.540.20 | 8.40 | 8.68 |
| Ne | 7.510.78 | 7.510.20 | 7.51 | 7.78 |
| S | 6.920.21 | 6.770.20 | 7.10 | 6.92 |
| Cl | 4.990.15 | – | – | 4.84 |
| Ar | 6.410.11 | 6.410.11 | 6.41 | 6.41 |
| Line | Esteban, et al. (2016) | Model | |
|---|---|---|---|
| Å | (Slit A6) | ||
| O ii | 3726 | 50.44.7 | 39.4 |
| O iii | 4363 | 1.40.4 | 1.5 |
| He I | 4471 | 8.80.4 | 8.1 |
| O iii | 4959 | 81.31.7 | 82.1 |
| O iii | 5007 | 242.94.9 | 245.1 |
| Cl iii | 5518 | 0.50.1 | 0.6 |
| Cl iii | 5538 | 0.40.1 | 0.4 |
| N ii | 5755 | 1.30.1 | 2.2 |
| He I | 5876 | 25.80.7 | 23.6 |
| N ii | 6548 | 41.81.2 | 51.0 |
| H | 6563 | 301.69.0 | 286.8 |
| N ii | 6583 | 130.33.9 | 150.3 |
| He I | 6678 | 7.00.4 | 5.9 |
| S ii | 6716 | 5.10.3 | 4.4 |
| S ii | 6731 | 4.20.3 | 3.6 |
| He I | 7065 | 4.20.5 | 4.2 |
| Ar iii | 7136 | 15.20.7 | 26.1 |
| (H) | 0.620.03 | 0.65 | |
| log((H)) | [erg s-1 cm-2] | 13.010.01 | 13.01 |
| (S ii) | [cm-3] | 200140 | 198 |
| (O iii) | [K] | 9550820 | 9708 |
We started our modeling adopting the most recent abundances determinations reported by Esteban, et al. (2016), which correspond to 10 m Gran Telescopio de Canarias (GTC) OSIRIS spectroscopic observations. Their slit A6 is placed on a region spatially coincident with the one used here to estimate the total IR photometry of NGC 6888 (see Figure 1 in Esteban, et al., 2016). Their abundances and emission line fluxes obtained from these observations are listed in Tables 4 and 5, respectively. The total H flux () in logarithmic scale, the electron temperature () and obtained from the [O iii] and [S ii] lines, respectively, are also presented in the bottom rows of Table 5. We note that during the fitting process, some of the abundances had to be tuned in order to reproduce simultaneously the optical and IR emission lines. For comparison we also show in Table 4 the abundances reported by other works.
| [kpc] | 1.9 | Bailer-Jones et al. (2018) |
|---|---|---|
| WR-subtype | WN6h | Hamann, et al. (2019) |
| [M⊙] | 23/21 | Hamann, et al. (2019) |
| log() [L⊙] | 5.78 | Hamann, et al. (2019) |
| [kK] | 70.8 | Hamann, et al. (2019) |
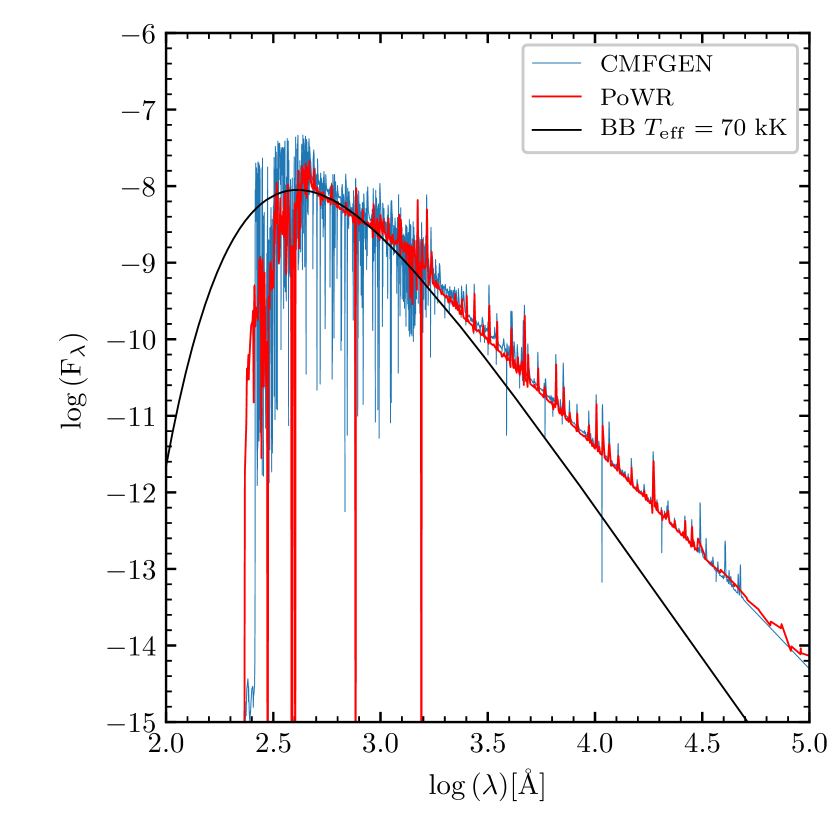
We demonstrated in Paper I that a detailed prescription of the stellar atmosphere is necessary to obtain a more realistic description of the nebular and dust parameters. The progenitor star of NGC 6888, WR 136, has been modeled by Hamann, et al. (2019) using the updated version of the stellar atmosphere code PoWR. The best fit stellar parameters reported in that work are listed in Table 6. Accordingly, we retrieved the model labelled as WNL 10-16 with Galactic metallicity and hydrogen fraction of 0.2 from the PoWR database. This model is presented in Figure 7 compared to a blackbody emission model with the same effective temperature (70 kK) as well as the stellar model used by Reyes-Pérez et al. (2015) kindly provided by J. Reyes-Pérez. In the following, we will adopt the distance of kpc estimated by Bailer-Jones et al. (2018) using the Gaia data release.
6.1 Detailed modeling of NGC 6888
The H and [N ii] images of NGC 6888 show an apparent elliptical shape with semi-major and semi-minor axes of 540′′ and 360′′, respectively. At a distance of 1.9 kpc, the physical size of NGC 6888 is 5 pc and 3.9 pc, respectively. Marston & Meaburn (1988) showed however that the kinematics of NGC 6888 can be broadly fit by an expanding spherical shell with an expansion velocity of 85 km s-1, although we note that a shell with blisters would be more accurate as unveiled by the [O iii] image. For this, we adopted a spherically-symmetric shell for our model. An averaged angular radius of 450′′ was set as a fixed parameter for the outer radius (). The inner radius () was varied along with the filling factor () and to try to fit the optical observations and physical properties of NGC 6888. Values between cm-3 for the electron density have been reported in the literature (Esteban & Vilchez, 1992; Fernández-Martín et al., 2012; Esteban, et al., 2016, see also Table LABEL:tab:irs), but we note that it is very likely that the largest values correspond to dense clumps detected in H and [N ii] narrow-band images (see Fig. 1).
We performed a large number of models fixing but varying for families of values. None of these models resulted in good nebular parameters comparable to those reported for NGC 6888. Consequently, we followed the results from Reyes-Pérez et al. (2015) and considered two shells: an inner shell with density between and and a filling factor composed purely of gas, and an outer shell with density between and and . The outer shell includes contributions from both gas and dust. A schematic view of this model is presented in Figure 8.
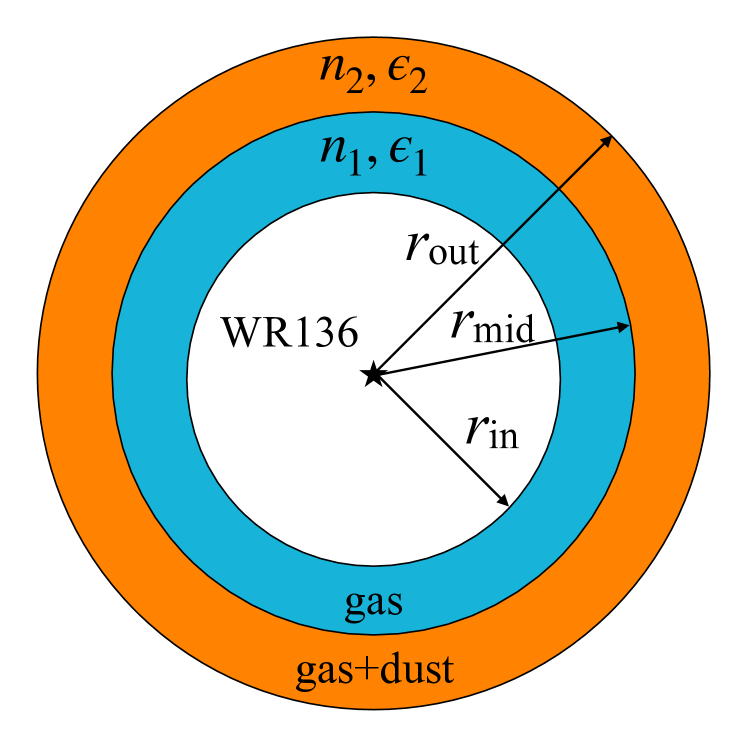
Our best model that reproduces the nebular properties of NGC 6888 was achieved with cm-3, cm-3, , . The radii are 400′′, 425′′, and 450′′. The synthetic intensities of the most important optical lines are listed in Table 5 in comparison with those reported in Esteban, et al. (2016) for their slit A6. The emission IR lines obtained from our model are compared to those obtained from the Spitzer IRS observations in Table LABEL:tab:irs. Despite the variations obtained from the Spitzer IRS spectra, the model broadly reproduces the IR lines, corroborating previous findings that suggest that the inner regions of NGC 6888 are dominated by photoionization (Esteban & Vilchez, 1992; Esteban et al., 1993; Reyes-Pérez et al., 2015). Although we note that there might be certain components associated to shocks which produce line excitation (Moore, Hester & Scowen, 2000; Gruendl et al., 2000).
As noted before, we started our fitting process by adopting the set of abundances reported for slit A6 by Esteban, et al. (2016). However, some elemental abundances required small changes in order to fit both the optical and IR emission lines. Nevertheless, most of them resulted in values close to those reported in the literature. In particular, the O abundance had to be reduced to 8.05, a small value compared to what has been reported by the references in Table 4, but marginally similar to the lower value reported by Esteban, et al. (2016). The last column in Table 4 lists the final abundances used for our best model.
Once we have modeled the observed emission lines of NGC 6888 we now include dust in our calculations to produce synthetic IR photometry. During the RSG and LBV phase, massive stars are copious producers of oxygen which condensate molecules, such as silicates in their atmospheres (Dharmawardena et al., 2020; Verhoelst et al., 2009). Accordingly, we adopt grains composed of amorphous astronomical silicate. In particular, Cloudy includes olivine (MgFeSiO4) as the default silicate grain.
Initially, we used two distribution of dust sizes as those used in Mathis, Casinelli & van der Hucht (1992): a distribution for small grains with sizes =[0.002–0.008] m and another for big grains with sizes =[0.005–0.25] m. However, our first attempts to model the IR SED suggested the need of extending the size of the large grains. Finally, we found that a population of sizes for the big grains of =[0.05–0.50] m improved our model. The maximum size of the big grains was fixed to 0.50 m as found for the RSG star VY Canis Majoris (Scicluna et al., 2015). In all cases, the grains are spherical and their sizes follow a Mathis et al. (1977) power-law distribution with 10 size bins for each distribution.
To reproduce the observed IR SED, our model requires a large amount of big grains, with a big grains-to-small grains ratio of 16:1 and a resultant dust-to-gas ratio of . The synthetic photometry obtained from our model is compared to the observed IR SED in Figure 6. Our best model suggests that the total mass of NGC 6888 is with a total dust mass of , less than a half of that estimated by the MBB model with fixed . The model predicts a mass for the big grains of 0.134 M⊙. We note that the errors in the total mass and dust mass estimates were obtained by propagating the errors in the distance as reported by Bailer-Jones et al. (2018).
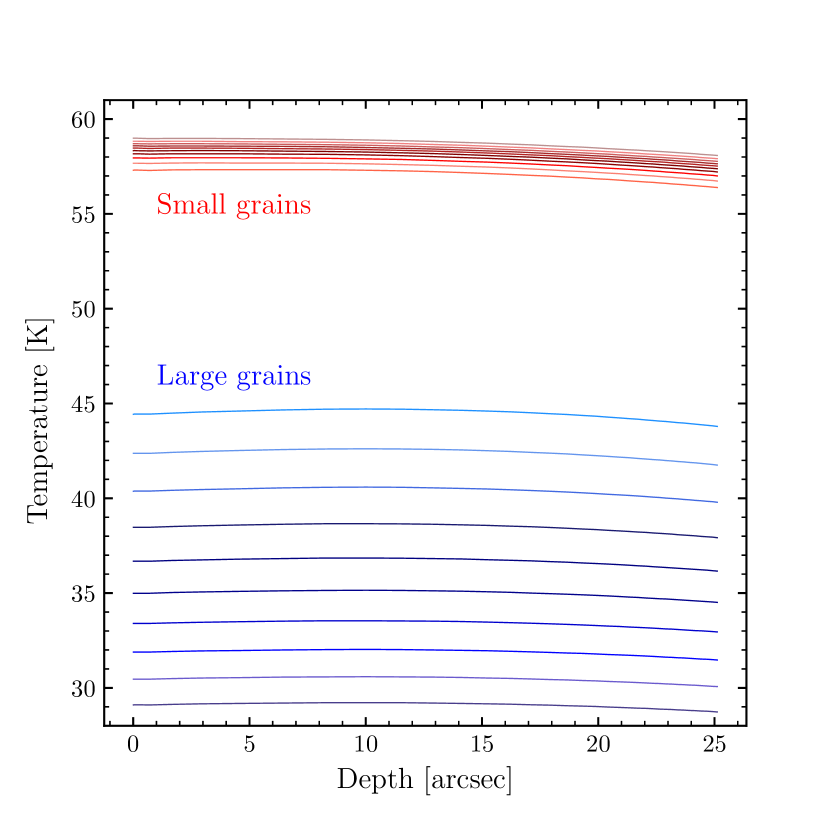
In Figure 9 we show the temperature distribution for different bin sizes of the dust grains located in the outer shell. The temperature for the large grains is in the range estimated using the MBB approximation.
7 Discussion
7.1 On the spatial distribution of dust in NGC 6888
Our analysis above has disclosed an unprecedented view of the IR emission of the WR nebula NGC 6888. The Herschel PACS and Spitzer IRAC images have revealed in great detail the distribution of dust in this WR nebula and the ISM around it. These are shown in the colour-composite IR panels of Figure 1 which are compared to the optical image of NGC 6888. Such detailed morphological IR characteristics of NGC 6888 are only allowed by the spatial resolution of the observations used here as compared with the IRAS images used in previous analyses (Marston, 1991; Mathis, Casinelli & van der Hucht, 1992).
An interesting feature seen in the IR panels in Figure 1 is a gap between the dust in NGC 6888 and the emission that traces the outer cold dust from the ISM. This situation is clearly seen in the NE cap of NGC 6888 and to a lesser extent towards the SW cap. For example, Figure 1 bottom right panel shows a dark region separating the Herschel images at 70 m and 160 m. A careful comparison between the [O iii] and IR images of the nebula shows that the former is distributed exactly in the dark region observed in the colour-composite IR panels of this figure (see Appendix A).
Gruendl et al. (2000) presented the analysis of H and [O iii] narrow-band images of a sample of 8 bright WR nebulae, including NGC 6888. They showed that the [O iii] emission is smooth and traces the leading shock of the expanding nebula, while the H emission displays a clumpy morphology trailing inside the [O iii] emission (see Fig. 1 top left panel). Gruendl et al. (2000) argued that the displacement between these two emission lines is due to radiative cooling. Behind the shock front, the temperature drops while the density increases displacing the two emissions. We suggest that this dark region, which is coincident with the [O iii] leading shock, is unveiling the destruction of dust at the edge of NGC 6888.
The destruction of dust grains may be due to thermal evaporation, gas-grain collisions and destruction by grain-grain collisions (see Woitke, Dominik & Sedlmayr, 1993). According to Jones, et al. (1996) the destruction of silicate dust grains in low velocity shocks can be attributed to non-thermal sputtering while large grains (0.1 m) are easily shattered in grain-grain collisions. Slavin et al. (2004) presented calculations on the dust-gas decoupling on dust destruction in shocks. They found that grains with a large range of sizes are almost completely destroyed by shock waves with velocities around 75–150 km s-1. The reported expansion velocity of NGC 6888, 80 km s-1 (Chu et al., 1983; Marston & Meaburn, 1988), makes plausible the destruction of dust at the edge of NGC 6888 as the nebula expands.
7.2 Consequences of the dust model
Taking advantage of an improved analysis of the spatial distribution of dust in NGC 6888, we managed to uncover its true IR SED. This represents an improvement over the nebular estimates made from low-resolution IRAS observations. Our best model is able to reproduce nebular optical and IR properties of NGC 6888 using an appropriate description of the stellar atmosphere of WR 136. This resulted in a total mass of NGC 6888 of 25.5 M⊙ with a dust-to-gas ratio of , that is, a total dust mass of 0.14 M⊙. If we assume a duration of yr for the RSG phase, we can estimate an averaged mass-loss rate of M⊙ yr-1, consistent with that expected for the RSG phase.
Our results represent an improvement to the work of Mathis, Casinelli & van der Hucht (1992). They tried to fit simultaneously the nebular properties and the low-spatial resolution IRAS observations of NGC 6888. We have shown that their SED overestimated the real IR flux from this WR nebula. Although the estimated mass is of the same order as that estimated by our model (20 M⊙), they used a blackbody model for the stellar radiation field with kK. These authors restricted the large size of their big grains to 0.25 m but we found that increasing it to 0.5 m improved significantly our comparison with the IR SED. The limit of 0.5 m was set following the findings of Scicluna et al. (2015) on the RSG VY Canis Majoris. We note that a smaller population of big grains did not result in a good fit to the IR SED. In addition we tried models with dust sizes larger than 0.5 m without significant improvement. It is important to note that 93% of the dust mass corresponds to grains with sizes similar as those obtained for RSG stars (larger than those estimated for the ISM). That is, we are detecting the material ejected in the previous RSG phase with negligible contribution from swept up ISM material.
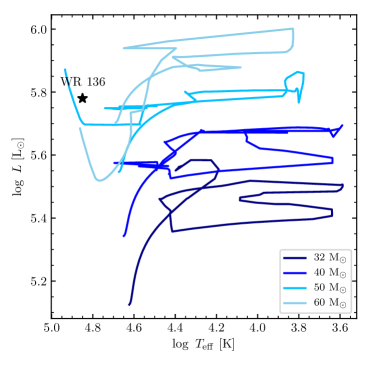
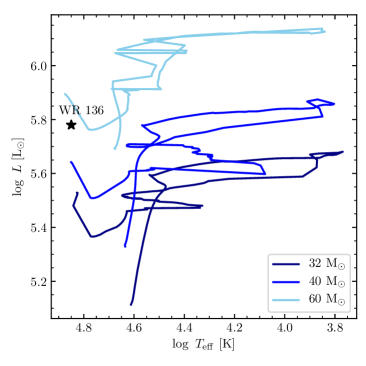
It seems indeed that the total mass of the nebula corresponds to material ejected by WR 136 in its previous RSG phase without any contribution from swept-up ISM material as suggested by the analysis of the IR images. Adopting a current mass for WR 136 of 22 M⊙ (see Table 5; Hamann, et al., 2019) one can estimate its initial mass to be 50 M⊙. This is corroborated by the stellar evolutionary models presented by Ekström et al. (2012)555The models were retrived from the Geneva Code wavepage: https://www.unige.ch/sciences/astro/evolution/en/database/.. In Figure 10 we present HR diagrams obtained by using stellar evolution models at with and without rotation with initial masses between 32 and 60 M⊙. The stellar parameters ( and ) estimated from the PoWR stellar atmosphere models (Hamann, et al., 2019) are somewhat consistent with WR 136 having an initial mass of 50 M⊙. Abundance estimates, in particular the He versus C/O diagram presented by Esteban, et al. (2016), are also consistent with this finding (see Figure 9 in that paper). Finally, we calculated the averaged mass-loss rate predicted for a 50 M⊙ stellar evolution model. This resulted in M⊙, very similar to that estimated using our detailed model.
We note that other authors have estimated ionized masses of 4 M⊙ (see Marston & Meaburn, 1988; Kwitter, 1981; Wendker et al., 1975) for NGC 6888 using radio and H line emission. We have recalculated their estimates by following the procedure in Marston & Meaburn (1988) using the H intensity with the current distance of 1.9 kpc and an electron density of 180 cm-3 as obtained for the dominant shell in our model (also consistent with observations). This resulted in 21.9 M⊙, which is consistent with the total estimated mass from our Cloudy model, but slightly smaller. This seems to suggest that NGC 6888 is almost completely ionized. If the difference, 3.6 M⊙, is considered to be neutral material, this should be shielded from the UV radiation from WR 136 in the dense clumps and filaments seen in the H[N ii] images.
It is not necessary to invoke a contribution from the ISM in the mass of NGC 6888. An appropriate distance estimation by means of the Gaia observations, and improvement of the stellar evolution models, and a careful dissection of the IR SED have allowed us to conclude that the origin of this WR nebula is purely due to processed ejected stellar wind.
We would like to point out that in order to produce a consistent model of WR nebulae one must take into account important aspects such as an appropriate description of the WR stellar atmosphere of the progenitor star and the simultaneous treatment of gas and dust (see Paper I). In particular we note here that the density distribution of our model was initially based on the findings reported by Reyes-Pérez et al. (2015) which only modeled the photoionized structure of NGC 6888.
Although these authors used a very similar WR stellar atmosphere as that used in the present work (see Fig. 7), the inclusion of dust in the model requires some tuning to the density parameters to simultaneously fit the optical and IR observations.
Finally, we note that our model predictions have been compared to single stellar evolution models, but it is currently accepted that massive stars are born in binary systems affecting their evolution (see Section 1). However, there is no observational evidence that WR 136 is a binary star (see Fullard et al., 2020; Gräfener et al., 2012) and the clumpy morphology of its associated WR nebula seems to have been the result of instabilities produced by the wind-wind interaction scenario, in contrast to the ballistic expanding clumps expected in a common envelope stripping scenario (see discussion in Paper I).
8 Conclusions
We presented a characterization of the distribution and properties of dust in the WR nebula NGC 6888 around WR 136. We used archival IR observations (spectra and images) that cover the 3–160 m wavelength range in conjunction with the photoionization code Cloudy to model simultaneously the properties of the ionized and dust components in NGC 6888. Our findings can be summarized as:
-
•
The combination of the IR images allowed us to perform an unprecedented study of the spatial distribution of dust in NGC 6888. The high-resolution IR images used here helped us to dissect the contribution from dust in NGC 6888 and that corresponding to the ISM. We discovered a dark region between the IR emission at the outer edge of the WR nebula coincident with the [O iii] optical emission. We suggest that this dark region is unveiling the destruction of dust at the edge of NGC6888 due to its relatively high expansion velocity (80 km s-1).
-
•
The IR photometry extracted taking into account the nebular morphology of NGC 6888 is heavily contaminated by the contribution from ISM clouds and filaments, a problem that could not be properly resolved in previous IR studies of this WR nebula. By studying the IR SED from different regions within NGC 6888 and its immediate surroundings, we suggest that the NW region has no contamination from the ISM. The true IR SED of NGC 6888 peaks between 70 m and 100 m, very similar to other WR nebulae.
-
•
Our best model to the nebular parameters and IR SED was achieved by adopting a spherical two-shell distribution with inner and outer densities of cm-3 and cm-3 and filling factors of 10-3 and 0.07, respectively. We adopted two population of dust grains with sizes =[0.002–0.008] m and =[0.05–0.50] m, the later in line with the large dust grains in the RSG star VY Canis Majoris. The total dust mass in NGC 6888 resulted in 0.14 M⊙ with a dust-to-gas ratio of . The small grains contribute to 6% of the total dust mass.
-
•
We found that the dust in NGC 6888 is dominated by large dust with RSG origin which suggest that this WR nebula is mainly composed by material ejected by the star with negligible contribution from swept up ISM.
-
•
The total estimated mass of NGC 6888 is , together with the estimates from Hamann, et al. (2019) for its progenitor star, leads us to suggest an initial mass 50 for WR 136. This result is supported by stellar evolution models, in particular the prediction of the mass-loss rate and the abundance determinations reported in the literature.
Acknowledgments
The authors would like to thank the referee, Anthony P. Marston, for comments and suggestions that improved the presentation of this paper. The authors are also thankful to J. Reyes-Pérez for providing the cmfgen model of WR 136. G.R. would like to thank S.J. Arthur and people at IRyA-UNAM for their support during the realization of this project. G.R., E.S and J.A.Q.-M. acknowledge support from Consejo Nacional de Ciencia y Tecnología (CONACyT) for student scholarship. J.A.T., G.R., and M.A.G. are funded by UNAM DGAPA PAPIIT project IA100720. M.A.G. acknowledges support of the Spanish Ministerio de Ciencia, Innovación y Universidades grant PGC2018-102184-B-I00, co-funded by FEDER funds. G.R.-L. acknowledges support from CONACyT and PRODEP (Mexico). VMAGG acknowledges support from the Programa de Becas posdoctorales of DGAPA UNAM. This work makes use of iraf, distributed by the National Optical Astronomy Observatory, which is operated by the Association of Universities for Research in Astronomy under cooperative agreement with the National Science Foundation. This work makes use of Herschel, Spitzer and WISE IR observations. Herschel is an ESA space observatory with science instruments provided by European-led Principal Investigator consortia and with important participation from NASA. The Spitzer Space Telescope was operated by the Jet Propulsion Laboratory, California Institute of Technology under a contract with NASA. Support for this work was provided by NASA through an award issued by JPL/Caltech. WISE is a joint project of the University of California (Los Angeles, USA) and the JPL/Caltech, funded by NASA.
Data availability
The data underlying this article will be shared on reasonable request to the corresponding author.
References
- Arnal & Cappa (1996) Arnal, E. M. & Cappa, C. E. 1996, MNRAS, 279, 788
- Bailer-Jones et al. (2018) Bailer-Jones, C. A. L., Rybizki, J., Fouesneau, M., et al. 2018, AJ, 156, 58
- Cappa et al. (1996) Cappa, C. E., Dubner, G. M., Rogers, C., et al. 1996, AJ, 112, 1104
- Cichowolski et al. (2020) Cichowolski, S., Duronea, N. U., Suad, L. A., et al. 2020, MNRAS, 495, 417
- Chu et al. (1983) Chu, Y.-H., Treffers, R. R., & Kwitter, K. B. 1983, ApJS, 53, 937
- Chu (1981) Chu, Y.-H. 1981, ApJ, 249, 195
- Cox et al. (2012) Cox, N. L. J., Kerschbaum, F., van Marle, A.-J., et al. 2012, A&A, 537, A35
- Dharmawardena et al. (2020) Dharmawardena, T. E., Mairs, S., Scicluna, P., et al. 2020, ApJ, 897, L9
- Draine (2003) Draine B. T., 2003, ARA&A, 41, 241
- Ekström et al. (2012) Ekström, S., Georgy, C., Eggenberger, P., et al. 2012, A&A, 537, A146
- Eldridge et al. (2017) Eldridge, J. J., Stanway, E. R., Xiao, L., et al. 2017, Publ. Astron. Soc. Australia, 34, e058
- Esteban, et al. (2016) Esteban C., Mesa-Delgado A., Morisset C., García-Rojas J., 2016, MNRAS, 460, 4038
- Esteban et al. (1993) Esteban, C., Smith, L. J., Vilchez, J. M., et al. 1993, A&A, 272, 299
- Esteban & Vilchez (1992) Esteban, C., & Vilchez, J. M. 1992, ApJ, 390, 536
- Fang et al. (2018) Fang, X., Zhang, Y., Kwok, S., et al. 2018, ApJ, 859, 92
- Fang et al. (2016) Fang, X., Guerrero, M. A., Toalá, J. A., et al. 2016, ApJ, 822, L19
- Ferland et al. (2017) Ferland, G. J., Chatzikos, M., Guzmán, F., et al. 2017, Rev. Mex. Astron. Astrofis., 53, 385
- Fernández-Martín et al. (2012) Fernández-Martín A., Martín-Gordón D., Vílchez J. M., Pérez Montero E., Riera A., Sánchez S. F., 2012, A&A, 541, A119
- Fullard et al. (2020) Fullard, A. G., St-Louis, N., Moffat, A. F. J., et al. 2020, AJ, 159, 214
- Freyer et al. (2006) Freyer, T., Hensler, G., & Yorke, H. W. 2006, ApJ, 638, 262
- García-Segura & Mac Low (1995) García-Segura, G., & Mac Low, M.-M. 1995, ApJ, 455, 145
- García-Segura et al. (1996) García-Segura, G., Langer, N., & Mac Low, M.-M. 1996, A&A, 316, 133
- Götberg et al. (2018) Götberg, Y., de Mink, S. E., Groh, J. H., et al. 2018, A&A, 615, A78
- Gräfener et al. (2012) Gräfener, G., Vink, J. S., Harries, T. J., et al. 2012, A&A, 547, A83
- Groenewegen et al. (2011) Groenewegen, M. A. T., Waelkens, C., Barlow, M. J., et al. 2011, A&A, 526, A162
- Gruendl et al. (2004) Gruendl, R. A., Chu, Y.-H., & Guerrero, M. A. 2004, ApJ, 617, L127
- Gruendl et al. (2000) Gruendl, R. A., Chu, Y.-H., Dunne, B. C., & Points, S. D. 2000, AJ, 120, 2670
- Gvaramadze et al. (2010) Gvaramadze, V. V., Kniazev, A. Y., & Fabrika, S. 2010, MNRAS, 405, 1047
- Hamann, et al. (2019) Hamann W.-R., et al., 2019, A&A, 625, A57
- Hamann et al. (2006) Hamann, W.-R., Gräfener, G., & Liermann, A. 2006, A&A, 457, 1015
- Hamann & Gräfener (2004) Hamann, W.-R., & Gräfener, G. 2004, A&A, 427, 697
- Hillier & Miller (1998) Hillier, D. J., & Miller, D. L. 1998, ApJ, 496, 407
- Houck, et al. (2004) Houck J. R., et al., 2004, SPIE, 62, SPIE .5487
- Ivanova (2011) Ivanova, N. 2011, ApJ, 730, 76
- Jiménez-Hernández, Arthur & Toalá (2020) Jiménez-Hernández, P., Arthur, S. J., & Toalá, J. A. 2020, Accepted to MNRAS, arXiv:2007.14373, Paper I
- Jones, et al. (1996) Jones A. P., Tielens A. G. G. M., Hollenbach D. J., 1996, ApJ, 469, 740
- Juvela et al. (2013) Juvela, M., Montillaud, J., Ysard, N., et al. 2013, A&A, 556, A63
- Kochanek (2011) Kochanek, C. S. 2011, ApJ, 743, 73
- Kwitter (1981) Kwitter, K. B. 1981, ApJ, 245, 154
- Lü et al. (2013) Lü, G., Zhu, C., & Podsiadlowski, P. 2013, ApJ, 768, 193
- Luridiana et al. (2015) Luridiana, V., Morisset, C., & Shaw, R. A. 2015, A&A, 573, A42
- Marchenko et al. (2002) Marchenko, S. V., Moffat, A. F. J., Vacca, W. D., et al. 2002, ApJ, 565, L59
- Marston et al. (1999) Marston, A. P., Welzmiller, J., Bransford, M. A., et al. 1999, ApJ, 518, 769
- Marston (1996) Marston, A. P. 1996, AJ, 112, 2828
- Marston (1995a) Marston, A. P. 1995a, AJ, 109, 1839
- Marston (1995b) Marston, A. P. 1995b, AJ, 109, 2257
- Marston (1991) Marston A. P., 1991, ApJ, 366, 181
- Marston & Meaburn (1988) Marston, A. P., & Meaburn, J. 1988, MNRAS, 235, 391
- Mason et al. (2009) Mason, B. D., Hartkopf, W. I., Gies, D. R., et al. 2009, AJ, 137, 3358
- Mathis et al. (1977) Mathis, J. S., Rumpl, W., & Nordsieck, K. H. 1977, ApJ, 217, 425
- Mathis, Casinelli & van der Hucht (1992) Mathis J. S., Cassinelli J. P., van der Hucht K. A., Prusti T., Wesselius P. R., Williams P. M., 1992, ApJ, 384, 197
- Méndez-Delgado et al. (2020) Méndez-Delgado, J. E., Esteban, C., García-Rojas, J., et al. 2020, MNRAS, 496, 2726
- Mesa-Delgado (2014) Mesa-Delgado A., Esteban C., García-Rojas J., Reyes-Pérez J., Morisset C., Bresolin F., 2014, ApJ, 785, 100
- Moore, Hester & Scowen (2000) Moore B. D., Hester J. J., Scowen P. A., 2000, AJ, 119, 2991
- Morisset (2013) Morisset, C. 2013, pyCloudy: Tools to manage astronomical Cloudy photoionization code, ascl:1304.020
- Morris et al. (2017) Morris, P. W., Gull, T. R., Hillier, D. J., et al. 2017, ApJ, 842, 79
- Mata et al. (2016) Mata, H., Ramos-Larios, G., Guerrero, M. A., et al. 2016, MNRAS, 459, 841
- Ostrovskii et al. (2020) Ostrovskii A. B., Parfenov S. Y., Vasyunin A. I., Ivlev A. V., Sokolova V. A., 2020, MNRAS, 495, 4314
- Reyes-Pérez et al. (2015) Reyes-Pérez J., Morisset C., Peña M., Mesa-Delgado A., 2015, MNRAS, 452, 1764
- Sana et al. (2012) Sana, H., de Mink, S. E., de Koter, A., et al. 2012, Science, 337, 444
- Scicluna et al. (2015) Scicluna, P., Siebenmorgen, R., Wesson, R., et al. 2015, A&A, 584, L10
- Slavin et al. (2004) Slavin, J. D., Jones, A. P., & Tielens, A. G. G. M. 2004, ApJ, 614, 796
- Smith et al. (2007a) Smith, J.D.T., Armus, L., Dale, A., et al. 2007, PASP, 119, 1133
- Smith et al. (2007b) Smith J. D. T., et al., 2007, ApJ, 656, 770
- St-Louis et al. (1998) St-Louis, N., Doyon, R., Chagnon, F., et al. 1998, AJ, 115, 2475
- Stock & Barlow (2014) Stock, D. J., & Barlow, M. J. 2014, MNRAS, 441, 3065
- Stock & Barlow (2010) Stock, D. J., & Barlow, M. J. 2010, MNRAS, 409, 1429
- Toalá et al. (2019) Toalá, J. A., Ramos-Larios, G., Guerrero, M. A., et al. 2019, MNRAS, 485, 3360
- Toalá et al. (2017) Toalá, J. A., Marston, A. P., Guerrero, M. A., et al. 2017, ApJ, 846, 76
- Toalá et al. (2016) Toalá, J. A., Guerrero, M. A., Chu, Y.-H., et al. 2016, MNRAS, 456, 4305
- Toalá et al. (2015) Toalá, J. A., Guerrero, M. A., Ramos-Larios, G., et al. 2015, A&A, 578, A66
- Toalá et al. (2014) Toalá, J. A., Guerrero, M. A., Gruendl, R. A., et al. 2014, AJ, 147, 30
- Toalá et al. (2012) Toalá, J. A., Guerrero, M. A., Chu, Y.-H., et al. 2012, ApJ, 755, 77
- Toalá & Arthur (2011) Toalá, J. A., & Arthur, S. J. 2011, ApJ, 737, 100
- Tody (1993) Tody, D. 1993, Astronomical Data Analysis Software and Systems II, 173
- Tuthill et al. (1999) Tuthill, P. G., Monnier, J. D., & Danchi, W. C. 1999, Nature, 398, 487
- van Buren & McCray (1988) van Buren, D., & McCray, R. 1988, ApJ, 329, L93
- van der Hucht (2001) van der Hucht, K. A. 2001, New Astron. Rev., 45, 135
- Vamvatira-Nakou et al. (2016) Vamvatira-Nakou, C., Hutsemékers, D., Royer, P., et al. 2016, A&A, 588, A92
- Verhoelst et al. (2009) Verhoelst, T., van der Zypen, N., Hony, S., et al. 2009, A&A, 498, 127
- Wachter et al. (2010) Wachter, S., Mauerhan, J. C., Van Dyk, S. D., et al. 2010, AJ, 139, 2330
- Weis (2001) Weis, K. 2001, Reviews in Modern Astronomy, 14, 261
- Wendker et al. (1975) Wendker, H. J., Smith, L. F., Israel, F. P., et al. 1975, A&A, 42, 173
- Woitke, Dominik & Sedlmayr (1993) Woitke P., Dominik C., Sedlmayr E., 1993, A&A, 274, 451
- Wrigge et al. (2005) Wrigge, M., Chu, Y.-H., Magnier, E. A., et al. 2005, ApJ, 633, 248
Appendix A Dust destruction at the edge of NGC 6888
To further illustrate the correlation between the gap region surrounding NGC 6888 detected in IR images and that of the nebular emission, we have created close-up, grey-scale images of the optical [O iii] and that of the Herschel PACS 70 m of the NE region. The images presented in Figure 11, show with red arrows the position of the [O iii] emission.