A new stress dilatometer and measurement of the thermal expansion under uniaxial stress of Mn3Sn
Abstract
We present a method for measuring thermal expansion under tunable uniaxial stresses, and show measurements of the thermal expansion of Mn3Sn, a room temperature antiferromagnet that exhibits a spontaneous Hall effect, under uniaxial stresses of up to 1.51 GPa compression. Measurement of thermal expansion provides thermodynamic data about the nature of phase transitions, and uniaxial stress provides a powerful tuning method that does not introduce disorder. Mn3Sn exhibits an anomaly in its thermal expansion near 270 K, associated with a first-order change in its magnetic structure. We show this transition temperature is suppressed by 54.6 K by 1.51 GPa compression along [0001]. We find the associated entropy change at the transition to be and to vary only weakly with applied stress.
The application of uniaxial stress modifies lattice constants and can provide powerful insight into the electronic structure of materials. Its effects often differ qualitatively from those of hydrostatic stress. For example, the superconducting critical temperature of YBa2Cu3O6.67 is enhanced by hydrostatic stress, but suppressed by in-plane uniaxial stress.Kim et al. (2018) To date, several techniques have been combined with uniaxial stress, including magnetic susceptibility,Steppke et al. (2017) transport,Barber et al. (2018) nuclear magnetic resonance,Kissikov et al. (2018) and muon spin rotation.Grinenko et al. Dilatometry, the measurement of the thermal expansion of a material, is also an attractive technique to apply to uniaxially stressed samples, because it provides extremely high-precision bulk thermodynamic information. It is orders of magnitude more sensitive to changes in lattice parameter than x-ray or neutron diffraction.Meingast et al. (1990) It has, for example, been utilized in measurements of electron-lattice coupling in electronically and magnetically ordered phasesMeingast et al. (1990, 1991) and to probe thermodynamic effects of quantum criticality.Westerkamp et al. (2009); Küchler et al. (2012); Steppke et al. (2013)
In the majority of modern dilatometers, samples are compressed between two anvils.Küchler et al. (2012) Therefore, a straightforward method to measure thermal expansion under uniaxial stress is to configure the dilatometer to also apply substantial force through these anvils.Küchler, Stingl, and Gegenwart (2016) It has been shown, however, that very high uniaxial stresses and high stress homogeneity can be achieved by preparing samples as narrow beams, embedding the ends in epoxy, and applying force through the epoxy and along the sample length.Barber et al. (2019) In this Letter, our goal is to explore methods for dilatometry measurements built around this sample configuration and to apply them to the hexagonal antiferromagnet Mn3Sn.
In Mn3Sn, the Mn moments form a triangular spin structure below .Tomiyoshi and Yamaguchi (1982); Nagamiya, Tomiyoshi, and Yamaguchi (1982) Recently, this chiral antiferromagnet has attracted considerable attention due to its anomalous transport propertiesNakatsuji, Kiyohara, and Higo (2015); Ikhlas et al. (2017) associated with the presence of magnetic Weyl fermions,Ikhlas et al. (2017); Kuroda et al. (2017) and the potential for applications in spintronics devices.Higo et al. (2018); Tsai et al. (2020) However, stoichiometric Mn3Sn undergoes a first-order transition below 280 K from the triangular spin structure to a spin spiral,Krén et al. (1975); Cable, Wakabayashi, and Radhakrishna (1993) in which the topological transport properties are lost.Sung et al. (2018); Song et al. (2020) While room-temperature application of topological transport properties is therefore possible, this transition prevents their study at low temperature, where greater precision is available through the suppression of thermal fluctuations. By growing off-stoichiometry Mn3+xSn1-x, this transition can be suppressed, but measurement precision then becomes limited by defects rather than thermal fluctuations.
The transition at is accompanied by an expansion along [0001], and our goal here is to suppress as far as possible through compressive uniaxial stress, , which introduces no disorder when the sample deformation is elastic, applied along [0001]. From the Clausius-Clapeyron relationship, we estimate that GPa, where denotes compression, would be required to obtain . Here, we achieve GPa, and show through thermal expansion measurements that, at this stress, is suppressed by 54.6 K.
A piezoelectric-driven uniaxial stress apparatus which incorporates both force and displacement sensors has been presented in Ref.Barber et al., 2019. Such a device could, in principle, be used for dilatometry measurements. In that device, the sample is coupled directly (i.e. through a high-stiffness mechanical link) to piezoelectric actuators. Force is thus delivered at a high spring constant, because piezoelectric actuators are, in general, high-stiffness devices that generate only small displacements. Consequently, the force applied to the sample is not automatically independent of length changes that the sample might undergo, and must instead be held constant through feedback.
The approach we explore here is to place a spring of low spring constant between the piezoelectric actuators and the sample; we term this the conversion spring, as it converts displacement from the actuators into a force on the sample. The advantage is that force is delivered to the sample at a low spring constant. For materials such as Mn3Sn that undergo first-order transitions, this means that the force on the sample does not change drastically even if the sample length changes abruptly. The disadvantage is, to achieve high stresses, the actuators must be long and/or the sample small. Here, the actuators can generate a displacement of 100 . For the force on the sample to be well-controlled, the majority of this displacement must go into the conversion spring. If we specify that 90% should go into the conversion spring, there is only 10 left to compress the sample, as well as the epoxy that holds it and any other coupling elements to the sample. Therefore to reach high strains we limit the sample length to 300 .
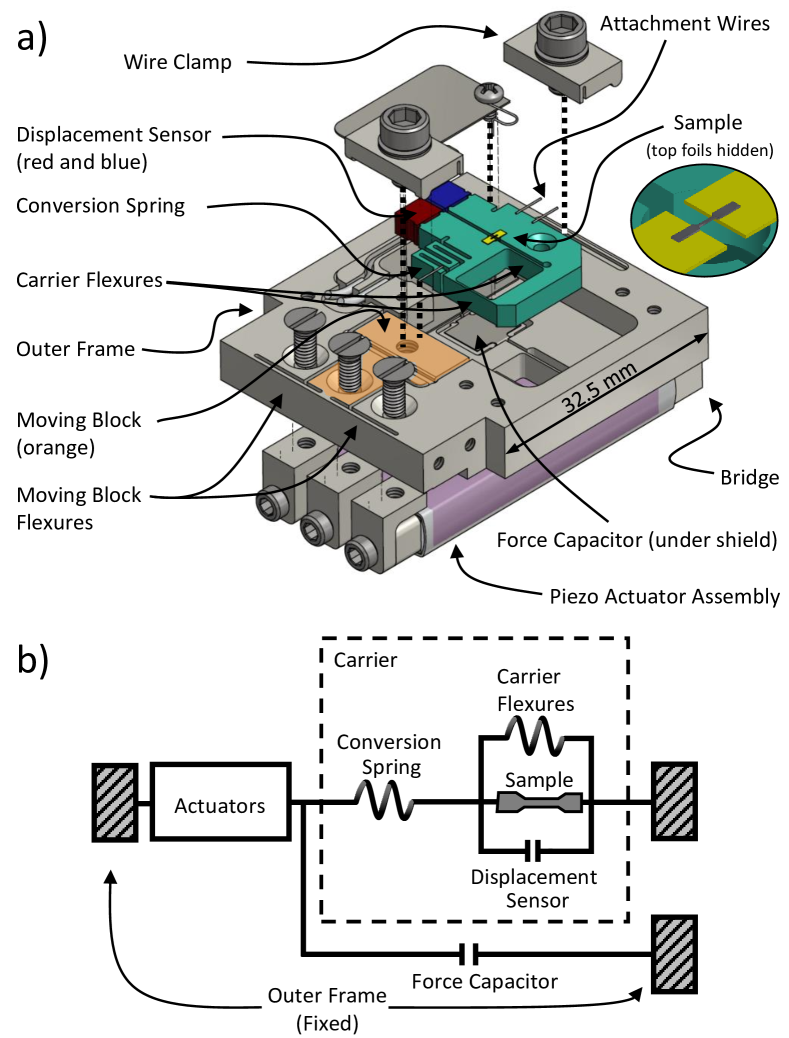
Our design is presented in Fig. 1. Parts, unless otherwise noted, are made out of Grade 2 titanium. The device is composed of a main body that contains an integrated moving block, guided by flexures. Movement of this block is driven by three piezoelectric actuators (PI PICMA® P-885.91) that sit below the main body, are connected to the body by L-shaped brackets, and are joined at their opposite ends by a rectangular prism, a “bridge”. Macor® caps are fixed on both ends of the actuators for electrical isolation, important for high voltage operation in exchange gas. With the actuators fixed together in this manner, expansion of the outer actuator translates the moving block towards the sample carrier and compress the sample. Expansion of the inner actuator tension the sample.
The sample is mounted onto a detachable carrier comprised of two parts, one moving and the other fixed, joined by flexures; the sample spans the moving and fixed parts. The carrier incorporates the conversion spring. It also incorporates a second capacitive sensor, comprised of two blocks separated by , one attached to the moving part and the other to the fixed part. This sensor measures changes in length of the sample, and so is termed the displacement sensor. The rest of the carrier serves as part of the shielding for this capacitor. The carrier is coupled to the cell through attachment wires, here -diameter beryllium copper, which transmit longitudinal applied force to the sample while attenuating large inadvertent torques that may be applied when the carrier is clamped to the rest of the apparatus. A schematic of the essential mechanical connections of the apparatus is shown in Fig. 1b).
Measured capacitances are converted to displacement, , through , where is the capacitor area and is the stray capacitance. is 7.7 and 7.4 mm2 for the force and displacement capacitors, respectively. is the initial capacitor plate separation, 150 m for the force and 10 m for the displacement capacitors. The stray capacitance was found to be negligible for both capacitors. The spring constants of the conversion spring and carrier flexures were measured at room temperature (see Supplementary Information) and are and , respectively. To obtain force, the length change measured by the displacement sensor was subtracted from that measured by the force sensor, to obtain the displacement applied to the conversion spring.
Single crystals of Mn3Sn were grown from Sn flux using the Bridgman method, following protocols reported in a previous study. Ikhlas et al. (2017) After alignment using a Laue diffractometer, single crystals were spark eroded and polished into bar-like shapes and then screened through a combination of magnetometry and heat capacity measurements. The samples selected for study here have K, corresponding to Mn3+xSn1-x compositions with , as measured by inductively coupled plasma spectroscopy.111M. Ikhlas and S. Nakatsuji, in preparation. To provide a control measurement, the thermal expansion of a sample with K was measured using a conventional capacitive dilatometer.Küchler et al. (2012)
Measurements were performed in an Oxford Instruments TeslatronTMPT with a Cernox thermometer mounted to the outer frame of the stress dilatometer. An Andeen-Hagerling capacitance bridge, AH2550A, and a Keysight LCR meter, E4980AL, were used to measure the carrier and force capacitors respectively. To maintain a constant force sensor reading, the applied voltage to the actuators was driven with a proportional-integral-derivative controller. We find, with this experimental configuration, a noise level of 79 pm on the displacement sensor. The dominant contribution to this noise is fluctuations in the applied force from the feedback on the force capacitor. It could be improved by increasing the sensitivity of the force capacitor, e.g. by reducing its , or lengthening the feedback time constant.
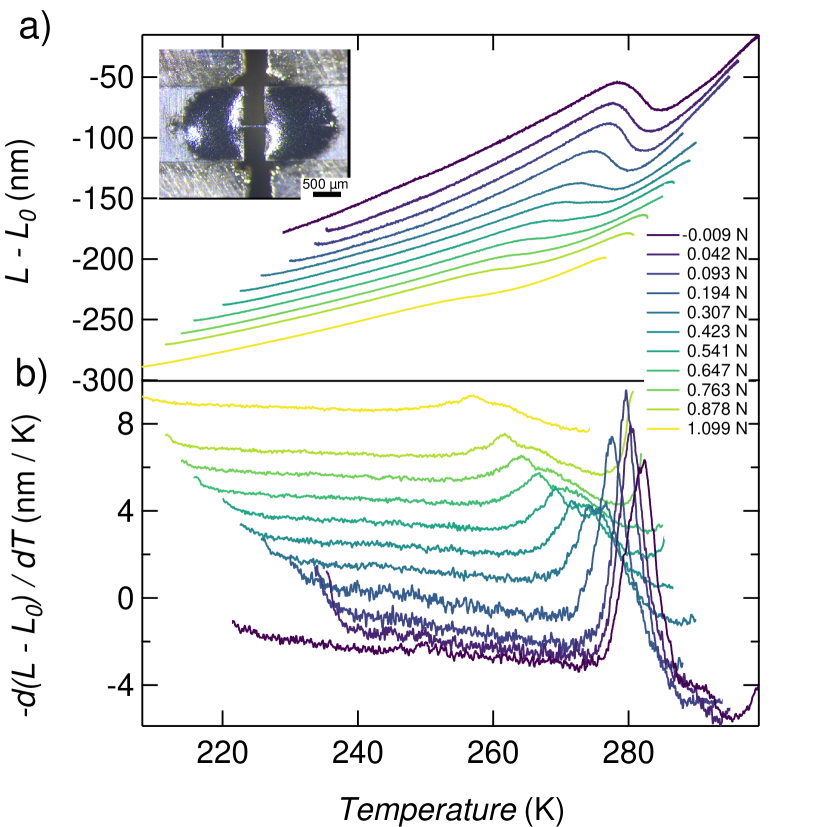
Samples are epoxied across a gap between two 50 m-thick titanium foils. Sample 1, shown in Fig. 2, was prepared with a uniform cross section of 30 x 36 . is, as expected, suppressed by applied pressure, though the transition broadens dramatically as is increased. We attribute this broadening to extended stress-gradient regions in the sample ends, which arise because force is transferred to the sample through the mounting epoxy over a substantial length scale, and the displacement sensor measures the total displacement across the carrier, including deformation of the epoxy and sample ends embedded in the epoxy.
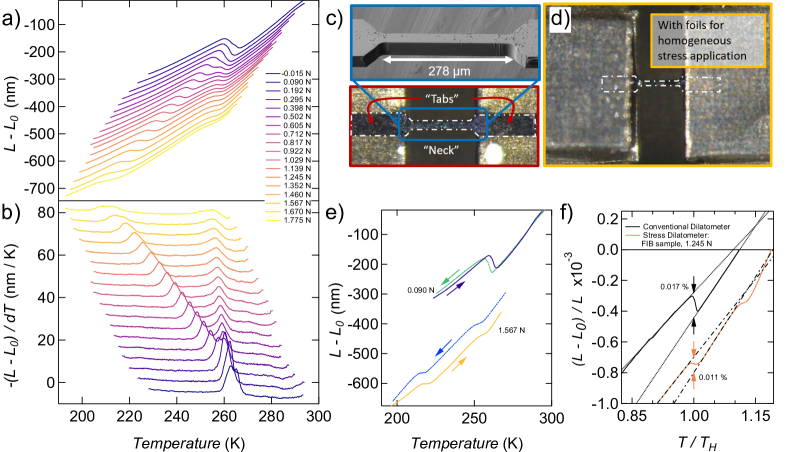
Therefore, to concentrate stress efficiently, we found it essential to mill Sample 2 into a bow-tie shape, using a Thermo Fisher Scientific Helios G4 PFIB UXe Xe2+ plasma focused ion beam instrument, as shown in Fig. 3c). The two wide end portions of the sample are epoxied to the carrier, and serve to couple applied force from the carrier into the central, necked portion of the sample, with cross section of 32 x 36 . By shaping the sample in this way, the shear stress within the epoxy layers is reduced, reducing the contribution to the measurement from the end portions. The sample is then epoxied across the gap between mounting foils, and additional foils are epoxied on top of the tabs to make the mounting symmetric, which improves stress homogeneity by reducing bending.Hicks et al. (2014)
Results are shown in Figs. 3 and 4. Fig. 3 panels a) and b) show the length change of Sample 2 and its derivative for forces from -0.02 to 1.78 N, equivalent to stresses of 0.01 to -1.51 GPa in the neck, applied along [0001]. Two transitions are apparent, one that remains at 260 K independent of the applied stress, and another that shifts to lower temperature as the sample is compressed. We attribute the stress-independent transition to the transition in the tabs of the sample, where the applied stress is low, and the transition that shifts to the transition in the necked portion of the sample. This is in contrast to the broadening seen in Sample 1, and shows that the shaping of the sample gives a sharp dichotomy between high- and low-stress sample regions. Thus, the contributions from the two sections can be cleanly separated. At -1.51 GPa, is suppressed by 54.6 K to 210.9 K. The width of the transition is nearly constant up to -1.33 GPa. Above 1.4 GPa the transition is broadened, which may be due to bending-induced strain inhomogeneity or plastic deformation prior to the sample fracture above 1.6 GPa. Fig. 3e) shows the hysteretic behavior vs. temperature. The first-order nature of the transition is shown by the step-like change in sample length, and hysteresis in between increasing- and decreasing-temperature ramps.
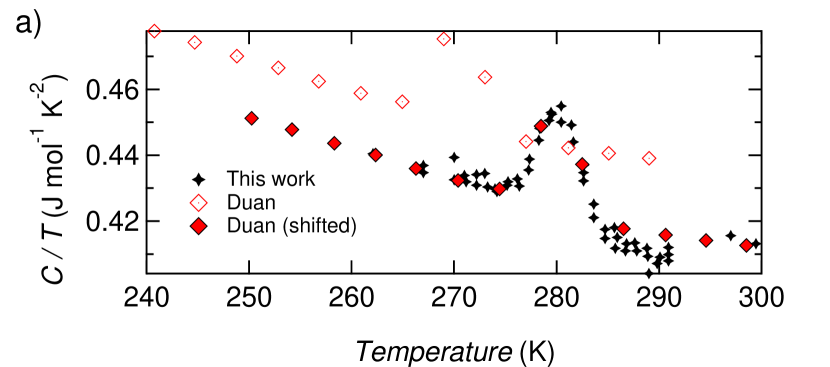
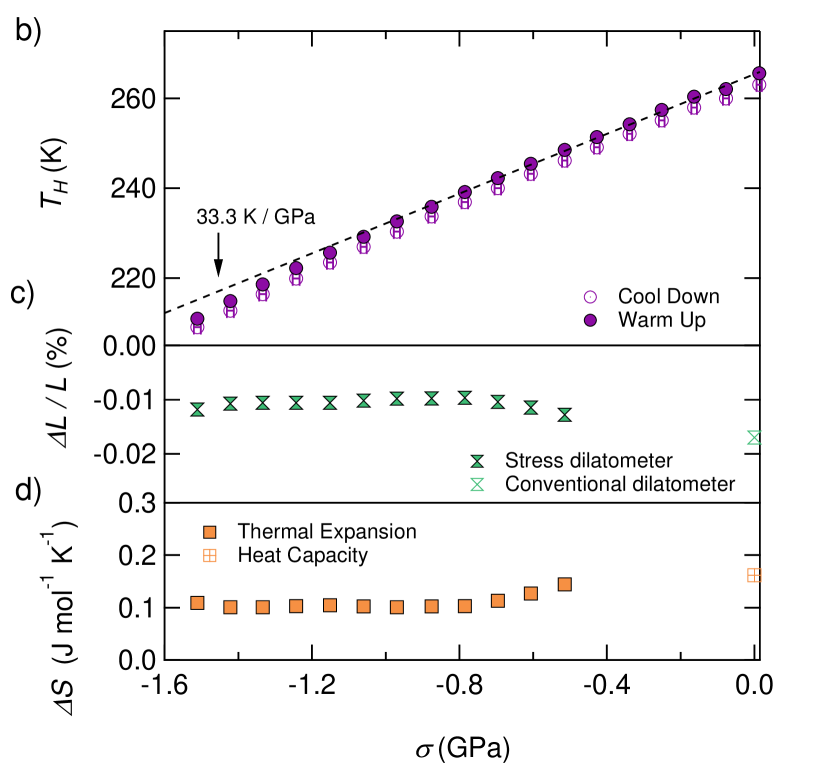
Fig. 4a) shows heat capacity data from a Mn3Sn sample (black) with K and a sample of reported composition Mn3.03Sn0.97 (red) with K reproduced from Ref. Duan et al., 2015. While the transition temperatures of the samples differ, the change in entropy at the transition appears to be similar. Fig. 4b) shows the dependence of on uniaxial pressure for Sample 2. The hysteresis between increasing- and decreasing- ramps is nearly stress-independent. Fig. 4c) shows the fractional length change of at for Sample 2 and that of an unstressed sample measured with a conventional dilatometer. Data points from Sample 2 are not included for pressures below 0.5 GPa, as the overlap between transitions in the neck and tab portions of the sample creates too much uncertainty. Our data in Fig. 4b) and c) can be related to the change in entropy at , , using the Clausius-Clapeyron relation:
| (1) |
which is valid for first order transitions. The negative sign on the left hand side of the equation is due to our convention that compression is negative. With this and our zero-pressure dilatometry and heat capacity data, we estimate the zero pressure slope to be . of Sample 2 is found to be 33.3 K GPa at low , in reasonable agreement with this estimate. The difference may reflect sample-to-sample variation. As is increased to large values, deviates below this slope, see Fig. 4b). Applying the Clausius-Clapeyron relationship to the data of panel c), we find that the entropy change at the transition that the entropy change associated with the transition is mildly suppressed from its zero pressure value to above 0.7 , as shown in Fig. 4d).
From the estimated Young’s modulus of Mn3Sn along the axis ( 63 GPa, Supplementary Information), the sample strain at GPa is 2.4%. As a comparison, it was found that 8% substitution of the Sn site with Mn can suppress the spin spiral transition completely while changing the and lattice constants by only -0.3%,Krén et al. (1975) which indicates that the changes in due to Sn substitution are not primarily due to the effect of the substitution on the lattice constants. A similar case of composition sensitivity in a relatively high-temperature magnetic transition was observed in FeRh.Staunton et al. (2014) In Mn3Sn, it is striking that the spiral transition at is acutely sensitive to changes in composition, and yet, in comparison, mildly responds to lattice strains exceeding 2%. This unexpected response to strain had to be directly measured; it could not be extrapolated from measurements at zero stress using the Clausius-Clapeyron relationship. Our results suggest that, with further technical refinement, suppression of to zero will be achievable, and the methodology presented here will be applicable to a range of other materials.
The authors thank Alexander Steppke and Hilary Noad for their technical expertise and fruitful scientific discussions. We also thank Thomas Lühmann for his help with LabVIEW programming. This work is partially supported by CREST(JPMJCR18T3 and JPMJCR15Q5), Japan Science and Technology Agency, by New Energy and Industrial Technology Development Organization (NEDO), by Grants-in-Aids for Scientific Research on Innovative Areas (15H05882 and 15H05883) from the Ministry of Education, Culture, Sports, Science, and Technology of Japan, and by Grants-in-Aid for Scientific Research (19H00650) from the Japanese Society for the Promotion of Science (JSPS). C.W.H. has 31% ownership of Razorbill Instruments, a United Kingdom company that markets piezoelectric-based uniaxial stress cells.
The data that support the findings of this study are available within the article and its supplementary material. Raw data of this study are available from the corresponding author upon reasonable request.
References
- Kim et al. (2018) H.-H. Kim, S. M. Souliou, M. E. Barber, E. Lefrançois, M. Minola, M. Tortora, R. Heid, N. Nandi, R. A. Borzi, G. Garbarino, A. Bosak, J. Porras, T. Loew, M. König, P. J. W. Moll, A. P. Mackenzie, B. Keimer, C. W. Hicks, and M. L. Tacon, “Uniaxial pressure control of competing orders in a high-temperature superconductor,” Science 362, 1040–1044 (2018).
- Steppke et al. (2017) A. Steppke, L. Zhao, M. E. Barber, T. Scaffidi, F. Jerzembeck, H. Rosner, A. S. Gibbs, Y. Maeno, S. H. Simon, A. P. Mackenzie, and C. W. Hicks, “Strong peak in Tc of Sr2RuO4 under uniaxial pressure,” Science 355, eaaf9398 (2017).
- Barber et al. (2018) M. Barber, A. Gibbs, Y. Maeno, A. Mackenzie, and C. Hicks, “Resistivity in the Vicinity of a van Hove Singularity: Sr2RuO4 under Uniaxial Pressure,” Physical Review Letters 120 (2018), 10.1103/physrevlett.120.076602.
- Kissikov et al. (2018) T. Kissikov, R. Sarkar, M. Lawson, B. T. Bush, E. I. Timmons, M. A. Tanatar, R. Prozorov, S. L. Bud’ko, P. C. Canfield, R. M. Fernandes, and N. J. Curro, “Uniaxial strain control of spin-polarization in multicomponent nematic order of BaFe2as2,” Nature Communications 9 (2018), 10.1038/s41467-018-03377-8.
- (5) V. Grinenko, S. Ghosh, R. Sarkar, J.-C. Orain, A. Nikitin, M. Elender, D. Das, Z. Guguchia, F. Brückner, M. E. Barber, J. Park, N. Kikugawa, D. A. Sokolov, J. S. Bobowski, T. Miyoshi, Y. Maeno, A. P. Mackenzie, H. Luetkens, C. W. Hicks, and H.-H. Klauss, “Split superconducting and time-reversal symmetry-breaking transitions, and magnetic order in sr2ruo4 under uniaxial stress,” 2001.08152v2 .
- Meingast et al. (1990) C. Meingast, B. Blank, H. Bürkle, B. Obst, T. Wolf, H. Wühl, V. Selvamanickam, and K. Salama, “Anisotropic pressure dependence of in single-crystal YBa2Cu3O7 via thermal expansion,” Physical Review B 41, 11299–11304 (1990).
- Meingast et al. (1991) C. Meingast, O. Kraut, T. Wolf, H. Wühl, A. Erb, and G. Müller-Vogt, “Large anisotropy of the expansivity anomaly at in untwinned YBa2cu3o7-δ,” Physical Review Letters 67, 1634–1637 (1991).
- Westerkamp et al. (2009) T. Westerkamp, M. Deppe, R. Küchler, M. Brando, C. Geibel, P. Gegenwart, A. P. Pikul, and F. Steglich, “Kondo-Cluster-Glass State near a Ferromagnetic Quantum Phase Transition,” Physical Review Letters 102 (2009), 10.1103/physrevlett.102.206404.
- Küchler et al. (2012) R. Küchler, T. Bauer, M. Brando, and F. Steglich, “A compact and miniaturized high resolution capacitance dilatometer for measuring thermal expansion and magnetostriction,” Review of Scientific Instruments 83, 095102 (2012).
- Steppke et al. (2013) A. Steppke, R. Küchler, S. Lausberg, E. Lengyel, L. Steinke, R. Borth, T. Luhmann, C. Krellner, M. Nicklas, C. Geibel, F. Steglich, and M. Brando, “Ferromagnetic Quantum Critical Point in the Heavy-Fermion Metal YbNi4(P1-xAsx)2,” Science 339, 933–936 (2013).
- Küchler, Stingl, and Gegenwart (2016) R. Küchler, C. Stingl, and P. Gegenwart, “A uniaxial stress capacitive dilatometer for high-resolution thermal expansion and magnetostriction under multiextreme conditions,” Review of Scientific Instruments 87, 073903 (2016).
- Barber et al. (2019) M. E. Barber, A. Steppke, A. P. Mackenzie, and C. W. Hicks, “Piezoelectric-based uniaxial pressure cell with integrated force and displacement sensors,” Review of Scientific Instruments 90, 023904 (2019).
- Tomiyoshi and Yamaguchi (1982) S. Tomiyoshi and Y. Yamaguchi, “Magnetic Structure and Weak Ferromagnetism of Mn3Sn Studied by Polarized Neutron Diffraction,” Journal of the Physical Society of Japan 51, 2478–2486 (1982).
- Nagamiya, Tomiyoshi, and Yamaguchi (1982) T. Nagamiya, S. Tomiyoshi, and Y. Yamaguchi, “Triangular spin configuration and weak ferromagnetism of Mn3Sn and Mn3Ge,” Solid State Communications 42, 385–388 (1982).
- Nakatsuji, Kiyohara, and Higo (2015) S. Nakatsuji, N. Kiyohara, and T. Higo, “Large anomalous Hall effect in a non-collinear antiferromagnet at room temperature,” Nature 527, 212–215 (2015).
- Ikhlas et al. (2017) M. Ikhlas, T. Tomita, T. Koretsune, M.-T. Suzuki, D. Nishio-Hamane, R. Arita, Y. Otani, and S. Nakatsuji, “Large anomalous Nernst effect at room temperature in a chiral antiferromagnet,” Nature Physics 13, 1085–1090 (2017).
- Kuroda et al. (2017) K. Kuroda, T. Tomita, M.-T. Suzuki, C. Bareille, A. A. Nugroho, P. Goswami, M. Ochi, M. Ikhlas, M. Nakayama, S. Akebi, R. Noguchi, R. Ishii, N. Inami, K. Ono, H. Kumigashira, A. Varykhalov, T. Muro, T. Koretsune, R. Arita, S. Shin, T. Kondo, and S. Nakatsuji, “Evidence for magnetic Weyl fermions in a correlated metal,” Nature Materials 16, 1090–1095 (2017).
- Higo et al. (2018) T. Higo, H. Man, D. B. Gopman, L. Wu, T. Koretsune, O. M. J. van ’t Erve, Y. P. Kabanov, D. Rees, Y. Li, M.-T. Suzuki, S. Patankar, M. Ikhlas, C. L. Chien, R. Arita, R. D. Shull, J. Orenstein, and S. Nakatsuji, “Large magneto-optical Kerr effect and imaging of magnetic octupole domains in an antiferromagnetic metal,” Nature Photonics 12, 73–78 (2018).
- Tsai et al. (2020) H. Tsai, T. Higo, K. Kondo, T. Nomoto, A. Sakai, A. Kobayashi, T. Nakano, K. Yakushiji, R. Arita, S. Miwa, Y. Otani, and S. Nakatsuji, “Electrical manipulation of a topological antiferromagnetic state,” Nature 580, 1–6 (2020).
- Krén et al. (1975) E. Krén, J. Paitz, G. Zimmer, and É. Zsoldos, “Study of the magnetic phase transformation in the mn3sn phase,” Physica B+C 80, 226–230 (1975).
- Cable, Wakabayashi, and Radhakrishna (1993) J. Cable, N. Wakabayashi, and P. Radhakrishna, “A neutron study of the magnetic structure of Mn3Sn,” Solid State Communications 88, 161–166 (1993).
- Sung et al. (2018) N. H. Sung, F. Ronning, J. D. Thompson, and E. D. Bauer, “Magnetic phase dependence of the anomalous Hall effect in Mn3Sn single crystals,” Applied Physics Letters 112 (2018), 10.1063/1.5021133.
- Song et al. (2020) Y. Song, Y. Hao, S. Wang, J. Zhang, Q. Huang, X. Xing, and J. Chen, “Complicated magnetic structure and its strong correlation with the anomalous Hall effect in Mn3Sn,” Physical Review B 144422, 1–7 (2020).
- Note (1) M. Ikhlas and S. Nakatsuji, in preparation.
- Hicks et al. (2014) C. W. Hicks, M. E. Barber, S. D. Edkins, D. O. Brodsky, and A. P. Mackenzie, “Piezoelectric-based apparatus for strain tuning,” Review of Scientific Instruments 85, 065003 (2014).
- Duan et al. (2015) T. F. Duan, W. J. Ren, W. L. Liu, S. J. Li, W. Liu, and Z. D. Zhang, “Magnetic anisotropy of single-crystalline Mn3Sn in triangular and helix-phase states,” Applied Physics Letters 107, 082403 (2015).
- Staunton et al. (2014) J. B. Staunton, R. Banarjee, M. D. S. Dias, A. Deak, and L. Szunyogh, “Fluctuating local moments, itinerant electrons, and the magnetocaloric effect: Compositional hypersensitivity of FeRh,” Physical Review B 89, 1–7 (2014).