Overdoping graphene beyond the van Hove singularity
Abstract
At very high doping levels the van Hove singularity in the band of graphene becomes occupied and exotic ground states possibly emerge, driven by many-body interactions. Employing a combination of ytterbium intercalation and potassium adsorption, we dope epitaxial graphene on silicon carbide past the van Hove singularity, up to a charge carrier density of cm-2. This regime marks the unambiguous completion of a Lifshitz transition in which the Fermi surface topology has evolved from two electron pockets into a giant hole pocket. Angle-resolved photoelectron spectroscopy confirms these changes to be driven by electronic structure renormalizations rather than a rigid band shift. Our results open up the previously unreachable beyond-van-Hove regime in the phase diagram of epitaxial graphene, thereby accessing an unexplored landscape of potential exotic phases in this prototype two-dimensional material.
Graphene, a honeycomb monolayer of carbon atoms, has been extensively studied in view of its two-dimensional (2D) massless Dirac fermions Berger et al. (2004); Novoselov et al. (2005); Geim and Novoselov (2007); Katsnelson (2007); Castro Neto et al. (2009). Recently, the focus has shifted towards inducing correlated phases in this prototype 2D material Wehling et al. (2011); Kotov et al. (2012). The strategy is to increase the density of states at the Fermi level , thus boosting many-body interactions and instabilities towards the pursued ground states. Possible routes are band structure engineering in twisted graphene bilayers Cao et al. (2018a, b); Kerelsky et al. (2019); Lu et al. (2019) or flat band formation in epitaxial bilayer graphene Marchenko et al. (2018). Alternatively, excessive doping of quasi-freestanding monolayer graphene (QFMLG) on SiC pushes the van Hove singularity (VHS) into the vicinity of McChesney et al. (2010); Rosenzweig et al. (2019); Link et al. (2019). There, many-body interactions warp the pointlike VHS into a flat band pinned to along the Brillouin zone (BZ) border: an extended van Hove scenario, reminiscent of high- superconductors Khodel and Shaginyan (1990); Gofron et al. (1994); Lu et al. (1996); Irkhin et al. (2002); Storey et al. (2007); Yudin et al. (2014). Upon reaching the VHS, the Fermi surface (FS) undergoes a Lifshitz transition Lifshitz (1960); Volovik (2017) whereby its topology changes from two electron pockets into a single hole pocket McChesney et al. (2010); Rosenzweig et al. (2019); Link et al. (2019). Concomitantly, theory predicts various ordered ground states such as chiral superconductivity or charge density wave Herbut (2006); Honerkamp (2008); Nandkishore et al. (2012); Kiesel et al. (2012); Black-Schaffer and Honerkamp (2014); Makogon et al. (2011); Raghu et al. (2008). The exact filling factors of the band at which the individual phases may stabilize are however hard to pinpoint in calculations, further complicated by the severe band structure renormalizations which have not been taken into account until recently Link et al. (2019). Experimentally, a tunable -type doping near van Hove filling is therefore desirable. While the carrier density can be reduced away from the VHS Rosenzweig et al. (2019), overdoping has not yet been unambiguously confirmed and remains an important task at the basis of exploring the phase diagram of highly-doped graphene. As more and more electrons are transferred onto QFMLG, the hole pocket in the FS will naturally shrink [Fig. 1(a) bottom], providing direct evidence for overdoping past the Lifshitz transition.
Here, we dope epitaxial graphene on SiC to beyond the VHS. Carrier densities of up to cm-2 are achieved via ytterbium intercalation of the carbon buffer layer and subsequent potassium deposition. Angle-resolved photoelectron spectroscopy (ARPES) reveals a shrinking hole pocket, unambiguously confirming the completion of the Lifshitz transition. The latter is driven by renormalizing bands rather than a rigid band shift, demonstrating the extensive influence of many-body interactions at extreme doping levels. Upon overdoping a previously inaccessible regime is reached in the phase diagram of graphene, where exotic ordered ground states might emerge Herbut (2006); Honerkamp (2008); Nandkishore et al. (2012); Kiesel et al. (2012); Black-Schaffer and Honerkamp (2014); Makogon et al. (2011); Raghu et al. (2008).
The carbon buffer layer was grown on 6H-SiC(0001) following Emtsev et al. (2009). Its transformation into QFMLG via intercalation of ytterbium at a sample temperature of C is detailed elsewhere Rosenzweig et al. (2019). The QFMLG samples were transferred to the synchrotron facility in an ultrahigh vacuum suitcase (Ferrovac GmbH) at a pressure mbar, ensuring sample stability such that no additional annealing was necessary. ARPES was performed at the endstation of the UE112 beamline at BESSY II, Helmholtz-Zentrum Berlin Helmholtz-Zentrum Berlin für Materialien und Energie (2018) using linearly polarized synchrotron radiation and a hemispherical analyzer (Scienta R8000) with a 2D electron detector. The angular resolution was while the maximally achieved energy resolution of the entire setup (beamline and analyzer) was meV. During all experiments the sample was kept at K and the base pressure was mbar. Potassium was deposited in situ on the cold sample from a commercial alkali metal dispenser (SAES Getters; operated at A, V).
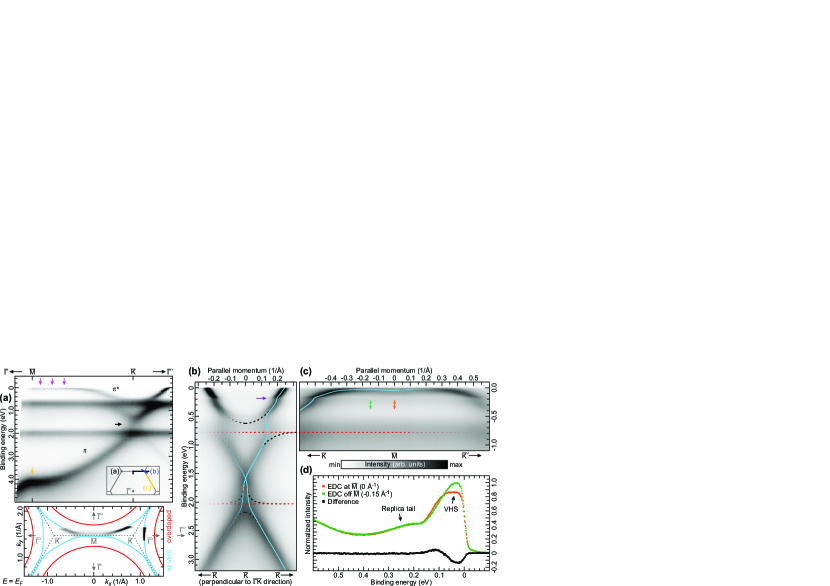
We first set a basis for our overdoping study by presenting high-resolution, low-temperature ARPES of the extended van Hove scenario in pristine Yb-intercalated graphene. The top panel of Fig. 1(a) gives an overview of the dispersion along , probed at a photon energy of eV. Nondispersive Yb states at and eV below are superimposed on the graphene bands. Their conical dispersions near and (black arrow) are connected by the lower band through a saddle point eV below at (yellow arrow). Due to strong doping the band becomes occupied to a large extent and its -point VHS reaches . Contrary to the lower saddle point, the VHS is warped into a flat band pinned to over a wide ( Å-1) momentum range along (magenta arrows), generating a FS hole pocket around [Fig. 1(a) bottom]—the extended van Hove scenario McChesney et al. (2010); Rosenzweig et al. (2019); Link et al. (2019); Khodel and Shaginyan (1990); Gofron et al. (1994); Lu et al. (1996); Irkhin et al. (2002); Storey et al. (2007); Yudin et al. (2014). In a single-particle picture Castro Neto et al. (2009) the Dirac point should lie halfway between the lower and upper saddle points, i.e., about eV below . However, eV in our data. Instead of a purely rigid shift, the band bends down and reduces its bandwidth at by more than eV (cf. Refs. Castro Neto et al. (2009); Bostwick et al. (2007)), therefore reaching the VHS at an electron density on the order of cm-2 Rosenzweig et al. (2019) (cf. below).
Figure 1(b) shows a cut through the Dirac cone at perpendicular to ( eV). The solid blue curves track the spectral maxima of the momentum distribution curves (MDCs). We identify the Dirac point (the branch crossing) at a binding energy of eV, confirming with higher accuracy its previous determination Rosenzweig et al. (2019). The conical dispersion of graphene is distorted around the Yb states (dashed red lines). This becomes most obvious near the level at a binding energy of eV where the group velocity of the band seems to change sign. This unphysical MDC-derived dispersion strongly suggests an anti-crossing-type – hybridization (dashed black guides to the eye)—a scenario supported by band structure calculations for Yb sandwiched in between a freestanding graphene bilayer Hwang et al. (2014). The prominent kink eV below (purple arrow) can be ascribed to electron-phonon interaction Bostwick et al. (2007); Tse and Das Sarma (2007); Forti et al. (2011). From the slope of the real part of the spectral function near *[Usingaparabolicbarebandandthealgorithmof:][.]pletikosic2012 we estimate a total coupling strength , compatible with previous studies of highly -doped graphene on SiC Hwang et al. (2014); Ludbrook et al. (2015).
Figure 1(c) tracks the dispersion along . The solid blue curve is fitted to the MDC (for binding energies eV) and energy distribution curve (EDC, for parallel momenta Å-1) maxima. Interestingly, the flat band seems to disperse very slightly ( meV) through a local minimum at . This tiny dip might be a consequence of the changing EDC lineshape from the edge towards the center of the flat band [Fig. 1(d)]. The VHS signature in the EDC at ( Å-1, orange) is slightly broader, less intense and peaks into a meV wide plateau as compared to the sharper EDC at Å-1 (green) (cf. black difference curve). Linewidth broadening of the flat band along , suggesting a varying quasiparticle scattering rate, has not yet been reported in similar systems McChesney et al. (2010); Link et al. (2019). Naively, one would expect the scattering probability to peak right at if the VHS were still pointlike. In turn, our data suggest that the point’s singular character is partially retained despite the extension of the VHS in space. The decreasing intensity of the flat band towards could be explained by spectral weight redistribution upon VHS extension and linewidth broadening. While being also reminiscent of pseudogap formation as encountered in other correlated materials Valla et al. (2006); Vishik et al. (2010) only temperature-dependent studies at ultimate resolution might shed light on this issue. The flat band at is accompanied by a replica eV below, which seems to emerge out of the kinks at Å-1 in Fig. 1(c) and whose width and intensity do not vary significantly along [Fig. 1(d)]. The same tail exists in the VHS regime of alkali-metal-doped McChesney et al. (2010) as well as Gd-intercalated graphene Link et al. (2019) and was ascribed to polaron formation resulting from the coupling to optical phonons of graphene at . A coupling constant to this specific mode was estimated in Ref. Link et al. (2019), which remains a reasonable value in the present case considering the similar intensity ratio () between the VHS peak and the plateau eV below. These resemblances suggest that the feature is intrinsic to the extended van Hove scenario of graphene and, apart from the necessary charge transfer, independent of the respective dopants. Apparently, is strongly enhanced compared to graphene outside the VHS regime Fedorov et al. (2014). This is compatible with the hole pockets of adjacent BZs running parallel and very close to each other over a wide range along [Fig. 1(a) bottom] such that FS nesting will promote resonant coupling to the aforementioned zone-center phonons Link et al. (2019). While the flat band formation (not its replica) was linked to spin fluctuations within graphene Link et al. (2019), charged impurity scattering—promoted via a disordered intercalant Rosenzweig et al. (2019)—could also account for band flattening, pronounced kinks along and a flat band replica near the kink energy Kaasbjerg and Jauho (2019); *kaasbjerg2019b. The observed features might therefore emerge from a combination of these different mechanisms.
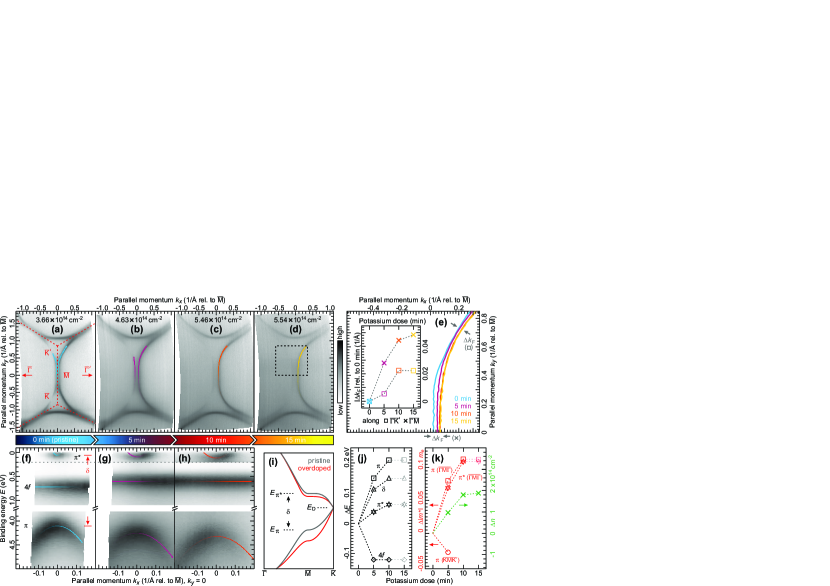
Figure 2(a) displays the FS of Yb-intercalated graphene, covering large portions of the first and adjacent BZs ( eV). Entailed by the extended van Hove scenario, the two electron pockets centered at and demonstrate strong triangular warping and merge into a giant hole pocket around via a Lifshitz transition Lifshitz (1960); Volovik (2017). The FS is quantified by fitting the MDCs in direction for Å-1. From the contour around in the repeated BZ [blue curves in Figs. 2(a), (e)] and following Luttinger’s theorem Luttinger and Ward (1960); Luttinger (1960) we infer an electron density of cm-2 111The vertical BZ border does not perfectly coincide with in experiment. The fitted contours [Figs. 2(a)–2(e)] are corrected for these deviations considering the FS symmetry relative to . Being separated by only Å-1 from the border, the individual hole-like contours of adjacent BZs cannot be unambiguously discerned, i.e., the VHS remains pinned to and the system is held right at the Lifshitz transition. Upon additional charge transfer onto QFMLG (i.e., overdoping), the completion of the Lifshitz transition could be directly visualized by a shrinking hole pocket [Fig. 1(a) bottom]. We thus performed sequential, 5-min-long deposition cycles of potassium, a well-known -type dopant for epitaxial graphene Ohta et al. (2006). After the first dosage the distance between the hole contour and the line has increased by a factor of to Å-1 [purple curves in Figs. 2(b), (e)] and the FS fit confirms an elevated carrier density of cm-2. Note also the suppression of the band inside the first BZ () due to matrix-element effects (dark corridor) Gierz et al. (2011) and the deteriorating signal-to-noise ratio following potassium adsorption. After 10 min of exposure the hole pockets have shrunk to such extent that their individual contours are clearly distinguishable across the borders and the Lifshitz transition has unambiguously concluded at a charge carrier density of cm-2 [Fig. 2(c)]. Finally, during a third deposition cycle, the FS does no longer change significantly, indicating a saturation of doping within the error range [Fig. 2(d), cm-2]. Figure 2(e) displays a zoomed-in view of the fitted FS contours of Figs. 2(a)–2(d) used to derive the carrier densities. For pristine Yb-intercalated graphene (blue) the giant hole pocket assumes the shape of a flattened circle as the VHS extends along . With increasing potassium dose its contour becomes more and more circular (purple, orange) until saturation sets in (yellow). The inset tracks the absolute changes of the Fermi wavevector along and relative to the pristine sample. While the initial evolution is restricted to the extended-VHS sector and the direction remains basically unaffected, the hole pocket shrinks rather isotropically during the second deposition cycle. This suggests that surpassing the Fermi level pinning of the VHS is indeed the critical step in achieving the desired overdoping.
The energy-momentum cuts of Figs. 2(f)–2(h) reveal the evolution of the electronic structure in the vicinity of towards and with increasing potassium dose 222Corresponding data for 15 min exposure not available. The solid curves are parabolic fits to the spectral maxima and highlight the upward (downward) dispersion of the () band perpendicular to 333In Figs. 2(f)–2(h), the fits to the band adopt fixed crossings according to the FS fits of Figs. 2(a)–2(c).. The changes in binding energy and absolute effective mass at of the individual bands are plotted relative to the pristine sample in Figs. 2(j) and 2(k), respectively. With increasing potassium exposure the data quality degrades and the spectral weight of the bands is progressively quenched. In combination with the decreased energy resolution of eV, errors of up to % (in particular for ) can result and we do not aim at an overly quantitative analysis. Yet our data support a consistent picture of -band renormalizations in overdoped graphene [Fig. 2(i)], which will hopefully stimulate further theoretical modelling. First we note that the binding energy of the Yb state decreases upon potassium exposure, qualitatively matching the previously reported increase when reducing the doping away from the VHS Rosenzweig et al. (2019). In order to reach the extended van Hove scenario of Figs. 2(a) and 2(f), the band had to bend down considerably whereas the bandwidth ( eV) is only slightly lower than for intrinsic monolayer graphene on SiC ( eV) Bostwick et al. (2007). As such the – bandgap at , eV, has decreased compared to the tight-binding description relevant for lower doping levels. While both and increase with potassium doping [Fig. 2(j)], the band is much more affected, contrary to when QFMLG is initially doped up to the VHS. In consequence of this nonrigid band warping beyond a simple shift of , has already expanded by more than eV following the first deposition cycle. That is, the trend of a reduced – gap with increasing doping McChesney et al. (2010); Rosenzweig et al. (2019); Link et al. (2019) reverses once QFMLG is overdoped past the VHS. The system thus counteracts the imposed overdoping and tries to keep the VHS close to by pushing the bands away from each other at [Fig. 2(i)]. This scenario is substantiated by the apparent increase in (i.e., decrease in curvature) along for both bands [Fig. 2(k)]. In the orthogonal direction, the absolute effective mass of the band at decreases, suggesting that the Dirac point energy does not move rigidly with [Fig. 2(i)]. At this point, a substantial downshift of together with the entire -band system can also be excluded due to the basically constant size of the FS hole pocket in direction [Fig. 2(e)]. therefore appears to act as a relatively inert reference level of the renormalizing -band structure near van Hove filling, consistent with QFMLG underdoped to below the VHS Rosenzweig et al. (2019). Although increases linearly over the first two deposition cycles [Fig. 2(k)], the bands and their effective masses along seem to renormalize considerably less during the second exposure 444Data along not available. This could be explained by the fading influence of the VHS Fermi-level pinning, now that it has clearly been surpassed. In parallel, the FS evolves more isotropically [Fig. 2(e)] indicating a transition to a doping-induced shift of the entire -band system instead of band warping which dominates across the Lifshitz transition. As the observed band structure renormalizations cannot be described in a single-particle picture Link et al. (2019); Ulstrup et al. (2016) our experiments highlight the influence of nonlocal many-body effects in graphene under extreme -type (over)doping.
In summary, epitaxial graphene on SiC is doped past the extended van Hove singularity, up to a carrier density of cm-2, through a combination of ytterbium intercalation and potassium adsorption. Angle-resolved photoelectron spectroscopy confirms the overdoping by probing a shrinking hole pocket in the Fermi surface. The completion of the associated Lifshitz transition is driven by electronic structure renormalizations rather than a rigid band shift, exemplified by an increasing energy gap between the upper and lower bands at . Our results open up the previously inaccessible beyond-van-Hove regime in the phase diagram of graphene where a variety of exotic ground states may stabilize.
Acknowledgements.
We would like to thank Helmholtz-Zentrum Berlin for the allocation of synchrotron radiation beamtime under proposals 182-07119-ST and 191-08299-ST/R. We are grateful to Kristen Kaasbjerg for providing valuable information on charged impurity scattering in doped graphene. This work was supported by the Deutsche Forschungsgemeinschaft (DFG) through Sta315/9-1.References
- Berger et al. (2004) C. Berger, Z. Song, T. Li, X. Li, A. Y. Ogbazghi, R. Feng, Z. Dai, A. N. Marchenkov, E. H. Conrad, P. N. First, and W. A. de Heer, J. Phys. Chem. B 108, 19912 (2004).
- Novoselov et al. (2005) K. S. Novoselov, A. K. Geim, S. V. Morozov, D. Jiang, M. I. Katsnelson, I. V. Grigorieva, S. V. Dubonos, and A. A. Firsov, Nature (London) 438, 197 (2005).
- Geim and Novoselov (2007) A. K. Geim and K. S. Novoselov, Nat. Mater. 6, 183 (2007).
- Katsnelson (2007) M. I. Katsnelson, Mater. Today 10, 20 (2007).
- Castro Neto et al. (2009) A. H. Castro Neto, F. Guinea, N. M. R. Peres, K. S. Novoselov, and A. K. Geim, Rev. Mod. Phys. 81, 109 (2009).
- Wehling et al. (2011) T. O. Wehling, E. Şaşıoğlu, C. Friedrich, A. I. Lichtenstein, M. I. Katsnelson, and S. Blügel, Phys. Rev. Lett. 106, 236805 (2011).
- Kotov et al. (2012) V. N. Kotov, B. Uchoa, V. M. Pereira, F. Guinea, and A. H. Castro Neto, Rev. Mod. Phys. 84, 1067 (2012).
- Cao et al. (2018a) Y. Cao, V. Fatemi, K. Watanabe, T. Taniguchi, E. Kaxiras, and P. Jarillo-Herrero, Nature (London) 556, 43 (2018a).
- Cao et al. (2018b) Y. Cao, V. Fatemi, A. Demir, S. Fang, S. L. Tomarken, J. Y. Luo, J. D. Sanchez-Yamagishi, K. Watanabe, T. Taniguchi, E. Kaxiras, R. C. Ashoori, and P. Jarillo-Herrero, Nature (London) 556, 80 (2018b).
- Kerelsky et al. (2019) A. Kerelsky, L. J. McGilly, D. M. Kennes, L. Xian, M. Yankowitz, S. Chen, K. Watanabe, T. Taniguchi, J. Hone, C. Dean, A. Rubio, and A. N. Pasupathy, Nature (London) 572, 95 (2019).
- Lu et al. (2019) X. Lu, P. Stepanov, W. Yang, M. Xie, M. A. Aamir, I. Das, C. Urgell, K. Watanabe, T. Taniguchi, G. Zhang, A. Bachtold, A. H. MacDonald, and D. K. Efetov, Nature (London) 574, 653 (2019).
- Marchenko et al. (2018) D. Marchenko, D. V. Evtushinsky, E. Golias, A. Varykhalov, Th. Seyller, and O. Rader, Sci. Adv. 4, eaau0059 (2018).
- McChesney et al. (2010) J. L. McChesney, A. Bostwick, T. Ohta, Th. Seyller, K. Horn, J. González, and E. Rotenberg, Phys. Rev. Lett. 104, 136803 (2010).
- Rosenzweig et al. (2019) Ph. Rosenzweig, H. Karakachian, S. Link, K. Küster, and U. Starke, Phys. Rev. B 100, 035445 (2019).
- Link et al. (2019) S. Link, S. Forti, A. Stöhr, K. Küster, M. Rösner, D. Hirschmeier, C. Chen, J. Avila, M. C. Asensio, A. A. Zakharov, T. O. Wehling, A. I. Lichtenstein, M. I. Katsnelson, and U. Starke, Phys. Rev. B 100, 121407(R) (2019).
- Khodel and Shaginyan (1990) V. A. Khodel and V. R. Shaginyan, JETP Lett. 51, 553 (1990).
- Gofron et al. (1994) K. Gofron, J. C. Campuzano, A. A. Abrikosov, M. Lindroos, A. Bansil, H. Ding, D. Koelling, and B. Dabrowski, Phys. Rev. Lett. 73, 3302 (1994).
- Lu et al. (1996) D. H. Lu, M. Schmidt, T. R. Cummins, S. Schuppler, F. Lichtenberg, and J. G. Bednorz, Phys. Rev. Lett. 76, 4845 (1996).
- Irkhin et al. (2002) V. Y. Irkhin, A. A. Katanin, and M. I. Katsnelson, Phys. Rev. Lett. 89, 076401 (2002).
- Storey et al. (2007) J. G. Storey, J. L. Tallon, and G. V. M. Williams, Phys. Rev. B 76, 174522 (2007).
- Yudin et al. (2014) D. Yudin, D. Hirschmeier, H. Hafermann, O. Eriksson, A. I. Lichtenstein, and M. I. Katsnelson, Phys. Rev. Lett. 112, 070403 (2014).
- Lifshitz (1960) I. Lifshitz, Sov. Phys. JETP 11, 1130 (1960).
- Volovik (2017) G. E. Volovik, Low Temp. Phys. 43, 47 (2017).
- Herbut (2006) I. F. Herbut, Phys. Rev. Lett. 97, 146401 (2006).
- Honerkamp (2008) C. Honerkamp, Phys. Rev. Lett. 100, 146404 (2008).
- Nandkishore et al. (2012) R. Nandkishore, L. S. Levitov, and A. V. Chubukov, Nat. Phys. 8, 158 (2012).
- Kiesel et al. (2012) M. L. Kiesel, C. Platt, W. Hanke, D. A. Abanin, and R. Thomale, Phys. Rev. B 86, 020507(R) (2012).
- Black-Schaffer and Honerkamp (2014) A. M. Black-Schaffer and C. Honerkamp, J. Phys.: Condens. Matter 26, 423201 (2014).
- Makogon et al. (2011) D. Makogon, R. van Gelderen, R. Roldán, and C. M. Smith, Phys. Rev. B 84, 125404 (2011).
- Raghu et al. (2008) S. Raghu, X.-L. Qi, C. Honerkamp, and S.-C. Zhang, Phys. Rev. Lett. 100, 156401 (2008).
- Emtsev et al. (2009) K. V. Emtsev, A. Bostwick, K. Horn, J. Jobst, G. L. Kellogg, L. Ley, J. L. McChesney, T. Ohta, S. A. Reshanov, J. Röhrl, E. Rotenberg, A. K. Schmid, D. Waldmann, H. B. Weber, and Th. Seyller, Nat. Mater. 8, 203 (2009).
- Helmholtz-Zentrum Berlin für Materialien und Energie (2018) Helmholtz-Zentrum Berlin für Materialien und Energie, J. Large-Scale Res. Facil. 4, A128 (2018).
- Bostwick et al. (2007) A. Bostwick, T. Ohta, Th. Seyller, K. Horn, and E. Rotenberg, Nat. Phys. 3, 36 (2007).
- Hwang et al. (2014) C. Hwang, D. Y. Kim, D. A. Siegel, K. T. Chan, J. Noffsinger, A. V. Fedorov, M. L. Cohen, B. Johansson, J. B. Neaton, and A. Lanzara, Phys. Rev. B 90, 115417 (2014).
- Tse and Das Sarma (2007) W.-K. Tse and S. Das Sarma, Phys. Rev. Lett. 99, 236802 (2007).
- Forti et al. (2011) S. Forti, K. V. Emtsev, C. Coletti, A. A. Zakharov, C. Riedl, and U. Starke, Phys. Rev. B 84, 125449 (2011).
- Pletikosić et al. (2012) I. Pletikosić, M. Kralj, M. Milun, and P. Pervan, Phys. Rev. B 85, 155447 (2012) .
- Ludbrook et al. (2015) B. M. Ludbrook, G. Levy, P. Nigge, M. Zonno, M. Schneider, D. J. Dvorak, C. N. Veenstra, S. Zhdanovich, D. Wong, P. Dosanjh, C. Straßer, A. Stöhr, S. Forti, C. R. Ast, U. Starke, and A. Damascelli, Proc. Nat. Acad. Sci. U.S.A. 112, 11795 (2015) .
- Valla et al. (2006) T. Valla, A. V. Fedorov, J. Lee, J. C. Davis, and G. D. Gu, Science 314, 1914 (2006).
- Vishik et al. (2010) I. M. Vishik, W. S. Lee, R. H. He, M. Hashimoto, Z. Hussain, T. P. Devereaux, and Z.-X. Shen, New J. Phys. 12, 105008 (2010).
- Fedorov et al. (2014) A. V. Fedorov, N. I. Verbitskiy, D. Haberer, C. Struzzi, L. Petaccia, D. Usachov, O. Y. Vilkov, D. V. Vyalikh, J. Fink, M. Knupfer, B. Büchner, and A. Grüneis, Nat. Commun. 5, 3257 (2014) .
- Kaasbjerg and Jauho (2019) K. Kaasbjerg and A.-P. Jauho, Phys. Rev. B 100, 241405(R) (2019).
- (43) K. Kaasbjerg, (private communication).
- Luttinger and Ward (1960) J. M. Luttinger and J. C. Ward, Phys. Rev. 118, 1417 (1960).
- Luttinger (1960) J. M. Luttinger, Phys. Rev. 119, 1153 (1960).
- Note (1) The vertical BZ border does not perfectly coincide with in experiment. The fitted contours [Figs. 2(a)–2(e)] are corrected for these deviations considering the FS symmetry relative to .
- Ohta et al. (2006) T. Ohta, A. Bostwick, Th. Seyller, K. Horn, and E. Rotenberg, Science 313, 951 (2006).
- Gierz et al. (2011) I. Gierz, J. Henk, H. Höchst, C. R. Ast, and K. Kern, Phys. Rev. B 83, 121408(R) (2011).
- Note (2) Corresponding data for 15 min exposure not available.
- Note (3) In Figs. 2(f)–2(h), the fits to the band adopt fixed crossings according to the FS fits of Figs. 2(a)–2(c).
- Note (4) Data along not available.
- Ulstrup et al. (2016) S. Ulstrup, M. Schüler, M. Bianchi, F. Fromm, C. Raidel, Th. Seyller, T. Wehling, and P. Hofmann, Phys. Rev. B 94, 081403(R) (2016).