Multi-Gigayear White Dwarf Cooling Delays from Clustering-Enhanced Gravitational Sedimentation
Abstract
Cooling white dwarfs (WDs) can yield accurate ages when theoretical cooling models fully account for the physics of the dense plasma of WD interiors. We use MESA to investigate cooling models for a set of massive and ultra-massive WDs (0.9–1.3 ) for which previous models fail to match kinematic age indicators based on Gaia DR2. We find that the WDs in this population can be explained as C/O cores experiencing unexpectedly rapid 22Ne sedimentation in the strongly liquid interior just prior to crystallization. We propose that this rapid sedimentation is due to the formation of solid clusters of 22Ne in the liquid C/O background plasma. We show that these heavier solid clusters sink faster than individual 22Ne ions and enhance the sedimentation heating rate enough to dramatically slow WD cooling. MESA models including our prescription for cluster formation and sedimentation experience cooling delays of 4 Gyr on the WD Q branch, alleviating tension between cooling ages and kinematic ages. This same model then predicts cooling delays coinciding with crystallization of 6 Gyr or more in lower mass WDs (0.6–0.8 ). Such delays are compatible with, and perhaps required by, observations of WD populations in the local 100 pc WD sample and the open cluster NGC 6791. These results motivate new investigations of the physics of strongly coupled C/O/Ne plasma mixtures in the strongly liquid state near crystallization and tests through comparisons with observed WD cooling.
1 Introduction
White dwarfs (WDs) are stellar embers that, when isolated from interaction with other stars, cool and fade over Gyr timescales as they radiate away their residual thermal energy and eventually crystallize (Fontaine et al., 2001; Althaus et al., 2010b). WD temperatures and luminosities therefore serve as important age indicators for these stars and their environments. Early work on WD cooling found that timescales for WD cooling depend primarily on thermal transport in the outer layers and the total thermal energy of the ionized plasma in the WD interior (Mestel, 1952). Later work showed that as a WD becomes fainter and its interior cools, it is important to account for other sources of energy such as the latent heat released by interior phase transitions (van Horn, 1968), chemical separation (Mochkovitch, 1983; Isern et al., 1991; Segretain et al., 1994), and heavy element sedimentation (Bildsten & Hall, 2001).
Recent data from the Gaia mission (Gaia Collaboration et al., 2016) have greatly enriched the sample of known WDs (Bergeron et al., 2019; Coutu et al., 2019; McCleery et al., 2020; Kilic et al., 2020) and enabled new tests of WD cooling theory and its applications. In particular, Cheng et al. (2019) recently studied a sample of nearby (within 250 pc), ultra-massive WDs from the Gentile Fusillo et al. (2019) catalog, which is based on Gaia DR2 (Gaia Collaboration et al., 2018a, b). Using the transverse velocity as a dynamical age indicator of this local population, they found evidence for a sub-population of WDs that appear to be cooling much more slowly than predicted by WD cooling theory. Cheng et al. (2019) estimated that this extra cooling delay may be explained by heat released as 22Ne sediments in the WD interiors just before they crystallize. Our aim in this work is to investigate this claim using detailed evolutionary models of cooling WDs, and describe a physically motivated modification to the theory of 22Ne sedimentation in WD interiors that can bring theoretical WD cooling models into agreement with observations.
The WDs that are the focus of the Cheng et al. (2019) study occupy a region of the HR diagram known as the WD “Q branch.” This region is named for the DQ WDs showing spectral signatures of carbon in their atmospheres that are common in this region of the HR diagram and likely descend from WD mergers (Dunlap & Clemens, 2015; Coutu et al., 2019; Koester & Kepler, 2019; Cheng et al., 2019), though DA and DB WDs can also be found on the Q branch. The overdensity of massive and ultra-massive WDs () that forms the Q branch coincides with interior crystallization (Tremblay et al., 2019).
Cheng et al. (2019) argue from transverse velocity data that 5–10% of ultra-massive WDs experience a cooling delay of 6–8 Gyr when they reach this region of the HR diagram. The total amount of energy available to be released by sedimentation of heavy elements (22Ne in particular) in the liquid interior prior to crystallization is enough to power a cooling delay of this magnitude (Bildsten & Hall, 2001; Deloye & Bildsten, 2002; García-Berro et al., 2008), but WD cooling and single-particle diffusion calculations indicate that these delays will not be realized unless the sedimentation rates are much higher than expected. We pursue the hypothesis that the necessary enhancement is caused by 22Ne clustering and the subsequently more rapid sinking of larger clusters. While some previous WD observations have set lower bounds on the order of 1 Gyr for the total cooling delays required from 22Ne sedimentation (e.g., 0.6 WDs in NGC 6791, Bedin et al. 2008; García-Berro et al. 2010), the 6–8 Gyr magnitude of the cooling delay for ultra-massive WDs on the Q branch is by far the longest delay required by observational evidence. We therefore calibrate our 22Ne clustering model to satisfy the stringent requirements of the Q branch observations before going on to explore consequences for other WD populations.
In this work, we investigate detailed WD cooling models that account for these physical phenomena using the stellar evolution code Modules for Experiments in Stellar Astrophysics (MESA, Paxton et al. 2011, 2013, 2015, 2018, 2019). In Section 2, we describe how we use MESA to construct massive and ultra-massive WD models suitable for cooling timescale calculations. Section 3 presents the physics of WD cooling and describes implementations in MESA, along with a set of standard MESA WD cooling models that provide a baseline expectation for cooling timescales in models that exclude 22Ne sedimentation. In Section 4, we show that the diffusion coefficients for individual 22Ne ions are now well constrained theoretically, and the resulting single-particle sedimentation speeds are too slow for the rate at which sedimentation energy must be released to explain the cooling delay for a subset of ultra-massive WDs on the Q branch. Section 5 introduces MESA models implementing our proposed solution: an enhancement to sedimentation speeds due to the formation of heavier 22Ne clusters in the strongly-coupled liquid interior just before crystallization sets in. After calibrating our model to explain the observations of ultra-massive WDs on the Q branch, we then explore predictions for cooling delays in lower mass (0.6–0.8 ) WDs. Appendices A–C provide further details on the physical formalism we employ for heating associated with mixing and sedimentation in multicomponent plasmas.
2 Initial White Dwarf Models
To construct massive and ultra-massive C/O and O/Ne WD models, we begin from the input files of Lauffer et al. (2018) who previously created a suite of WD models with . We use MESA version r10398 and make two important modifications to their approach. First, we use the nuclear network sagb_NeNa_MgAl.net. Unlike co_burn_plus.net used by Lauffer et al. (2018), this network includes which is produced in carbon burning and is typically the third most abundant isotope in an O/Ne WD (e.g., Siess, 2006). Second, we turn off convective overshoot below the carbon burning flame, preventing the formation of hybrid CO/ONe WDs around .
We focus on WDs descended from metal-rich progenitors to maximize the potential effect of sedimentation heating on their cooling. We run a model with initial metallicity of , producing a C/O WD. We also run a model with metallicity that produces an O/Ne WD of mass . We are particularly interested in studying long cooling delays due to sedimentation of 22Ne, which appears in a WD interior at abundances that reflect the initial CNO abundances of the WD progenitor star. WDs that experience cooling delays of many Gyr from such a mechanism must descend from stars that formed in -element rich environments many Gyr ago. Fe abundances produced later in galactic chemical evolution are not relevant for the production of 22Ne in WD interiors, so it is likely that the most delayed WDs that we study here are related to the high [] population of old stars in the galactic disk (Nidever et al., 2014; Hayden et al., 2015; Mackereth et al., 2019; Sharma et al., 2020).
We also view our ultra-massive C/O WD models as potentially representing WD merger products. The surface abundances of the R Coronae Borealis (RCB) stars, which are thought to be the products of He WD - C/O WD mergers, show evidence of nucleosynthesis that must occur in the aftermath of the merger (e.g., Jeffery et al., 2011). In particular, the extreme enhancement of 18O observed in the RCB stars (Clayton et al., 2007) demonstrates the occurrence of CNO-cycle hydrogen burning to produce and the first steps of the helium-burning sequence that, if completed, would produce 22Ne. Calculations in the RCB context (e.g., Staff et al., 2012) indicate that mergers could plausibly lead to enhancements in the 22Ne mass fraction of in the hot, dense region created around the interface of the merged WDs. While locally significant, when distributed across the WD, this amount of 22Ne would represent an enrichment to the 22Ne mass fraction of 0.01 or less, so the merger process appears likely to provide at most a modest enhancement to 22Ne. Broadly, we view our ultra-massive C/O WD models as representing double C/O WD merger products, in which each WD individually processed its initial CNO metallicity into 22Ne, the merger process itself produced negligible further enrichment of 22Ne, and so the 22Ne abundance throughout the bulk of the final WD merger product still approximately reflects the initial metallicity with which the stars were formed.
The Lauffer et al. (2018) models completely remove the stellar envelope with strong winds. This choice is not physically motivated, but allows the models to skip the challenging and time-consuming evolution through the thermally-pulsing asymptotic giant branch (TP-AGB). As a result, the outer layers of the WD that are assembled during the TP-AGB and the final H and He layers are not self-consistently generated in our models. To create a simple He atmosphere, we then add of pure He by accretion on the surface before cooling begins. Subsequent diffusion at the boundary between this outer He layer and the underlying C quickly establishes a smooth transition region at the base of the He envelope.
As DB WDs, our models will not always match the spectral classification of the many DQ and DA WDs found in the Q branch region of the color-magnitude diagram (CMD), but their cooling properties will be sufficient for our study here. Ultra-massive WDs on the Q branch are still relatively luminous and hot, and so the cooling timescales of DA and DB WDs in this regime are very similar (Camisassa et al., 2019). Only after cooling below the Q branch do DA and DB WDs develop significantly different cooling timescales. Similarly, we expect that DQ WDs do not have markedly different cooling properties from DB WDs on the Q branch, though we are not aware of any detailed studies that model DQ WD cooling timescales specifically.
In order to study the range of WD masses relevant for the Q branch (), we scale the mass of these models using the MESA control relax_mass_scale. This preserves the composition profile as a function of fractional mass coordinate. As a consequence, our models cannot explore the effects of any mass-dependent trends in the chemical composition, but this is not important for our purposes. This scaling procedure allows us to easily construct models that are difficult to produce from single star evolution, such as C/O WDs with created by WD mergers.
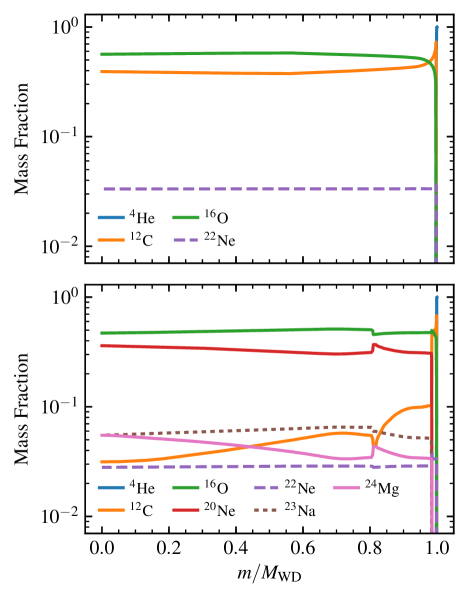
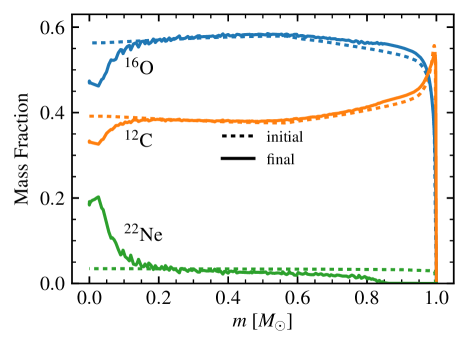
Figure 1 shows the initial composition profiles of our WD models. Our C/O WD model can be compared with composition profiles from other evolutionary calculations forming massive C/O WDs (e.g., Althaus et al., 2010a; Romero et al., 2013) and has similar and abundances in the core. Our O/Ne WD model can be compared with the composition profiles from the ultra-massive WDs of Camisassa et al. (2019). The mass fractions of , , , , and are all comparable, while our models have more given their higher metallicity. This demonstrates that our more approximate evolutionary approach provides composition profiles representative of state-of-the-art WD models.
3 Cooling Models
The model construction process yields WDs for which nuclear reactions have ceased. They have core temperatures of and effective temperatures of . We run WD cooling calculations based on these models using MESA r12115. Figure 2 shows cooling tracks for massive and ultra-massive C/O WD models on the Gaia CMD in the region of Q branch. The colors for these tracks on the Gaia CMD are interpolated based on and from the MESA tracks using the Montreal synthetic color tables for DB WDs (Holberg & Bergeron, 2006; Bergeron et al., 2011; Blouin et al., 2018).111http://www.astro.umontreal.ca/~bergeron/CoolingModels/ The coverage of these tables places an upper limit on the accessible mass range for Gaia colors around 1.2 . We can run MESA models more massive than this without difficulty if no colors are needed, but this mass range will be sufficient for our analysis in this work.
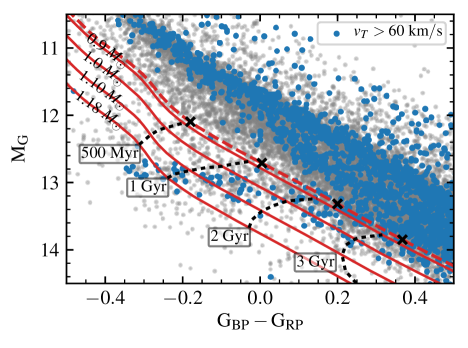
The WD data and kinematics in Figure 2 are based on Gaia DR2 (Gaia Collaboration et al., 2018a, b) with quality cuts of Cheng et al. (2019) and limited to a distance of 150 pc. Cheng et al. (2019) argue that the transverse velocity () data from Gaia provide an independent dynamical indicator of the WD ages, and that there is evidence of a kinematically old population (represented here by ) that must experience a cooling delay of several Gyr in the region of the Q branch. This is clearly inconsistent with the much faster cooling rates exhibited by the tracks in Figure 2, and this motivates deeper exploration of the physical processes that may modify cooling rates in this regime.
Our models have pure He atmospheres, so we employ a set of atmospheric boundary conditions for DB WDs based on the Koester (2010) WD atmosphere code (O. Toloza, 2019, private communication). These tables are important when WDs cool to and the conditions for the cool, dense He at the photosphere run off the MESA opacity tables as He becomes neutral. These boundary conditions tabulate pressure and temperature at optical depth where MESA can attach an interior profile using its gray opacity tables, similar to what is described for DA WDs in Paxton et al. (2013) based on the H atmosphere models of Rohrmann et al. (2012). The tabulated atmospheres for DB WDs are publicly available as a standard atmosphere option in MESA r12115.
Crystallization in WD interiors releases latent heat that slows WD cooling by up to 1 Gyr (van Horn, 1968; Lamb & van Horn, 1975; Chabrier et al., 2000; Fontaine et al., 2001), and Tremblay et al. (2019) demonstrated that crystallization in their C/O WD models coincides with the Q branch region on the CMD. Pile-up during crystallization can explain some of the overdensity of objects that forms the Q branch, but Tremblay et al. (2019) show that this overdensity is even more strongly peaked than expected from latent heat release alone. The several Gyr cooling delay inferred by Cheng et al. (2019) for kinematically old objects (blue points in Figure 2) on the Q branch is a delay with respect to models that already include latent heat release upon crystallization.
The cooling models in Figure 2 include the latent heat released by crystallization, but neglect any heating due to sedimentation of heavy elements, corresponding to the case of WDs descended from low-metallicity progenitors. Figure 2 also includes a track for a 0.9 DB WD from the Montreal WD cooling models (Fontaine et al., 2001). This track appears slightly offset from the MESA model of the same mass because the Montreal models use a 50/50 C/O core composition by mass fraction, while the ashes of He burning in our MESA models leave behind a core composition that is closer to 60% oxygen by mass, resulting in slightly more compact C/O WD cores. The Montreal models do not include any heavy element sedimentation in the interior, and the cooling timescales for the Montreal model agree well with the MESA models that do not include sedimentation heating.
3.1 Crystallization
The onset of crystallization can be quantified using the average Coulomb coupling parameter of ions in the WD interior plasma:
| (1) |
where is the electron separation and is ion charge. The plasma is strongly coupled for , and a classical one-component plasma (OCP) experiences a phase transition from liquid to solid for (Potekhin & Chabrier, 2010). In a WD interior, increases as the WD cools, and crystallization begins in the center when passes a critical threshold . For a WD interior composed of a single species of ions (e.g. pure C or pure O), this critical value for crystallization matches the OCP value (), but for plasma mixtures the phase curve is more complex (Medin & Cumming, 2010; Horowitz et al., 2010; Blouin et al., 2020). For the mixtures dominated by two elements such as C/O or O/Ne characterizing WD interiors, the presence of trace impurities such as 22Ne does not appear to have a significant impact on the overall phase curve, which can be adequately described by calculations for two-component mixtures (Hughto et al., 2012). For mixtures such as C/O or O/Ne, we approximate the results of Medin & Cumming (2010) and Blouin et al. (2020) by adopting a crystallization temperature that is the critical temperature of a plasma composed purely of the lighter element of the mixture. That is, crystallization occurs for
| (2) |
This approximation agrees with Medin & Cumming (2010) to within about 5% for mixtures where the heavier element is not too abundant by number fraction: , which is valid for the C/O and O/Ne dominated interiors of the WD models in this work. Equation (2) gives for C/O mixtures and for O/Ne mixtures.
Our MESA models do not include phase separation of C/O upon crystallization, which may provide an additional delay of up to 1 Gyr coinciding with crystallization (Mochkovitch, 1983; Segretain & Chabrier, 1993; Segretain et al., 1994; Chabrier et al., 2000; Althaus et al., 2012). However, the magnitude of this delay is much smaller than the several Gyr delay on the Q branch required by the analysis of Cheng et al. (2019), and we do not expect phase separation to change the location of crystallization on the CMD significantly. For simplicity, we therefore ignore phase separation in our models for this work.
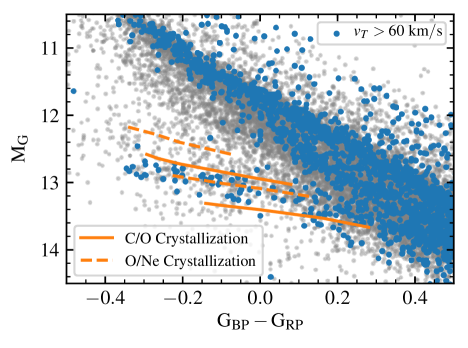
The MESA treatment of crystallization in WDs employs the Potekhin & Chabrier (2010) equation of state (EOS) and allows to be set as a user-defined parameter (Paxton et al., 2018), so our WD models set this parameter according to Equation (2). Due to the higher average charge of ions in O/Ne WDs, Equations (1) and (2) predict that they will crystallize at interior temperatures that are 50-60% higher than C/O WDs of the same density. Figure 3 shows that this difference translates into a significant offset on the CMD between O/Ne and C/O crystallization sequences for ultra-massive WDs. The contours in Figure 3 rely on a grid of MESA WD cooling models with . These models have helium atmospheres and include crystallization and latent heat release as part of the evolution. Hydrogen atmospheres change the colors somewhat for any given model, but the overall location of the crystallization contours does not change much for different atmosphere compositions.
The location of the Q branch WD overdensity on the CMD is inconsistent with O/Ne crystallization, but is consistent with C/O cores even for WDs with mass . Furthermore, the delays due to sedimentation heating that will be discussed in subsequent sections require that the WD interior remain liquid in order for diffusion to be active. After crystallization, no further sedimentation heating is possible, and the cooling cannot be slowed to form an overdensity of kinematically old WDs on the CMD. The kinematics and current CMD positions of WDs in Figure 3 require that most of the several Gyr cooling delay inferred by Cheng et al. (2019) occurs after reaching cooler temperatures than allowed by O/Ne crystallization if heavy element sedimentation is the cause. Only the C/O crystallization sequence is consistent with the location of the Q branch CMD overdensity.
These WDs on the Q branch with and C/O cores may be the products of C/O WD mergers that avoid core C ignition during the merger process. Using velocities of WDs above the Q branch, Cheng et al. (2019, 2020) estimate that about 30% of WDs in this mass range originate from WD mergers, in line with recent binary population synthesis predictions of Temmink et al. (2020). Kilic et al. (2020) reach a similar conclusion for massive WDs in their sample of spectroscopically confirmed DA WDs within 100 pc in the SDSS footprint. Indeed, Dunlap & Clemens (2015) have also argued that ultra-massive DQ WDs are likely WD merger products, and Coutu et al. (2019) and Cheng et al. (2019) recently found that about 45% of ultra-massive DQ WDs, a significant fraction of WDs on the Q branch, are kinematically old, thus indicating a clear relationship between WD mergers and the cooling delay.
If WD mergers are the only way to produce C/O WDs in this mass range, Figure 3 clearly suggests that a high merger fraction among this ultra-massive WD population is needed to produce the overdensity of WDs on the CMD aligned with C/O crystallization, which is then further accentuated by the cooling delay that some C/O WDs on the Q branch experience. There is no apparent CMD overdensity of WDs corresponding to O/Ne crystallization, which limits the fraction of WDs in this mass range produced by single-star evolution or any cooling delay they might experience associated with O/Ne crystallization. As we are primarily seeking to explain the cooling delay for the kinematically old WDs (blue points) that sit in the C/O crystallization regime in Figure 3, we shall proceed with C/O cooling models for much of the remainder of this work, even for masses well above 1.0 .
4 Single-Particle Sedimentation Heating
Diffusion and sedimentation of ions in WD interiors can rearrange the charge and mass distribution, releasing heat that slows the rate of WD cooling (Isern et al., 1991; Bildsten & Hall, 2001; Deloye & Bildsten, 2002; García-Berro et al., 2008). In this section, we argue that cooling delays comparable to the several Gyr inferred by Cheng et al. (2019) can be explained by sedimentation of 22Ne, but only if it occurs much faster than predicted by single-particle diffusion calculations. While the total energy available from this sedimentation is more than sufficient to provide the observed cooling delay, the required speed is large compared to expectations for 22Ne diffusive sedimentation based on single-particle diffusion coefficients. Therefore we will consider the possibility of 22Ne cluster formation that substantially enhances the sedimentation rate.
4.1 Sedimentation of Neutron-rich Isotopes
In degenerate WD interiors, the electric field balances the gravitational force acting on the ions of average charge-to-mass ratio (Bildsten & Hall, 2001; Chang et al., 2010):
| (3) |
The net gravitational sedimentation force on ions of species is therefore
| (4) |
The quantity is the number of extra neutrons of an isotope relative to ions of average charge-to-mass ratio in the background plasma. This term is large for neutron-rich isotopes, such as 22Ne found in C/O WD interiors, and both 22Ne and 23Na in O/Ne WD interiors.
For stars massive enough to burn hydrogen through the CNO cycle, this process converts the primordial CNO abundance into 14N, which then undergoes the -capture sequence during He-burning stages. Therefore most of the initial metallicity of these stars will become 22Ne distributed evenly through the interior profile of C/O or O/Ne WDs. In addition, more massive stars that ignite interior carbon burning on the AGB before shedding their envelopes to become O/Ne WDs also produce a significant amount of 23Na. This occurs as a result of the 12C + 12C reaction that branches to 23Na + p with probability. The overall neutron content of the mixture is enhanced through subsequent captures of the proton and electron capture or positron emission by those products. Importantly, these 12C burning products are metallicity-independent and so 23Na is generically present in the interior profile of O/Ne WDs at a mass fraction of (e.g., Siess, 2006, 2007).
The WD cooling delay caused by a total energy released at WD luminosity is . We will describe these energies in terms of the potential energy change associated with particles of species in the plasma traveling a distance under the influence of force : , where is the mass fraction of element and is its atomic mass number. Taking a luminosity of as representative of WDs on the Q branch, and as the typical local gravity in the interior of a 1 WD, we can express the upper limit for the total time delay as
| (5) | ||||
This represents the total available time delay from a given energy source as it requires all of the element in question to move through the entire potential of the star. The maximum time-delay predicted by Equation (5) for 22Ne sedimentation is , while 23Na could provide an additional delay up to 25 Gyr.
Another potential driver of sedimentation and heating in WD interiors is charge stratification in strongly coupled plasma, the ion chemical potentials pushing ions of higher charge toward the center even for ions of average charge-to-mass ratio (Chang et al., 2010; Beznogov & Yakovlev, 2013). In Appendix C we use Equation (5) to show that additional heating associated with this physics is negligible compared to sedimentation driven by the weight of neutron-rich isotopes, so we ignore any additional sedimentation heating from charge stratification for our models in this paper.
While Equation (5) quantifies the maximum delay available from sedimentation energy, accurate prediction of the total time delay achieved from diffusive sedimentation requires detailed models of WD cooling and interior diffusion (Bildsten & Hall, 2001; Deloye & Bildsten, 2002; García-Berro et al., 2008).
4.2 Single-Particle Diffusion Coefficients
The rate at which 22Ne sedimentation deposits heat in the interior depends directly on the diffusion velocity of 22Ne: (see Equation (12) and Appendix B). For trace 22Ne sinking in the WD interior, this velocity is
| (6) |
and so , where is the single-particle 22Ne diffusion coefficient. Uncertainties in the value of this coefficient at strong ion coupling () have been a source of uncertainty regarding the total rate of 22Ne heating in past studies (Bildsten & Hall, 2001; Deloye & Bildsten, 2002; García-Berro et al., 2008).
Recent calculations of in the strongly coupled regime of C/O WD interiors have reduced the current uncertainty to no more than a factor of two, and likely substantially smaller. Hughto et al. (2010) performed molecular dynamics (MD) simulations of C/O plasma mixtures with trace 22Ne characteristic of WD interiors over a plasma coupling range including strongly liquid conditions . They calculated based on these simulations by measuring the velocity autocorrelation functions for 22Ne particles and provided a fitting formula for . Figure 4 shows using the Hughto et al. (2010) fitting formula in the interior profile of a MESA C/O WD model for which crystallization has just begun near the center (). The figure also shows calculated for the same MESA WD profile using the methods of two previous studies of 22Ne sedimentation in WDs (Bildsten & Hall, 2001; García-Berro et al., 2008), demonstrating agreement within a factor of two throughout most of the WD interior profile.
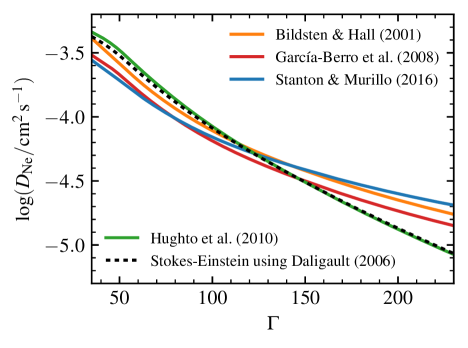
Figure 4 also shows based on the coefficients calculated by Stanton & Murillo (2016), which are the default diffusion coefficients in MESA. This formalism calculates diffusion coefficients based on binary collision integrals between each pair of species in the plasma. In the limit of a trace (Ne) sedimenting through a fixed background (C and O), the total diffusion coefficient can be expressed in terms of a sum over the binary resistance coefficients used in the Burgers (1969) diffusion formalism as
| (7) |
where the sum can be reduced to just the terms for C and O as these form the dominant background in which most collisions that mediate diffusion occur.
Finally, Bildsten & Hall (2001) noted that in the liquid regime, an estimate of the single-particle effective radius yields the Stokes-Einstein diffusion coefficient:
| (8) |
where is the viscosity of the liquid. Using MD simulations of an OCP Daligault (2006b) has shown that in the strongly liquid regime () Equation (8) surprisingly holds even for an individual ion when the radius is taken to be , where is the ion spacing. It is straightforward to generalize this result to estimate a Stokes-Einstein diffusion coefficient for ions in a plasma mixture. Daligault (2006b) gives the following fit based on MD for the viscosity of the OCP in the strongly liquid regime:
| (9) |
where is the mass of the ions in the OCP, and is the plasma frequency defined below. In order the extend this to an average over ions in a mixture, we use as defined for a mixture in Equation (1), along with and
| (10) |
For a mixture, the ion density is , and the electron density satisfies . For an ion species of charge different from the background , we rescale the effective radius for Stokes-Einstein drift to account for the different size of its charge-neutral sphere in a background of fixed electron density , with the result
| (11) |
For 22Ne in a C/O background , and the black dashed curve in Figure 4 shows the resulting diffusion coefficient when using this radius along with Equation (8).
Figure 4 demonstrates that although Hughto et al. (2010) make no mention of Stokes-Einstein diffusion in relation to their MD simulations for C/O/Ne mixtures, their fits for diffusion coefficients closely match the Stokes-Einstein prediction in the liquid regime when using a radius scaled to the OCP results of Daligault (2006b). The Stokes-Einstein scaling for diffusion coefficients holds throughout the liquid WD interior, and so we will continue to make use of the prediction of Equation (8) in later sections whenever a coefficient is needed for particles where the size can be calculated.
As a baseline for Ne diffusion in liquid WD interiors, we adopt the coefficient fitting formula of Hughto et al. (2010). In practice, we implement this by rescaling the Ne diffusion velocity in the MESA model by a factor of , with a smooth transition from the default diffusion based on Stanton & Murillo (2016) over the range , where this results in a modest enhancement to the diffusion speed (less than a factor of two).
4.3 Implementation of Sedimentation in MESA
The implementation of element diffusion in MESA is described in Section 3 of Paxton et al. (2018), including the addition of a sedimentation heating source term.222The implementation of sedimentation in MESA differs from the approach taken by García-Berro et al. (2008). In Appendix B, we clarify the difference between these treatments and show that the net energetics are equivalent. In Paxton et al. (2018), this term included only (which is typically dominant) but here we modify MESA to include heating associated with the diffusion of all isotopes included in the nuclear network. This allows inclusion of sedimentation which is of comparable importance in O/Ne WDs. The generalized heating term in MESA is implemented as a local entropy source
| (12) |
where is the mass fraction of ion species , and is the local diffusion velocity found by the diffusion solver along with the electric field . Refer to Appendix B.2.2 for the formal justification for this form of the heating term, which is a slightly simplified version of Equation (B14). For most C/O WDs, Equation (12) is dominated by the contribution and reduces to the form found in Equation (16) of Paxton et al. (2018). A more complete physical description of the heating associated with chemical transport in multicomponent plasmas is given in Appendices A and B.
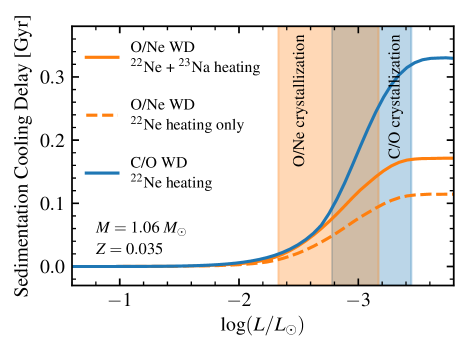
Figure 5 shows cooling delays due to this single-particle sedimentation heating for 1.06 MESA WD models (both O/Ne and C/O). With the diffusion velocities calculated for single particles, the neutron-rich isotopes sediment toward the center very slowly, releasing only a small fraction of the potential heating available according to Equation (5) before crystallization sets in and halts sedimentation. Orange curves in Figure 5 show two cases for the same O/Ne WD model: one for which we include all sedimentation heating according to Equation (12) (most importantly 22Ne and 23Na), and one for which we only include the 22Ne sedimentation heating. While the inclusion of 23Na heating does enhance the overall cooling delay for the O/Ne model, it still provides a much shorter delay than the C/O model of the same mass experiences from 22Ne alone (blue curve) due to faster diffusion of heavy elements in a C/O background than an O/Ne background. For the C/O case, crystallization (indicated by the shaded regions) also occurs later, prolonging the sedimentation period and further enhancing the cooling delay. The C/O WD model uses the 22Ne diffusion coefficients based on Hughto et al. (2010), while the O/Ne model employs the default MESA diffusion coefficients of Stanton & Murillo (2016) because we have no MD results for this case. Even though Figure 4 indicates that the Stanton & Murillo (2016) coefficients are likely too high in the strongly liquid regime, these O/Ne models still have significantly shorter cooling delays than the C/O model. It would also be possible to compute the Stokes-Einstein diffusion coefficients of Equations (8)–(11) for the O/Ne case, but this would only result in slower diffusion and a smaller cooling delay.
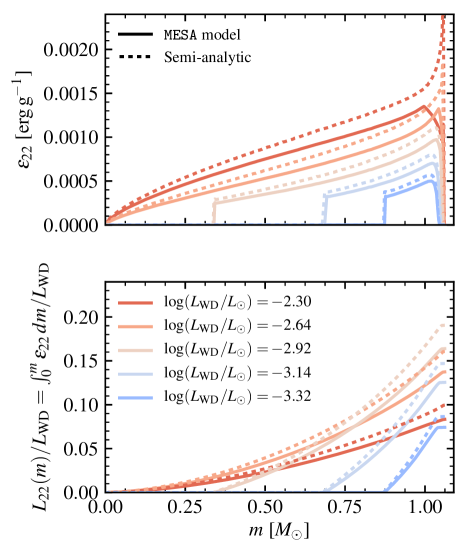
None of these cases using single-particle diffusion coefficients experience diffusion that is fast enough to provide heating adequate to create the several Gyr cooling delay required by Cheng et al. (2019). Figure 6 shows interior heating profiles from single-particle 22Ne sedimentation in the interior of our 1.06 C/O WD model. In order to verify that our heating term in MESA matches expectations, we compare to a semi-analytic estimate that relies only on the basic thermodynamic structure of the MESA model (, , ), approximating Equation (12) as
| (13) |
with given by Equation (6) and the diffusion coefficient given by the fit of Hughto et al. (2010). The total integrated 22Ne sedimentation luminosity never exceeds 20% of the total WD luminosity, and so this model with single-particle sedimentation speeds cannot significantly slow the WD cooling to achieve a multi-Gyr delay.
5 Clustering
While the energy available from 22Ne sedimentation is clearly adequate to provide the necessary cooling delay observed for Q branch WDs, this sedimentation must occur significantly faster than predicted by single-particle diffusion coefficient calculations. Motivated by this as well as the fact that the cooling delay clearly coincides with approaching interior crystallization, we hypothesize that clusters of 22Ne form in the strongly liquid regime near crystallization. In this regime, neighboring particles become associated with each other for many plasma oscillation timescales (Donkó et al., 2002), and heavy elements may therefore form clusters that behave as larger particles even as the background remains liquid, enhancing the rate of diffusion (Medin & Cumming, 2011). These clusters will, as we show, sink faster.
The pressure gradient responsible for maintaining hydrostatic equilibrium in the degenerate WD interior depends primarily on the electron density , so we demand that remain constant for local variations in ion composition. In this case, a cluster of particles composed purely of species will have a Coulomb coupling parameter of
| (14) |
For Ne in a C/O background, this gives . Hence, a group of Ne particles is much more strongly coupled than the surrounding ions, and may begin to form solid clusters when the background C/O reaches strongly liquid conditions. Even if only a fixed cluster for a finite time, a solid cluster will diffuse and sediment through the still liquid background as a heavier single particle. For specific conditions, we expect clusters to have a distribution of sizes. We use to represent the number of Ne atoms in an average-size cluster. Cluster nucleation has been studied for a liquid OCP near crystallization (Daligault, 2006a; Cooper & Bildsten, 2008), but it is not immediately clear how to extend this work to mixtures of different particle charges, so we leave as a free parameter for our exploratory modeling in this work. Maintaining the same electron density as the surrounding plasma, the radius for a cluster containing particles is
| (15) |
The total downward sedimentation force on a cluster of 22Ne particles is , so Stokes-Einstein drift in the liquid regime predicts that the velocity of cluster sedimentation is
| (16) |
The diffusion coefficient can be obtained from Equation (8) using the radius of Equation (15). Since we have shown that individual ions diffuse as spheres of radius given by Equation (11) following Stokes-Einstein drift, we express the cluster diffusion velocity in terms of a simple rescaling of the individual particle velocities to larger, heavier clusters diffusing in a background plasma of the same viscosity. By comparison with Equation (6), we can write the diffusion velocity of a cluster of Ne particles in terms of the diffusion velocity for individual Ne ions as
| (17) |
Note that this expression assumes that the diffusion velocity is dominated by drift due to external forces (gravity and the electric field) and ignores “ordinary diffusion” due to composition gradients. This is justified in strongly degenerate WD interiors because the scale height relevant for ion composition gradients is much smaller than the pressure scale height: . Therefore the composition gradients driving ordinary diffusion are only significant for sharp concentrations of elements (e.g. pile-up at the center) over a much smaller scale than gravitational sedimentation of heavy particles through the bulk of the interior, and thus ordinary diffusion can be neglected for the bulk heating that we are studying here.
According to Equation (17), clusters of particles correspond to a factor of 16 enhancement to the rate of diffusion (and corresponding sedimentation heating). We hypothesize that these Ne clusters will form and enhance diffusion only in strongly liquid conditions past some critical threshold of , which is a free parameter in our models. On the other hand, no enhancement to diffusion will occur for WDs that have not yet cooled enough to approach strongly liquid interiors and crystallization. The only two free parameters for this theory are and . The enhancement to diffusion given by Equation (17) is active for an interior region from the time it passes the threshold for cluster formation until it crystallizes, transitioning into the solid state and freezing out diffusion.
5.1 MESA Models Including Cluster Diffusion
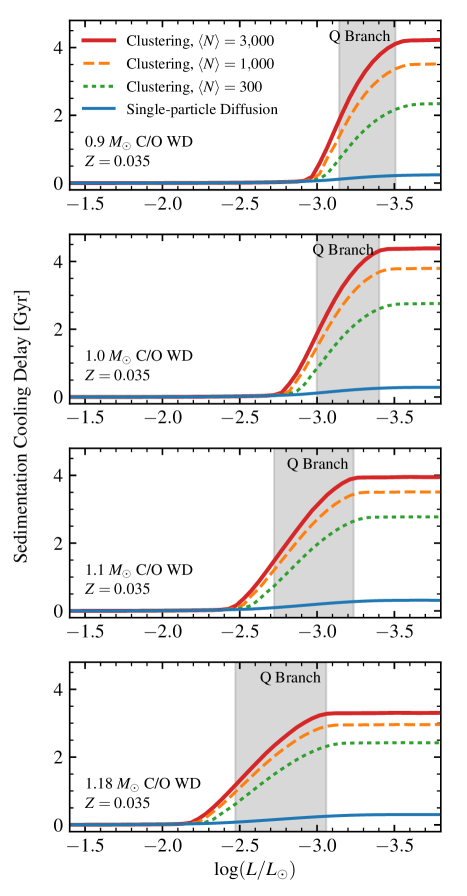
We now show that clusters of size are required for an enhancement to diffusion that is sufficient to provide a cooling delay on the order of several Gyr. Figure 7 shows cooling delays for MESA C/O WD models that implement the enhancement to diffusion according to Equation (17) with and the onset of clustering at (). These WD models are descended from metal-rich progenitors (), so their interiors are rich in 22Ne, and their cooling delays represent the longest delays that C/O WDs can achieve from sedimentation. Figure 8 shows how the 22Ne profile is rearranged in the interior over the course of cluster sedimentation. Models with tend to achieve similar cooling delays to the case, with 22Ne quickly sedimenting inward as soon as local conditions pass the threshold for cluster formation. The overall cooling delay is not particularly sensitive to beyond the value of needed to speed heating enough to achieve this several Gyr delay. It is possible that once conditions pass the threshold for cluster formation, 22Ne simply “rains” toward the center in clusters that continually grow as they encounter other Ne particles while sinking.
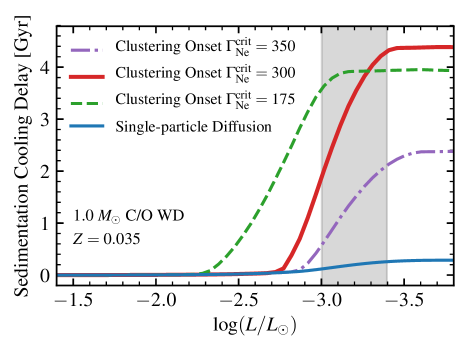
On the other hand, the delays in these models are quite sensitive to the value of where the onset of clustering occurs. Figure 9 shows a comparison of cooling delays for a WD model in which only this parameter is varied. For models in which clustering occurs earlier than , the cooling delay mostly accumulates prior to the point where the WD has cooled enough to reach the Q branch, and the overall magnitude of the delay is smaller because the sedimentation heating is released while the WD radiates it away at a higher luminosity. We therefore rule out the onset of significant clustering for as inconsistent with the observed CMD location and overall magnitude of the cooling delay inferred by Cheng et al. (2019). For models where is much larger than 300, the extent of the range where clustering can operate is limited before crystallization halts diffusion at , so we find that the total delay is maximized around in our models. We note however that our WD cooling models do not include any fluid instabilities that might be triggered in the interior by the rearranged 22Ne profile during intermediate stages of sedimentation. When enhanced 22Ne sedimentation begins near the center, it may leave behind a region depleted of 22Ne that sits beneath 22Ne-rich material. The resulting molecular weight gradient could drive dynamical mixing (e.g., Mochkovitch 1983; Brooks et al. 2017) that further enhances the net transport of 22Ne toward the center. It is currently difficult to account for heating associated with this dynamical mixing in MESA WD models, so we leave exploration of these details for future work. This may lead to even longer delays than our models currently exhibit, particularly for where it would extend the region of the star where enhanced heating can operate to encompass a much larger portion of the WD core.
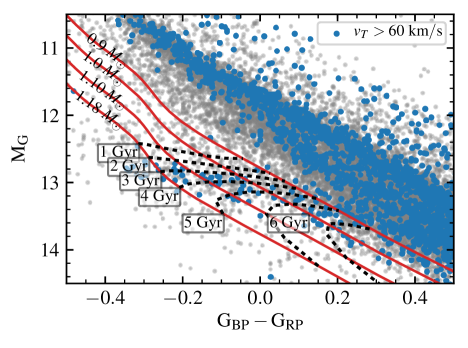
Figure 10 shows cooling tracks and contours of constant cooling age on the Gaia CMD for C/O WD models that include sedimentation heating with diffusion enhanced according to Equation (17) with and the onset of clustering at . The slowdown in the cooling rate is evident in the higher density of these contours in the region of the Q branch. For the Q branch to host enough fast-moving WDs (), Cheng et al. (2019) calculated that the delayed population should experience an 8 Gyr delay even after accounting for latent heat and merger delays. This value may be reduced to 6 Gyr for a younger thick disk age (e.g., Mackereth et al. 2019) or a higher age–velocity-dispersion relation, or if a quickly decreasing star-formation history is adopted. Our MESA models exhibit a 4 Gyr delay for metallicity progenitors without considering phase separation. Thus our models provide most of the cooling delay needed to explain velocity observations, though a small tension between these models and observation still exists. Cheng et al. (2019) used O/Ne models for inferences of the cooling delay when on the Q branch, so the C/O core compositions for our ultra-massive models would imply an additional delay of 1–2 Gyr due to later crystallization and phase separation. DA and DQ WDs may also exhibit small differences from our DB models in sedimentation cooling delays due to minor variations in the - relation. The remaining 2–4 Gyr of cooling delay is likely explained by some combination of these smaller effects or other dynamical mixing that we have not considered in our models here.
5.2 Predictions for Lower Mass WDs
With the free parameters of our clustering model tuned to match the observations of ultra-massive WDs on the Q branch, this model makes predictions for the cooling rates of less massive WDs. The WD models in this section are constructed using the MESA test case make_co_wd in version r10398. We vary initial mass and metallicity to produce WDs of the desired mass, and save the WD model when it cools to a luminosity of 10 . For initial , an initial mass of 3.25 produces a 0.6 WD, and 4.25 produces a 0.8 WD. For initial , these initial masses are 3.1 and 4.2 . The AGB winds in these models leave some hydrogen in the atmosphere, so when diffusion is turned on, the models quickly become DA WDs. Our WD cooling calculations for these models use MESA r12115 as in previous sections.
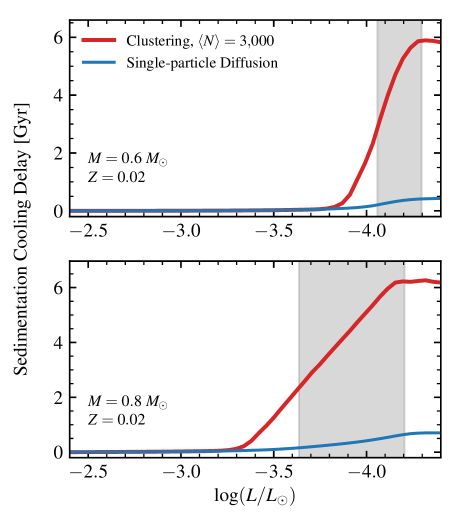
Figure 11 shows the cooling delays for 0.6 and 0.8 WDs descended from progenitor stars with metallicity . Even though this lower metallicity leaves less 22Ne in the WD interior compared to the models in the previous section, sedimentation of 22Ne powers a longer cooling delay (6 Gyr) in these lower mass models because crystallization occurs at a much lower luminosity.
Clustering may provide a natural explanation for the recent observations of Kilic et al. (2020), who note that the - distribution of DA WDs warmer than K shows an excess of WDs in the mass range 0.7–0.9 . The location of this pile-up is coincident with the expected location of crystallization. However, by comparing the data with cooling models that include latent heat release during crystallization, Kilic et al. (2020) show that the latent heat alone does not lead to cooling delays sufficient to explain the observed distribution.
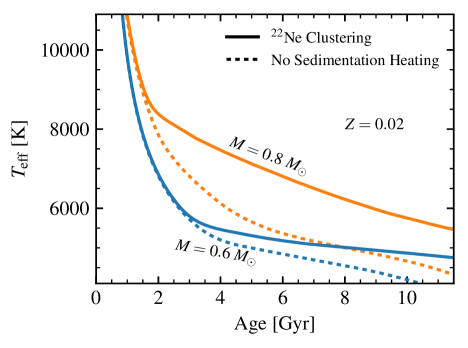
Figures 11 and 12 show that a 0.8 model will experience a significant extra delay due to 22Ne clustering coincident with crystallization and consistent with the temperatures of the excess WDs observed by Kilic et al. (2020). On the other hand, clustering will have no effect on the cooling inferences for 0.6 WDs near the peak of the WD mass distribution in the Kilic et al. (2020) sample because it is limited to . Clustering and crystallization do not begin for 0.6 WDs until they cool below .
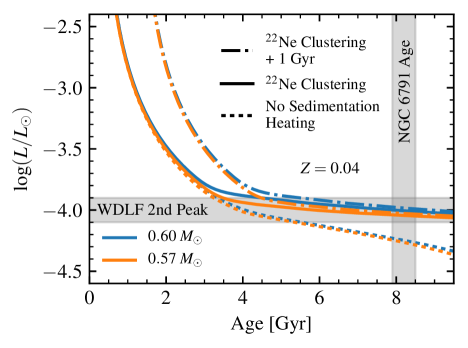
Due to its high metallicity, , the open cluster NGC 6791 was noted by Deloye & Bildsten (2002) as an important environment to probe the impact of 22Ne sedimentation on WD cooling. This proved to be the case when the measured WD luminosity function (WDLF) revealed a peak at that yielded the faintest WDs in the cluster (Bedin et al., 2008). These WDs should have an age matching the cluster age of Gyr (McKeever et al., 2019). However, standard WD cooling models that do not include 22Ne sedimentation indicate an age of only 6 Gyr (Bedin et al., 2008). García-Berro et al. (2010) and Althaus et al. (2010c) showed that including C/O phase separation along with (single-particle) 22Ne sedimentation provides a WD cooling delay that is long enough to alleviate this discrepancy.
Figure 13 shows WD cooling models for 0.57 and 0.6 WDs with , representing the WD mass range likely to dominate the WDLF peak in NGC 6791. As previously noted by Bedin et al. (2008), models that do not include sedimentation become too faint after 6 Gyr. Our models that include 22Ne clustering experience significant cooling delays, but still reach the faint peak of the WDLF in the cluster age of 8 Gyr. In García-Berro et al. (2010), the addition of phase separation and single-particle 22Ne sedimentation shifted the brightness of the faint peak in the theoretical WDLF at 8 Gyr by mag to bring models into agreement with the observed WDLF. Comparing the two sets of curves in Figure 13 at 8 Gyr, our models that include 22Ne clustering have dex higher luminosity than those with no sedimentation heating. This would shift a theoretical WDLF by mag. Although our models do not include C/O phase separation during crystallization, including an additional delay of 1 Gyr due to phase separation would not significantly change the WDLF at the cluster age of 8 Gyr where the evolution is already very slow. We show this in Figure 13 by including dot-dashed curves with an artificial extra delay of 1 Gyr in addition to the 22Ne clustering. At the cluster age of 8 Gyr, the luminosities for these curves are just 5% higher, or 0.05 mag brighter. Thus, the total shift in the WDLF including both 22Ne clustering and C/O phase separation might be as large as mag, which would still agree with the mag shift calculated by García-Berro et al. (2010) to well within the photometric uncertainties ( mag). Therefore the addition of 22Ne clustering does not bring theoretical cooling models into tension with the observations of NGC 6791.
6 Conclusions
We summarize our main arguments as follows:
-
1.
A subset (5–10%) of massive and ultra-massive WDs (0.9–1.3 ) experience a cooling delay of several Gyr that is too long to be explained by crystallization, phase separation, chemical differentiation due to diffusion, or any plausible combination of these effects.
-
2.
The evolutionary phase where the cooling delay occurs coincides with the regime for a C/O phase transition from liquid to solid in the WD core.
-
3.
Heating due to sedimentation of 22Ne in C/O WD cores can provide enough luminosity for a several Gyr cooling delay prior to crystallization, but only if sedimentation can proceed much faster than predicted by the diffusion coefficients of individual 22Ne ions, which are theoretically well-constrained.
-
4.
We therefore propose that in the strongly liquid regime, 22Ne ions can form into solid clusters of particles that are heavier and sediment toward the center faster according to Stokes-Einstein drift, and our MESA models show that this modification creates a 4 Gyr cooling delay, explaining most of the cooling delay for fast-moving WDs on the Q branch.
Our simple model for clustering leaves the size of clusters () as a free parameter, as well as the value of Coulomb coupling for Ne at which clusters begin to form (). While we have not explored a first-principles physical approach for constraining how these clusters form, it may be that MD modeling of strongly coupled plasmas (e.g., Daligault 2006b; Horowitz et al. 2010; Hughto et al. 2010) can provide more insight into the physics of this cluster formation. It may also be the case that solid clusters form with some other composition than pure Ne. In that case, it would still be straightforward to reinterpret our sedimentation numbers for solid clusters composed of a Ne-rich C/O/Ne mixture that sinks relative to the liquid C/O background.
The subset of ultra-massive WDs that experience this extra cooling delay of several Gyr due to 22Ne sedimentation likely descends from an old, metal-rich population. In particular, the 22Ne in WD cores forms from the primordial CNO abundance of their progenitor stars, so these WDs are likely associated with the high sequence of old stars in the galactic disk population (Nidever et al., 2014; Hayden et al., 2015; Mackereth et al., 2019; Sharma et al., 2020). Early in galactic history, core-collapse supernovae produced the CNO necessary to seed the eventual production of 22Ne in these old WD cores. The WDs that experience the longest delays in our model would be those descended from the highest -abundance progenitors, and the distribution of cooling delays for this sample of WDs should be correlated with the -abundance distribution of other old stars within a few hundred pc of the sun (Castro et al., 1997; Pompéia et al., 2003; Khoperskov et al., 2020). Our ultra-massive C/O WD models may represent C/O WD merger products, so the final 22Ne abundance may also be modestly enhanced by burning during the merger process (see Section 2). As most WDs would have lower 22Ne abundances, they would experience much less sedimentation heating, which naturally explains why Cheng et al. (2019) inferred that only a small fraction of WDs experience a substantial extra cooling delay. We therefore conclude that the sedimentation of clustered 22Ne can explain most of the cooling delay on the Q branch, though some tension between theoretical prediction and observations may still exist (Section 5.1).
Our model also predicts that lower-mass (0.6–0.9 ) WDs experience a substantial cooling delay (6 Gyr for ) very late in their evolution. This likely explains the excess of 0.7–0.9 WDs recently observed by Kilic et al. (2020). This cooling delay would also have a large impact on the faint edge of the WD luminosity function in old, metal-rich star clusters. While high metallicity is rare for old globular clusters (e.g., Hansen et al. 2002, 2007; Campos et al. 2016), we have shown that for the old, metal-rich open cluster NGC 6791, our model produces WD cooling consistent with the main sequence turnoff age and WD luminosity function.
Although we have shown that WDs with O/Ne cores are unlikely to account for the cooling anomaly on the Q branch, our clustering model does predict that O/Ne WDs should also experience a significant cooling delay coincident with interior crystallization. The 23Na present in all O/Ne WD cores should also be susceptible to the clustering process that we have described for 22Ne. The charge contrast between 23Na () and the O/Ne background is somewhat smaller than that of 22Ne to C/O, so clustering would begin later and possibly only lead to a delay of a few Gyr, but this would still slow the cooling rate of O/Ne WDs by a factor of a few. This only makes it more striking that Figure 2 shows no feature corresponding to O/Ne WD crystallization on the CMD, and may imply a stricter constraint on the fraction of O/Ne WDs among ultra-massive WDs.
When neither 22Ne and 23Na are present in a WD interior, clustering of other elements may play an important role in WD cooling. For 56Fe present at mass fraction , Equation (5) predicts possible Gyr delays if clustering can enhance sedimentation sufficiently. Even in He WD cores that never crystallize, the large charge contrast of heavier trace elements may put them in the clustering regime (Equation 14), and the chemical potential for clusters of elements such as 14N could drive significant stratification and heating even without the weight of extra neutrons (Appendix C).
Appendix A Derivation of Fundamental Equations
A star is a system with properties that are functions of both space and time. Equilibrium thermodynamic systems have homogeneous properties (i.e., the system has a temperature) that do not vary with time. Time evolution is typically introduced by thinking about moving through a sequence of equilibrium states. The consideration of spatial variation proceeds by dividing the star into infinitesimal systems (but not so infinitesimal that thermodynamics breaks down) and taking the continuum limit. These infinitesimal sub-systems are open systems that exchange both heat and matter with their surroundings.
A.1 The “First Law” and Conservation of Energy
The “first law” is a statement that encodes energy conservation. Chapter II of de Groot & Mazur (1969) demonstrates how to formulate the first law in a multi-species system where each species is allowed to have a flow relative to the mean. We follow their discussion, but specialize to our problem when it allows simplification. In order to allow easy comparison with Paxton et al. (2018), we use the indices and to refer to particle species.
The hydrodynamic equations come directly from moments of the collisional Boltzmann equation (see e.g., Chapter 7 of Hirschfelder et al., 1964). When considering the evolution of quantities that are conserved in collisions (mass, momentum, and energy), sums of the collision integrals over all species vanish, yielding simpler equations for their rate of change.
We assume a fully-ionized plasma of species (electrons plus species of ions). With no reactions, continuity of each species yields
| (A1) |
The total mass density is
| (A2) |
and we define the velocity as the barycentric velocity,
| (A3) |
We define relative velocities for each species as . Summing the individual continuity equations (Equation A1) and using the definitions above gives mass conservation
| (A4) |
The inviscid momentum equation is
| (A5) |
where is the (scalar) pressure and represents the outer product. We assume that the relative velocities, , are much less than the thermal velocities, such that the full pressure tensor is dominated by its scalar component (the equilibrium pressure). The force density on species is
| (A6) |
where is the number density, is the mass, is the gravitational acceleration, is the charge, and is the electric field. Local charge neutrality () implies that the total force is simply the gravitational force,
| (A7) |
When in hydrostatic equilibrium, if the ion contribution to the total pressure is negligible (meaning ), the electron equilibrium requires an approximate balance between the pressure gradient and the electric force. This implies the presence of an electric field
| (A8) |
The equation for the specific (per unit mass) internal energy, , is
| (A9) |
where reflects the rate of processes that can directly remove energy from the system (i.e., optically-thin cooling) and where is the “heat flow” vector (e.g., thermal conduction or radiative transfer). Denoting the Lagrangian time derivative as , the flow of energy into a Lagrangian parcel is
| (A10) |
which when combined with the Lagrangian derivative of specific internal energy,
| (A11) |
yields
| (A12) |
When , Equation (A12) reduces to the familiar thermodynamic relation
| (A13) |
which is also Equation (60) in Paxton et al. (2018).
The do not lead to a net transport of mass or of charge . With the force density of Equation (A6), these constraints mean that the final term of Equation (A12) vanishes even for non-zero . Therefore, the “first law” expression in Paxton et al. (2018) need not be modified, even in this non-equilibrium circumstance.
A.2 Entropy and the Second Law
The entropy is a quantity that can be defined in terms of the macroscopic characteristics of the system. We make the assumption that, even though the star itself is not in equilibrium, there are small mass elements in a local equilibrium where the local entropy is well characterized. It is often useful to characterize heating by a physical process like mixing in terms of entropy generation and evolution (e.g., Beznogov & Yakovlev 2013), so here we derive the relationship between entropy and the thermodynamic relations of the previous section. If we write the internal energy, , of such an element in terms of the independent thermodynamic basis variables , then expanding yields the thermodynamic identity
| (A14) |
where is the entropy and is the temperature. The sum runs over all species present and is the chemical potential for species . Writing these differentials as time derivatives and casting in specific (per unit mass) form gives
| (A15) |
From continuity (both individual species and total),
| (A16) |
so that
| (A17) |
Combining with Equation (A12) and manipulating the term with the divergence, we have
| (A18) |
We can rearrange terms to write
| (A19) |
Note that in the notation of Beznogov & Yakovlev (2013) this last term in parentheses is . They say this term (their Equation 20) is the rate of specific entropy generation via collisions. We will see that is true in the case of constant (which they assume early on).
Note that this collisional entropy production in the final term of Equation (A19) need not always be associated with production of “heat”, as there is freedom in Equation (A19) for a suitably defined entropy of mixing with . In terms of implementation, this implies that the basis for defining the specific entropy in an equation of state (EOS) must be consistent with the composition degrees of freedom where mixing may produce entropy if Equation (A19) is to be used. For example, an EOS that defines the compositional dependence of entropy in terms of only the average particle mass would not be adequate for using Equation (A19) to study entropy generation by sedimentation of multiple distinct species of particles with the same mass.
By defining the entropy flow as
| (A20) |
we can rewrite Equation (A19) as an entropy balance equation
| (A21) |
where the entropy generation rate is
| (A22) |
Setting , so that one can meaningfully define a closed system, then the constraint that each term in must be non-negative leads to the satisfaction of the second law of thermodynamics. In Chapter III, de Groot & Mazur (1969) discuss these points further and show several equivalent ways of writing this expression using different definitions of the heat flow.
Appendix B Implementation of Sedimentation Heating
We now revisit the energetics of gravitational settling and demonstrate the relationship between the the Paxton et al. (2018) and García-Berro et al. (2008) approaches. This clarifies the approximation being made in MESA.
B.1 Description of Approaches
When formulating the stellar structure equations, energy conservation is included by considering the energy flow in and out of a fluid parcel (e.g., Kippenhahn et al., 2012, Chapter 4). In this Lagrangian picture, to understand how the energy of a fluid parcel is changing, we account for the specific (per unit mass) rate of energy injection into the parcel, , and the specific rate of energy flow through the boundaries, . The specific heating rate () for the parcel then satisfies
| (B1) |
Using Equation (A13), this is traditionally rewritten in terms of a source function , such that
| (B2) |
with
| (B3) |
B.1.1 Approach in García-Berro et al. (2008)
García-Berro et al. (2008) follow this approach, with (only optically-thin neutrino cooling, no nuclear reactions). They restrict themselves to a composition with two chemical elements, so that .333García-Berro et al. (2008) label their species with subscripts 1 and 2. We label their species “1” with “22” to indicate it is ; we label quantities associated with their species “2” with “b” (to represent the background). When is evaluated in the basis, they derive their Equation (5), which in our notation is
| (B4) |
where is the specific heat at constant volume. We identify the effective García-Berro et al. (2008) heating term as
| (B5) |
B.1.2 Approach in Paxton et al. (2018)
When evaluating the total derivative of the internal energy in Equation (B3), a common approximation is to neglect the composition derivatives. This is the default approach adopted in MESA, justified by the fact that these terms are negligible compared to the energy released by nuclear reactions (e.g., Kippenhahn et al., 1965). When are the structure variables, the usual form of in MESA is given in Equation (12) of Paxton et al. (2011) or Equation (65) of Paxton et al. (2018):
| (B6) |
The thermodynamic derivatives have their usual definitions: , , , and . Equation (B6) is identical (after using thermodynamic and mathematical identities) to the non- terms in Equation (B4).
Evaluating the neglected composition derivative terms can be difficult in a code like MESA when accounting for a mixture of more than a few elements. The model evolves the set of mass fractions specified by the choice of nuclear network. However, this structural basis usually does not match the basis of the EOS. For the -basis EOSes relevant for WDs in MESA, the composition basis for HELM is while the composition basis for PC is all isotopes with mass fractions above some threshold (default: ). This makes it challenging (or impossible) to evaluate all the relevant partial derivatives with respect to composition within MESA.
Therefore, instead of attempting to fully evaluate , the energetic effects of sedimentation are incorporated into MESA via the inclusion of an additional heating term specific to this isotope. This follows the approach taken by Bildsten & Hall (2001) and Deloye & Bildsten (2002) who evaluate the net power generated by sedimentation in the trace limit. The specific rate at which energy is deposited is then
| (B7) |
The diffusion velocity () and electric field () are calculated in the diffusion routine and then used to evaluate the above heating term. This expression assumes the only isotope settling is and assumes it is a trace (). By assuming only two isotopes, García-Berro et al. (2008) also makes the assumption that only sediments, though their expression does not explicitly make the trace assumption.444Since mass fractions are typically of order the initial metallicity, the trace limit is initially a good approximation. It does become worse as centrally concentrates (see e.g., Figure 8 where the mass fraction reaches ).
B.2 Unification of the two approaches
The heating terms in Equation (B5) and Equation (B7) appear different. In particular, the MESA approach indicates that heating occurs anywhere that the has a finite abundance and a non-zero diffusion velocity, while the García-Berro et al. (2008) approach only indicates heating only where the local abundance is changing. White dwarf cooling calculations with MESA were compared with the results from García-Berro et al. (2008) and found to agree (see Section 3.5, Figure 18 in Paxton et al., 2018). But if one inspects the local profiles of the heating in MESA and in Figure 4 of García-Berro et al. (2008), the two approaches appear different.
B.2.1 Approach of García-Berro et al. (2008)
Let us evaluate the total heating rate of sedimentation over the whole star,
| (B8) |
Since there are no nuclear reactions, composition changes are entirely due to gravitational settling, so that
| (B9) |
As García-Berro et al. (2008) indicate, in a cool WD the electronic contributions to the internal energy dominate. In the fully degenerate limit,
| (B10) |
where is the atomic mass unit, is the electron chemical potential, and we have assumed the background species has = 1/2. Therefore, we have
| (B11) |
The manipulation of the divergence is analogous to that in Equation (A18). The first integral on the third line vanishes since the term in parentheses vanishes at the center and the surface. Diffusion changes the local entropy both by transporting entropy and locally generating entropy. Here we see that a term similar to local entropy generation is closely related to the total integrated change in internal energy, while the integrated transport term has no net effect.
The thermal conduction timescale across the WD core is much less than the evolutionary timescale. This has the consequence that the transport term can be neglected. To get the overall cooling right, it does not matter exactly how the heating is deposited, so long as the correct total amount of energy is deposited. Thus, an equivalent expression for is given by the part of the integrand that does not vanish,
| (B12) |
B.2.2 Approach in Paxton et al. (2018)
Give the final term in Equation (A19) the name
| (B13) |
As shown in Equation (A22), under the assumption of constant , this is proportional to the local entropy generation rate due to diffusion. Using the definition of we write
| (B14) |
To satisfy charge neutrality, the electron flux must be similar to the largest ion fluxes . In the strongly degenerate limit, the electrons are responsible for maintaining hydrostatic equilibrium, so that the term in parentheses in Equation (B14) must be very close to zero for electrons. Hence the sum in Equation (B14) can be restricted to run only over the ion species, since the entropy generation for the electrons is negligible near equilibrium, while the deviations from equilibrium can be much larger for an ion such as where is negligible and the electric and gravitational forces do not cancel.
The electric field estimate of Equation (A8) is
| (B15) |
where and are the mean ion mass number and charge number, respectively. Dropping the ion chemical potentials and using this estimate of the electric field in Equation (B14) gives
| (B16) |
For ions, the mass fraction is defined as and , so
| (B17) |
This term only appears if the charge-to-mass ratio of the species being transported is different than the background. In the limit in which all other isotopes have and (trace limit), the only non-zero term is that for . That is,
| (B18) |
which is equivalent to Equation (16) in Paxton et al. (2018).
B.3 Demonstration of Equivalence
Alternatively, taking the sum over all species (including electrons) in Equation (B14), the gravitational and electric force terms vanish due to the lack of net flow of mass and charge. The term with the electron chemical potential gradient remains, implying
| (B19) |
The constraints of no net transport of mass or charge also imply that the electron velocity is related to the ion velocity. In the context of two species, the mass constraint is
| (B20) |
and the charge constraint is
| (B21) |
Combining these, and assuming a background with , we have
| (B22) |
This demonstrates that Equation (B12) and Equation (B18) are equivalent.
Appendix C Charge Stratification
In this section, we tentatively rule out any physical process that relies on stratification of elements by charge as a source of 10 Gyr cooling delays. In strongly-coupled Coulomb mixtures, ions of higher-than-average charge also sediment, even with equal charge-to-mass ratio (Chang et al., 2010; Beznogov & Yakovlev, 2013). The forces associated with this tendency toward charge stratification can modify diffusion velocities of elements responsible for sedimentation heating, and movement of ions through the chemical potential gradient driving this charge separation yields an additional heating term (Equation B14). However, we show here that this term is small compared to single-particle 22Ne sedimentation heating in WD interiors.
Following Beznogov & Yakovlev (2013), for species of charge , the Coulomb interactions with other ions give rise to a chemical potential of the form
| (C1) |
and therefore the average Coulomb chemical potential over all ions in the plasma is
| (C2) |
The charge separation force for element relative to the background of all ions is then (cf. equation (14) of Beznogov & Yakovlev 2013)
| (C3) |
where we have assumed that is negligible for the final step. Figure 14 shows this estimated force relative to the local value of for each species of ion throughout the interior profile of a MESA WD model with an O/Ne dominated core. While these forces may be enough to drive small amounts of diffusion, they are much smaller than the gravitational sedimentation forces () that act on neutron-rich isotopes such as 22Ne and 23Na. Diffusion velocities are linearly proportional to the forces driving them , and heating associated with these velocities scales as . Diffusion related to charge separation will therefore lead to negligible heating compared to gravitational sedimentation, so we are justified in ignoring this term in the models presented in this work.
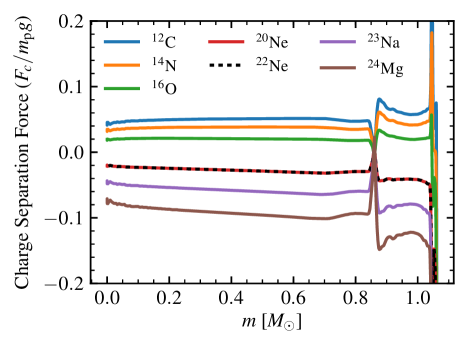
Figure 14 also allows an estimate of the total amount of energy that could be released associated with any other mixing that might lead to rearrangement of charges in this chemical potential (e.g. phase separation induced by crystallization) using Equation (5). For the most abundant elements (O and Ne in this MESA model), complete charge stratification would lead to a delay of approximately 5 Gyr. This is somewhat smaller than the energy and cooling delay available from 22Ne sedimentation. The ratio of the total energies from both of these sources is approximately . So the total time-delay available from charge separation is comparable to that available from complete 22Ne when metallicity is , but WDs descended from metal-rich stars have a potential sedimentation energy reservoir several times larger.
We also note that this energy estimate predicts that cooling delays comparable to those observed for the Q branch could only result from phase separation if chemical separation of the dominant elements (C/O or O/Ne) is nearly complete, releasing all of the energy associated with these chemical potential differences. In fact, phase separation calculations do not predict complete separation, and hence cooling delays associated with phase separation are typically on the order of 1 Gyr (Segretain et al., 1994; Chabrier et al., 2000; Althaus et al., 2012), insufficient to explain the full extent of the cooling anomaly on the Q branch.
References
- Althaus et al. (2010a) Althaus, L. G., Córsico, A. H., Bischoff-Kim, A., et al. 2010a, ApJ, 717, 897
- Althaus et al. (2010b) Althaus, L. G., Córsico, A. H., Isern, J., & García-Berro, E. 2010b, A&A Rev., 18, 471
- Althaus et al. (2012) Althaus, L. G., García-Berro, E., Isern, J., Córsico, A. H., & Miller Bertolami, M. M. 2012, A&A, 537, A33
- Althaus et al. (2010c) Althaus, L. G., García-Berro, E., Renedo, I., et al. 2010c, ApJ, 719, 612
- Bedin et al. (2008) Bedin, L. R., King, I. R., Anderson, J., et al. 2008, ApJ, 678, 1279
- Bergeron et al. (2019) Bergeron, P., Dufour, P., Fontaine, G., et al. 2019, ApJ, 876, 67
- Bergeron et al. (2011) Bergeron, P., Wesemael, F., Dufour, P., et al. 2011, ApJ, 737, 28
- Beznogov & Yakovlev (2013) Beznogov, M. V., & Yakovlev, D. G. 2013, Phys. Rev. Lett., 111, 161101
- Bildsten & Hall (2001) Bildsten, L., & Hall, D. M. 2001, ApJ, 549, L219
- Blouin et al. (2020) Blouin, S., Daligault, J., Saumon, D., Bédard, A., & Brassard, P. 2020, A&A, 640, L11
- Blouin et al. (2018) Blouin, S., Dufour, P., & Allard, N. F. 2018, ApJ, 863, 184
- Brooks et al. (2017) Brooks, J., Schwab, J., Bildsten, L., Quataert, E., & Paxton, B. 2017, ApJ, 834, L9
- Burgers (1969) Burgers, J. M. 1969, Flow Equations for Composite Gases (Academic Press, New York)
- Camisassa et al. (2019) Camisassa, M. E., Althaus, L. G., Córsico, A. H., et al. 2019, A&A, 625, A87
- Campos et al. (2016) Campos, F., Bergeron, P., Romero, A. D., et al. 2016, MNRAS, 456, 3729
- Castro et al. (1997) Castro, S., Rich, R. M., Grenon, M., Barbuy, B., & McCarthy, J. K. 1997, AJ, 114, 376
- Chabrier et al. (2000) Chabrier, G., Brassard, P., Fontaine, G., & Saumon, D. 2000, ApJ, 543, 216
- Chang et al. (2010) Chang, P., Bildsten, L., & Arras, P. 2010, ApJ, 723, 719
- Cheng et al. (2019) Cheng, S., Cummings, J. D., & Ménard, B. 2019, ApJ, 886, 100
- Cheng et al. (2020) Cheng, S., Cummings, J. D., Ménard, B., & Toonen, S. 2020, ApJ, 891, 160
- Clayton et al. (2007) Clayton, G. C., Geballe, T. R., Herwig, F., Fryer, C., & Asplund, M. 2007, ApJ, 662, 1220
- Cooper & Bildsten (2008) Cooper, R. L., & Bildsten, L. 2008, Phys. Rev. E, 77, 056405
- Coutu et al. (2019) Coutu, S., Dufour, P., Bergeron, P., et al. 2019, ApJ, 885, 74
- Daligault (2006a) Daligault, J. 2006a, Phys. Rev. E, 73, 056407
- Daligault (2006b) —. 2006b, Phys. Rev. Lett., 96, 065003
- de Groot & Mazur (1969) de Groot, S. R., & Mazur, P. 1969, Non-equilibrium thermodynamics
- Deloye & Bildsten (2002) Deloye, C. J., & Bildsten, L. 2002, ApJ, 580, 1077
- Donkó et al. (2002) Donkó, Z., Kalman, G. J., & Golden, K. I. 2002, Phys. Rev. Lett., 88, 225001
- Dunlap & Clemens (2015) Dunlap, B. H., & Clemens, J. C. 2015, in Astronomical Society of the Pacific Conference Series, Vol. 493, 19th European Workshop on White Dwarfs, ed. P. Dufour, P. Bergeron, & G. Fontaine, 547
- Fontaine et al. (2001) Fontaine, G., Brassard, P., & Bergeron, P. 2001, PASP, 113, 409
- Gaia Collaboration et al. (2016) Gaia Collaboration, Prusti, T., de Bruijne, J. H. J., et al. 2016, A&A, 595, A1
- Gaia Collaboration et al. (2018a) Gaia Collaboration, Babusiaux, C., van Leeuwen, F., et al. 2018a, A&A, 616, A10
- Gaia Collaboration et al. (2018b) Gaia Collaboration, Brown, A. G. A., Vallenari, A., et al. 2018b, A&A, 616, A1
- García-Berro et al. (2008) García-Berro, E., Althaus, L. G., Córsico, A. H., & Isern, J. 2008, ApJ, 677, 473
- García-Berro et al. (2010) García-Berro, E., Torres, S., Althaus, L. r. G., et al. 2010, Nature, 465, 194
- Gentile Fusillo et al. (2019) Gentile Fusillo, N. P., Tremblay, P.-E., Gänsicke, B. T., et al. 2019, MNRAS, 482, 4570
- Hansen et al. (2002) Hansen, B. M. S., Brewer, J., Fahlman, G. G., et al. 2002, ApJ, 574, L155
- Hansen et al. (2007) Hansen, B. M. S., Anderson, J., Brewer, J., et al. 2007, ApJ, 671, 380
- Hayden et al. (2015) Hayden, M. R., Bovy, J., Holtzman, J. A., et al. 2015, ApJ, 808, 132
- Hirschfelder et al. (1964) Hirschfelder, J. O., Curtiss, C. F., & Bird, R. B. 1964, Molecular theory of gases and liquids
- Holberg & Bergeron (2006) Holberg, J. B., & Bergeron, P. 2006, AJ, 132, 1221
- Horowitz et al. (2010) Horowitz, C. J., Schneider, A. S., & Berry, D. K. 2010, Phys. Rev. Lett., 104, 231101
- Hughto et al. (2012) Hughto, J., Horowitz, C. J., Schneider, A. S., et al. 2012, Phys. Rev. E, 86, 066413
- Hughto et al. (2010) Hughto, J., Schneider, A. S., Horowitz, C. J., & Berry, D. K. 2010, Phys. Rev. E, 82, 066401
- Hunter (2007) Hunter, J. D. 2007, Computing In Science & Engineering, 9, 90
- Isern et al. (1991) Isern, J., Hernanz, M., Mochkovitch, R., & Garcia-Berro, E. 1991, A&A, 241, L29
- Jeffery et al. (2011) Jeffery, C. S., Karakas, A. I., & Saio, H. 2011, MNRAS, 414, 3599
- Khoperskov et al. (2020) Khoperskov, S., Di Matteo, P., Haywood, M., Gómez, A., & Snaith, O. N. 2020, A&A, 638, A144
- Kilic et al. (2020) Kilic, M., Bergeron, P., Kosakowski, A., et al. 2020, ApJ, 898, 84
- Kippenhahn et al. (1965) Kippenhahn, R., Thomas, H. C., & Weigert, A. 1965, ZAp, 61, 241
- Kippenhahn et al. (2012) Kippenhahn, R., Weigert, A., & Weiss, A. 2012, Stellar Structure and Evolution
- Kluyver et al. (2016) Kluyver, T., Ragan-Kelley, B., Pérez, F., et al. 2016, in Positioning and Power in Academic Publishing: Players, Agents and Agendas: Proceedings of the 20th International Conference on Electronic Publishing, IOS Press, 87
- Koester (2010) Koester, D. 2010, Mem. Soc. Astron. Italiana, 81, 921
- Koester & Kepler (2019) Koester, D., & Kepler, S. O. 2019, A&A, 628, A102
- Lamb & van Horn (1975) Lamb, D. Q., & van Horn, H. M. 1975, ApJ, 200, 306
- Lauffer et al. (2018) Lauffer, G. R., Romero, A. D., & Kepler, S. O. 2018, MNRAS, 480, 1547
- Mackereth et al. (2019) Mackereth, J. T., Bovy, J., Leung, H. W., et al. 2019, MNRAS, 489, 176
- McCleery et al. (2020) McCleery, J., Tremblay, P.-E., Fusillo, N. P. G., et al. 2020, MNRAS, arXiv:2006.00874 [astro-ph.SR]
- McKeever et al. (2019) McKeever, J. M., Basu, S., & Corsaro, E. 2019, ApJ, 874, 180
- Medin & Cumming (2010) Medin, Z., & Cumming, A. 2010, Phys. Rev. E, 81, 036107
- Medin & Cumming (2011) —. 2011, ApJ, 730, 97
- Mestel (1952) Mestel, L. 1952, MNRAS, 112, 583
- Mochkovitch (1983) Mochkovitch, R. 1983, A&A, 122, 212
- Nidever et al. (2014) Nidever, D. L., Bovy, J., Bird, J. C., et al. 2014, ApJ, 796, 38
- Paxton et al. (2011) Paxton, B., Bildsten, L., Dotter, A., et al. 2011, ApJS, 192, 3
- Paxton et al. (2013) Paxton, B., Cantiello, M., Arras, P., et al. 2013, ApJS, 208, 4
- Paxton et al. (2015) Paxton, B., Marchant, P., Schwab, J., et al. 2015, ApJS, 220, 15
- Paxton et al. (2018) Paxton, B., Schwab, J., Bauer, E. B., et al. 2018, ApJS, 234, 34
- Paxton et al. (2019) Paxton, B., Smolec, R., Schwab, J., et al. 2019, ApJS, 243, 10
- Pérez & Granger (2007) Pérez, F., & Granger, B. E. 2007, Computing in Science & Engineering, 9, 21
- Pompéia et al. (2003) Pompéia, L., Barbuy, B., & Grenon, M. 2003, ApJ, 592, 1173
- Potekhin & Chabrier (2010) Potekhin, A. Y., & Chabrier, G. 2010, Contributions to Plasma Physics, 50, 82
- Rohrmann et al. (2012) Rohrmann, R. D., Althaus, L. G., García-Berro, E., Córsico, A. H., & Miller Bertolami, M. M. 2012, A&A, 546, A119
- Romero et al. (2013) Romero, A. D., Kepler, S. O., Córsico, A. H., Althaus, L. G., & Fraga, L. 2013, ApJ, 779, 58
- Segretain & Chabrier (1993) Segretain, L., & Chabrier, G. 1993, A&A, 271, L13
- Segretain et al. (1994) Segretain, L., Chabrier, G., Hernanz, M., et al. 1994, ApJ, 434, 641
- Sharma et al. (2020) Sharma, S., Hayden, M. R., & Bland-Hawthorn, J. 2020, arXiv e-prints, arXiv:2005.03646
- Siess (2006) Siess, L. 2006, A&A, 448, 717
- Siess (2007) —. 2007, A&A, 476, 893
- Staff et al. (2012) Staff, J. E., Menon, A., Herwig, F., et al. 2012, ApJ, 757, 76
- Stanton & Murillo (2016) Stanton, L. G., & Murillo, M. S. 2016, Phys. Rev. E, 93, 043203
- Temmink et al. (2020) Temmink, K. D., Toonen, S., Zapartas, E., Justham, S., & Gänsicke, B. T. 2020, A&A, 636, A31
- Towns et al. (2014) Towns, J., Cockerill, T., Dahan, M., et al. 2014, Computing in Science & Engineering, 16, 62
- Tremblay et al. (2019) Tremblay, P.-E., Fontaine, G., Fusillo, N. P. G., et al. 2019, Nature, 565, 202
- van der Walt et al. (2011) van der Walt, S., Colbert, S. C., & Varoquaux, G. 2011, Computing in Science Engineering, 13, 22
- van Horn (1968) van Horn, H. M. 1968, ApJ, 151, 227