High Molecular Gas Masses in Absorption-selected Galaxies at
Abstract
We have used the Atacama Large Millimeter/submillimeter Array (ALMA) to carry out a search for CO (32) or (43) emission from the fields of 12 high-metallicity ([M/H] dex) damped Lyman- absorbers (DLAs) at . We detected CO emission from galaxies in the fields of five DLAs (two of which have been reported earlier), obtaining high molecular gas masses, . The impact parameters of the CO emitters to the QSO sightline lie in the range kpc, with the three new CO detections having kpc. The highest CO line luminosities and inferred molecular gas masses are associated with the highest-metallicity DLAs, with [M/H] dex. The high inferred molecular gas masses may be explained by a combination of a stellar mass-metallicity relation and a high molecular gas-to-stars mass ratio in high-redshift galaxies; the DLA galaxies identified by our CO searches have properties consistent with those of emission-selected samples. None of the DLA galaxies detected in CO emission were identified in earlier optical or near-IR searches and vice-versa; DLA galaxies earlier identified in optical/near-IR searches were not detected in CO emission. The high ALMA CO and C[ii] 158m detection rate in high-, high-metallicity DLA galaxies has revolutionized the field, allowing the identification of dusty, massive galaxies associated with high- DLAs. The Hi-absorption criterion identifying DLAs selects the entire high- galaxy population, including dusty and UV-bright galaxies, in a wide range of environments.
1 Introduction
The most direct way of identifying galaxy populations at high redshifts is to detect the emission from individual galaxies in deep images, usually in the optical or the near-infrared bands. However, such “emission-selected” samples contain a bias towards the more-luminous members of the population. Galaxies identified by their stellar emission have an additional bias towards objects with a high star-formation rate (SFR) and a high stellar mass. An alternative way of identifying high- galaxies, without luminosity or stellar biases, is via their damped Lyman- absorption signature (with Hi column density cm-2) in quasar absorption spectra, if the galaxy lies along the sightline to a background quasar (Wolfe et al., 2005). Quasar spectroscopy with the Sloan Digital Sky Survey (SDSS) has yielded more than 30,000 such damped absorbers (DLAs) today, mostly at (e.g. Noterdaeme et al., 2012).
Selected by the presence of high Hi column densities, absorption-selected galaxies provide a complementary view of the high-redshift universe to the usual emission-selected samples. Absorption-selected galaxies are not biased towards high luminosities, SFRs, or stellar masses, although the absorption selection favours galaxies with larger gas cross-sections. An important question in galaxy evolution is whether absorption and emission selection trace the same galaxy population, or whether new types of galaxies are identified by the absorption selection. Addressing this issue requires identification and characterization of the absorption-selected galaxies. Unfortunately, the presence of the nearby bright background quasar makes it difficult to even identify the DLA hosts via the usual techniques of optical imaging and spectroscopy (although see Fumagalli et al., 2014). Only around 20 galaxies have been found by such studies to be associated with DLAs at (e.g. Krogager et al., 2017; Mackenzie et al., 2019). Further, DLA samples selected from magnitude-limited optical surveys like the SDSS are biased against dusty intervening galaxies, as a high dust content could obscure the background quasar and remove it from a magnitude-limited sample (e.g. Krogager et al., 2019). DLA surveys towards radio- or mid-IR-selected quasar samples (e.g. Ellison et al., 2001; Krogager et al., 2016), and “blind” Hi 21cm or mm-wave absorption surveys (e.g. Kanekar et al., 2014) may be used to yield absorption-selected galaxies without a dust bias.
The advent of the Atacama Large Millimeter/submillimeter Array (ALMA) has allowed two new approaches to identify and study galaxies associated with high- DLAs, tracing cold gas in emission with the redshifted [Cii] 158m fine-structure and CO rotational lines. Neeleman et al. (2017, 2019) used ALMA [Cii] 158m studies to identify the host galaxies of five high-metallicity DLAs at . Two of these galaxies were later mapped in their [Cii] 158m emission, revealing a merging system at (Prochaska et al., 2019) and the “Wolfe disk”, a cold rotating disk galaxy at (Neeleman et al., 2020). ALMA CO studies of known DLA hosts at yielded high molecular gas masses and large gas depletion times, very different from emission-selected samples (Møller et al., 2018; Kanekar et al., 2018). Our initial searches for CO emission associated with DLAs at have identified massive galaxies in the fields of the DLA towards B1228-113 (Neeleman et al., 2018) and the DLA towards J0918+1636 (Fynbo et al., 2018). And a Very Large Array (VLA) search for CO emission from the [Cii] 158m-emitting DLA host towards J0817+1351 also yielded a high molecular gas mass, (Neeleman et al., 2020).
For a given molecular gas mass, it is easier to detect CO emission from high-metallicity galaxies than from low-metallicity ones, as the former have a lower CO-to-H2 conversion factor (e.g. Bolatto et al., 2013). For example, in the case of normal (i.e. main-sequence) emission-selected galaxies at high redshifts, CO searches have typically been carried out in objects with a high stellar mass and/or a high SFR, consistent with a high metallicity (e.g. Daddi et al., 2010; Tacconi et al., 2013; Dessauges-Zavadsky et al., 2015; Genzel et al., 2017). We hence chose to target high-metallicity absorbers in our search for CO emission from galaxies associated with high- DLAs. In this Letter, we report the results of an ALMA search for redshifted CO emission from the fields of 12 high-metallicity DLAs at .111We assume a flat -Cold Dark Matter cosmology, with , , H km s-1 Mpc-1 (Planck Collaboration et al., 2018).
2 Observations, Data analysis, and Results
The ALMA bands 3 and 4 were used to search for redshifted CO emission from the fields of 12 DLAs at in proposals 2016.1.00628.S and 2017.1.01558.S (PI: Prochaska), from 2017 January to 2018 August. The DLAs were selected to have high metallicities, [M/H] . Four 1.875 GHz spectral windows were used for all observations, with one spectral window, sub-divided into 3840 channels, used to cover either the CO() or the CO() line at the DLA redshift, and the remaining three spectral windows, sub-divided into 120 channels, used to measure the continuum emission in the field. The observations were carried out in compact array configurations, with total on-source times of hours. A standard calibration approach was followed, with each observing run including observations of one or more flux calibrators and a bandpass calibrator, and with scans on the target source interleaved with scans on a secondary calibrator. The typical error on the flux density scale is expected to be %.
The initial calibration used the standard ALMA pipeline in the casa package (McMullin et al., 2007). In three sources (B1228-113, B1230-101, J2225+0527), the quasar continuum flux density was sufficient to perform self-calibration; this was carried out in either the aips (Greisen, 2003) or the casa packages, following standard procedures. After subtracting out any detected continuum emission (using the casa task uvsub), the final spectral cubes were created using natural weighting, at velocity resolutions of km s-1, and searched for line emission. In case of non-detections, limits on the CO line flux density were obtained from the cubes at a velocity resolution of 200 km s-1.
| QSO | CO line | RMS | Resn. | RMSCO | Beam | |||||||
| GHz | Jy/Bm | km s-1 | Jy | Jy km s-1 | km s-1 | Jy | ||||||
| J0044+0018⋆ | 1.874 | 1.7250 | 126.9 | 16 | 200 | 125 | ||||||
| J0815+1037 | 2.020 | 1.8462 | 162.0 | 11 | 200 | 80 | ||||||
| J1024+0600 | 2.130 | 1.8950 | 159.3 | 19 | 200 | 157 | ||||||
| J2206-1958 | 2.558 | 1.9200 | 157.9 | 9.0 | 200 | 75 | ||||||
| B1230-101⋆ | 2.394 | 1.9314 | 157.3 | 23 | 200 | 90 | ||||||
| B0551-366 | 2.317 | 1.9622 | 155.6 | 24 | 50 | 330 | ||||||
| J0016-0012 | 2.090 | 1.9730 | 155.2 | 5.4 | 100 | 65 | ||||||
| J1305+0924 | 2.051 | 2.0184 | 114.6 | 13 | 200 | 200 | ||||||
| J2225+0527 | 2.323 | 2.1310 | 110.4 | 18 | 200 | 275 | ||||||
| B1228-113† | 3.528 | 2.1929 | 108.3 | 11 | 43.2 | 150 | ||||||
| J2222-0946 | 2.926 | 2.3543 | 103.1 | 10 | 200 | 100 | ||||||
| J0918+1636† | 3.096 | 2.5832 | 96.5 | 13 | 48.5 | 240 |
⋆ Tentative ( significance) detections of CO emission (listed as upper limits in the table).
† The CO detections in the fields of B1228-113 and J0918+1636 were originally reported by Neeleman et al. (2018) and Fynbo et al. (2018), respectively. The data were re-analysed here, for consistency (yielding lower errors on the integrated CO line flux density).
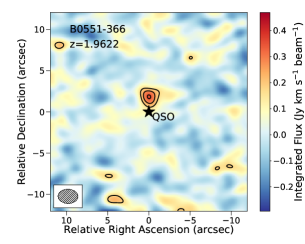
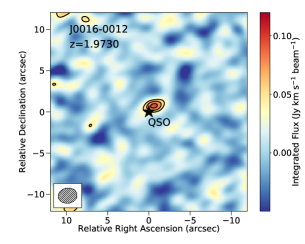
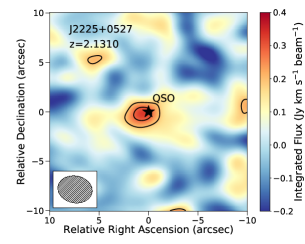
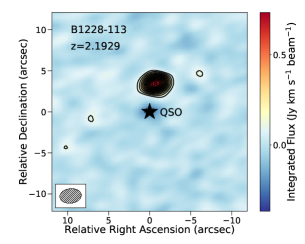
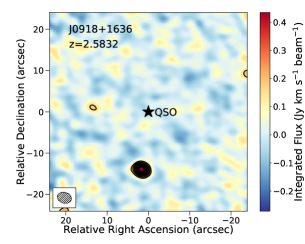
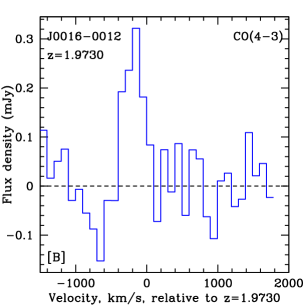
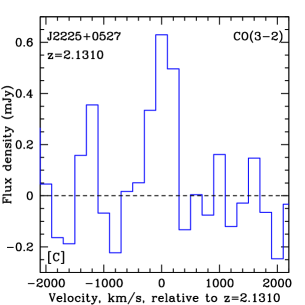
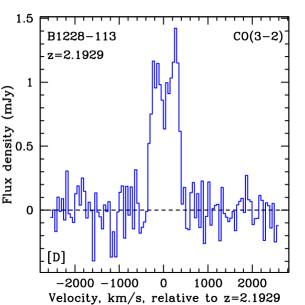
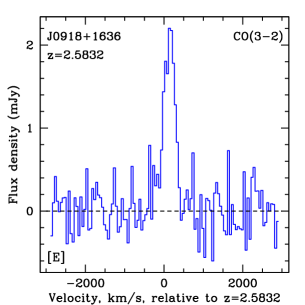
Line emission was clearly detected (at significance) from galaxies in five DLA fields, B0551-366 at , J0016-0012 at , J2225+0527 at , B1228-113 at , and J0918+1636 at , at velocities in good agreement with those of the low-ionization metal absorption lines. Fig. 1 shows the velocity-integrated CO emission from the five CO detections, two of which (in the fields of B1228-113 and J0918+1636) have been presented earlier (Neeleman et al., 2018; Fynbo et al., 2018) In all cases, the emission is unresolved by the ALMA synthesized beam; the final CO spectrum was hence obtained from a cut through the “dirty” cube at the location of the peak pixel of the velocity-integrated CO emission. In passing, we note that the ALMA synthesized beam subtends a physical size kpc at the DLA redshift for all five galaxies; it is thus unlikely that we are resolving out any CO emission. For comparison, Daddi et al. (2010) obtain CO sizes of kpc in their sample of BzK galaxies. The final CO line spectra of the five detections are shown in Fig. 2.
Two DLA fields, J0044+0018 at and B1230-101 at , showed tentative () detections of line emission, but km s-1 away from the absorption redshift. We note that Møller & Christensen (2020, see their Table 1) obtain a velocity offset km s-1 between the optical emission redshift and the absorption redshift in ten DLAs at . If the tentative CO detections are confirmed, the velocity offset between the absorption and emission redshifts suggests that either the DLA arises in gas clumps in the circumgalactic medium of the CO emitters, or the CO emission arises from galaxies in the vicinity of the DLA host, but not from the absorbing galaxy itself (as is the case for the CO emitter towards J0918+1636; Fynbo et al., 2018).
The details of the observations, data analysis, and results are summarized in Table 1, in order of increasing DLA redshift. The penultimate column lists the full-width-at-half-maximum (FWHM) of the CO emission for the five detections; the line FWHMs are all large, km s-1, consistent with massive galaxies, with the kinematics likely to be dominated by either rotation or mergers. The last column lists the continuum flux density of the identified DLA galaxy at the CO rest frequency, or upper limits on this quantity. Finally, for J2225+0527, where the continuum emission from the DLA galaxy is unresolved from the strong QSO continuum emission, no value is listed here.
The measured CO() or CO() line flux densities may be used to infer the CO line luminosities, L or L (Carilli & Walter, 2013), and thence, the molecular gas mass in the DLA galaxies, if one knows the CO-to-H2 conversion factor and the CO level excitation (Carilli & Walter, 2013; Bolatto et al., 2013). We will assume sub-thermal excitation of the higher-J levels, with and [where and ], valid for galaxies near the main sequence at (e.g. Tacconi et al., 2020). We will also assume (K km s-1 pc2)-1, applicable for galaxies with metallicity near solar and which are not undergoing a starburst (e.g. Bolatto et al., 2013; Tacconi et al., 2020). The inferred molecular gas masses for the five DLA galaxies with CO detections lie in the range , while the upper limits on the molecular gas mass for the CO non-detections are . While a lower value of or a higher CO line excitation (e.g. Klitsch et al., 2019; Riechers et al., 2020) would lower the above molecular gas mass estimates, we note that the assumed values are likely to be reliable for normal (i.e. non-starburst) galaxies. Our results are summarized in Table 2.

3 Discussion
Our ALMA search for CO emission from the galaxies associated with 12 high-metallicity DLAs at has resulted in the confirmed ( significance) detection of five CO-emitting galaxies at redshifts consistent with the DLA redshift (see also Neeleman et al., 2018; Fynbo et al., 2018). Along with the detection of CO(2-1) emission from the Wolfe disk (Neeleman et al., 2020), these are the first detections of CO emission from high- DLA galaxies, after more than 25 years of such searches (e.g. Wiklind & Combes, 1994). ALMA has revolutionized this field, providing a new route to identifying DLA galaxies unaffected by the QSO’s brightness.
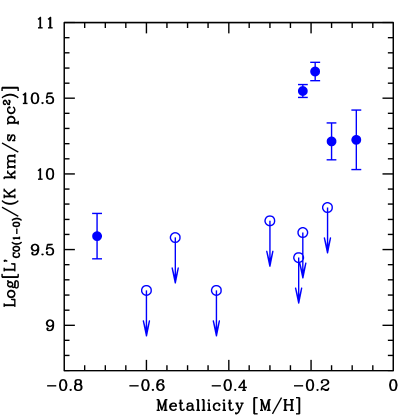
The DLAs of the sample have [M/H] , and thus lie in the top quartile of the metallicity distribution of DLAs at (e.g. Rafelski et al., 2014). Athough the sample size is still small, the CO detections tend to arise (see Table 2) in the DLAs with the highest metallicities and values, of our sample. For example, four of the five CO detections are in the fields of DLAs with [M/H] ; these four galaxies have the highest inferred CO(1–0) line luminosities ( K km s-1 pc2; see Fig. 3[A]) and the highest inferred molecular gas masses, . Similarly, all five CO detections have km s-1. Earlier studies have found such high values to be associated with massive DLA galaxies at small impact parameters to the QSO sightline (Christensen et al., 2019; Møller & Christensen, 2020); our five detections of CO emission do indeed arise in massive galaxies, but three of the impact parameters are large, kpc. Finally, the large FWHMs of the detected CO lines ( km s-1) are suggestive of rotation; for the DLA galaxy towards B1228-113, this is supported by the “double-horned” nature of the CO line profile (see Fig. 2[D]). However, our present ALMA data do not have the resolution or sensitivity to rule out the possibility of merging galaxies, as has been shown to be the case for the DLA towards J1201+2117 (Prochaska et al., 2019).
Interestingly, we have detected CO emission from a galaxy in the field of the DLA towards J0016-0012, which has the lowest metallicity ([M/H] ; Petitjean et al., 2002) of our sample. The low impact parameter of the DLA galaxy to the QSO sightline ( kpc) makes it unlikely that the emission metallicity is near solar, unless the galaxy has a large metallicity gradient ( dex per kpc). If the metallicity of the DLA galaxy is below solar, it is likely that (K km s-1 pc2)-1; if so, our estimate of the molecular gas mass in this galaxy would be a lower limit. However, this DLA also has by far the largest of our sample, km s-1 (Ledoux et al., 2006), and is the only system for which the value is larger than the width of the CO emission (see also Neeleman et al., 2017; Prochaska et al., 2019). It is plausible that the large value is due to the presence of two or more galaxies along the QSO sightline (see also Petitjean et al., 2002), both contributing to the Hi column density, but only one of which has a high (near-solar) metallicity and is detected in CO emission. Consistent with this hypothesis, strong metal-line absorption (including Ci and Ci∗, but, curiously, not H2) was detected at by Petitjean et al. (2002), in excellent agreement with the peak CO redshift (). In passing, we note that Neeleman et al. (2017) find the absorption spread of the DLA towards J1201+2117 to be larger than the width of the [Cii] 158m emission of the associated galaxy; the [Cii] 158m emission was later shown to arise from two merging galaxies (Prochaska et al., 2019).
| DLA | [M/H] | CO line | Refs. | ||||||
|---|---|---|---|---|---|---|---|---|---|
| cm-2 | km s-1 | K km s-1 pc2 | kpc | ||||||
| J0044+0018⋆ | 1.7250 | 20.35 | -0.23 | 172 | 1 | ||||
| J0815+1037 | 1.8462 | 20.30 | -0.43 | 1 | |||||
| J1024+0600 | 1.8950 | 20.60 | -0.30 | 161 | 1 | ||||
| J2206-1958 | 1.9200 | 20.67 | -0.60 | 136 | 2 | ||||
| B1230-101⋆ | 1.9314 | 20.48 | -0.22 | 94 | 3 | ||||
| B0551-366 | 1.9622 | 20.50 | -0.15 | 239 | 2 | ||||
| J0016-0012 | 1.9730 | 20.83 | -0.72 | 720 | 4 | ||||
| J1305+0924 | 2.0184 | 20.40 | -0.16 | 135 | 1 | ||||
| J2225+0527 | 2.1310 | 20.69 | -0.09 | 331 | 3 | ||||
| B1228-113 | 2.1929 | 20.60 | -0.22 | 163 | 5 | ||||
| J2222-0946 | 2.3543 | 20.65 | -0.53 | 174 | 6 | ||||
| J0918+1636 | 2.5832 | 20.96 | -0.19 | 288 | 7 |
Besides the high CO detection rate, our most striking result is the large molecular gas masses of the five galaxies with confirmed CO detections, . These are similar to the masses of the most massive colour-selected BzK galaxies at (e.g. Daddi et al., 2010), and galaxies selected based on a combination of high stellar mass and high SFR at (e.g. Tacconi et al., 2013). The high molecular gas masses of a significant fraction of galaxies in the fields of high-metallicity DLAs at can be plausibly accounted for by a combination of a mass-metallicity relation and a high molecular gas-to-stars mass ratio in high- galaxies. For the former, the emission metallicities of UV-selected galaxies are known to correlate with their stellar masses () at high redshifts (Erb et al., 2006). Indeed, the metallicities and velocity spreads of low-ionization metal absorption lines in high- DLAs are consistent with the existence of a similar mass-metallicity relation in the associated galaxies (e.g. Wolfe & Prochaska, 1998; Ledoux et al., 2006; Prochaska et al., 2008), as well as redshift evolution in this relation (Ledoux et al., 2006; Møller et al., 2013; Neeleman et al., 2013). For the latter, high- galaxies with high stellar masses and high SFRs have been shown to have a high molecular gas-to-stars mass ratio, (e.g. Dessauges-Zavadsky et al., 2015; Tacconi et al., 2020).
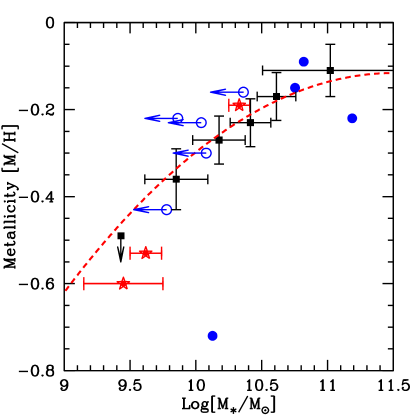
Fig. 3[B] plots the DLA metallicity versus the inferred stellar mass for the DLA galaxies, assuming . Also plotted in the figure are the emission metallicity (relative to solar, assuming a solar metallicity of 12+[O/H]=8.69; Asplund et al., 2009) and the stellar mass for the (binned) UV-selected galaxies of Erb et al. (2006). It should be emphasized that the emission metallicities of the DLA galaxies are likely to be equal to or higher than the absorption metallicities (e.g. Møller et al., 2013), given that the absorption metallicity is being measured in the outskirts of the galaxy (impact parameters kpc). Despite this, and the simplistic assumption that , all but one of the absorption-selected DLA galaxies appear broadly consistent with the stellar mass-metallicity relation of emission-selected galaxies at similar redshifts. In passing, we emphasize that the fact that the DLA galaxies appear to lie on the same mass-metallicity relation as the emission-selected galaxies does not necessarily imply that the absorption arises from gas in the specific DLA galaxy identified here (see below).
The three new CO detections, towards B0551-366, J0016-0012, and J2225+0527, all have relatively low impact parameters ( kpc) to the QSO sightline; it is plausible that the damped Lyman- absorption here arises from gas in the disks of these galaxies (although the disk may be only one of the absorbing components along the sightline; see Christensen et al., 2019; Møller & Christensen, 2020). This is especially the case for the DLAs towards J0016-0012 and J2225+0527, where kpc. However, we note that the peak CO emission redshift for three of the four CO-emitting galaxies with kpc is in good agreement (within km s-1) with the DLA redshift, while even for the fourth system, the DLA towards J0016-0012, strong low-ionization metal-line absorption is detected at , consistent with the CO emission redshift. The agreement between the emission and absorption redshifts is surprising, given the wide range of impact parameters, kpc, and the large CO FWHMs and values (which indicate that the galaxies are unlikely to be close to face-on). This suggests that some of these DLAs may arise in gas clumps in a dynamically well-mixed CGM around the CO-emitting galaxies (see also Christensen et al., 2019; Møller & Christensen, 2020). Finally, the CO emission in the field of J0918+1636 has a large impact parameter ( kpc), a significant velocity offset ( km s-1) between the low-ionization metal absorption lines and the CO emission line, as well as a galaxy at the DLA redshift much closer to the QSO sightline; this indicates that the CO emission here is likely to arise from a companion galaxy within the group of galaxies at the DLA redshift (Fynbo et al., 2013, 2018).
Five of the DLA fields of our sample (towards B1228-113, J2206-1958, J2222-0946, J2225+0527, and J0918+1636) have been earlier searched for the associated galaxies using optical or near-IR spectroscopy (e.g. Møller et al., 2002; Péroux et al., 2012; Fynbo et al., 2013; Krogager et al., 2016). In the three cases where the associated galaxy has been confirmed by optical or near-IR spectroscopy (J2206-1958, J2222-0946, and J0918+1636), we did not obtain a detection of CO emission from the galaxy with the optical emission (in the case of J0918+1636, we detected a second galaxy at the DLA redshift; Fynbo et al., 2018). Conversely, the three galaxies that showed CO emission (B1228-113, J2225+0527, and J0918+1636) were not identified in the optical or near-IR spectroscopy: the galaxy in the field of B1228-113 was found to show weak H emission after its CO position was known (Neeleman et al., 2018), while the galaxy in the field of J2225+0527 was earlier tentatively detected in a near-IR image (Krogager et al., 2016), but without a confirming redshift. This suggests that CO and optical/near-IR searches for galaxies associated with high- DLAs are complementary, with the former sensitive to the more massive, dusty galaxies associated with the highest-metallicity DLAs, and the latter to the lower-mass and less dusty galaxies. Our results further indicate that the Hi-absorption selection yields the complete population of galaxies at high redshifts, , and a diversity of environments, including dusty objects that are bright in CO and dust emission, and dust-poor objects that are bright in stellar emission. The Hi-absorption selection also yields the identification of high- galaxy groups, where the damped Lyman- absorption may arise from neutral hydrogen lying in between the galaxies (e.g. Chen et al., 2019; Péroux et al., 2019).
In summary, we have carried out an ALMA search for CO(32) or CO(43) emission in the fields of 12 high-metallicity ([M/H] ) DLAs at . We detect CO emission from five galaxies at redshifts in good agreement with the DLA redshift; the impact parameters of the CO emitters to the QSO sightline are kpc. We obtain high molecular gas masses, , with the highest CO line luminosities and inferred molecular gas masses arising in galaxies associated with the highest metallicity DLAs, [M/H] . The good agreement between the CO emission redshift and the metal-line absorption redshift in all four DLAs with impact parameters kpc suggests that the DLAs may arise in gas clumps in the CGM of the galaxies, although absorbers at low impact parameters kpc may contain contributions from the disk of the CO-emitting galaxy. The fifth DLA, towards J0918+1636, is likely to arise in gas associated with a spectroscopically-confirmed galaxy with a lower impact parameter. The high molecular gas masses of the galaxies associated with the five DLAs can be plausibly explained by a combination of the stellar mass-metallicity relation and a high molecular gas-to-stars mass ratio in high- galaxies.
_Gas).
JXP acknowledges support from NSF AST-1412981. LC is supported by
DFF - 4090-00079. Support for this work was provided by the NSF through award SOSPA2-002
from the NRAO. ALMA is a partnership of ESO (representing its member states), NSF (USA) and
NINS (Japan), together with NRC (Canada), NSC and ASIAA (Taiwan), and KASI (Republic of Korea),
in cooperation with the Republic of Chile. The Joint ALMA Observatory is operated by ESO, AUI/NRAO
and NAOJ. The data reported in this paper are available though the ALMA archive
(https://almascience.nrao.edu/alma-data/archive) with project codes: ADS/JAO.ALMA #2016.1.00628.S
and #2017.1.01558.S.
References
- Asplund et al. (2009) Asplund, M., Grevesse, N., Sauval, A. J., & Scott, P. 2009, ARA&A, 47, 481
- Berg et al. (2015) Berg, T. A. M., Neeleman, M., Prochaska, J. X., Ellison, S. L., & Wolfe, A. M. 2015, PASP, 127, 167
- Bolatto et al. (2013) Bolatto, A. D., Wolfire, M., & Leroy, A. K. 2013, ARA&A, 51, 207
- Carilli & Walter (2013) Carilli, C. L. & Walter, F. 2013, ARA&A, 51, 106
- Chen et al. (2019) Chen, H.-W., Boettcher, E., Johnson, S. D., Zahedy, F. S., Rudie, G. C., Cooksey, K. L., Rauch, M., & Mulchaey, J. S. 2019, ApJL, 878, L33
- Christensen et al. (2014) Christensen, L., Møller, P., Fynbo, J. P. U., & Zafar, T. 2014, MNRAS, 445, 225
- Christensen et al. (2019) Christensen, L., Møller, P., Rhodin, N. H. P., Heintz, K. E., & Fynbo, J. P. U. 2019, MNRAS, 489, 2270
- Daddi et al. (2010) Daddi, E., et al. 2010, ApJ, 713, 686
- Dessauges-Zavadsky et al. (2015) Dessauges-Zavadsky, M., Zamojski, M., Schaerer, D., Combes, F., Egami, E., Swinbank, A. M., Richard, J., Sklias, P., Rawle, T. D., Rex, M., Kneib, J. P., Boone, F., & Blain, A. 2015, A&A, 577, A50
- Ellison et al. (2001) Ellison, S. L., Yan, L., Hook, I. M., Pettini, M., Wall, J. V., & Shaver, P. 2001, A&A, 379, 393
- Erb et al. (2006) Erb, D. K., Shapley, A. E., Pettini, M., Steidel, C. C., Reddy, N. A., & Adelberger, K. L. 2006, ApJ, 644, 813
- Fumagalli et al. (2014) Fumagalli, M., Hennawi, J. F., Prochaska, J. X., Kasen, D., Dekel, A., Ceverino, D., & Primack, J. 2014, ApJ, 780, 74
- Fynbo et al. (2013) Fynbo, J. P. U., et al. 2013, MNRAS, 436, 361
- Fynbo et al. (2018) Fynbo, J. P. U., Heintz, K. E., Neeleman, M., Christensen, L., Dessauges-Zavadsky, M., Kanekar, N., Møller, P., Prochaska, J. X., Rhodin, N. H. P., & Zwaan, M. 2018, MNRAS, 479, 2126
- Fynbo et al. (2010) Fynbo, J. P. U., et al. 2010, MNRAS, 408, 2128
- Genzel et al. (2017) Genzel, R., et al. 2017, Nature, 543, 397
- Greisen (2003) Greisen, E. W. 2003, in Astrophysics and Space Science Library, Vol. 285, Information Handling in Astronomy - Historical Vistas, ed. A. Heck, 109
- Kanekar et al. (2014) Kanekar, N., Gupta, A., Carilli, C. L., Stocke, J. T., & Willett, K. W. 2014, ApJ, 782, 56
- Kanekar et al. (2018) Kanekar, N., Prochaska, J. X., Christensen, L., Rhodin, N. H. P., Neeleman, M., Zwaan, M. A., Møller, P., Dessauges-Zavadsky, M., Fynbo, J. P. U., & Zafar, T. 2018, ApJL, 856, L23
- Klitsch et al. (2019) Klitsch, A., Zwaan, M. A., Péroux, C., Smail, I., Oteo, I., Popping, G., Swinbank, A. M., Ivison, R. J., & Biggs, A. D. 2019, MNRAS, 482, L65
- Krogager et al. (2013) Krogager, J.-K., Fynbo, J. P. U., Ledoux, C., Christensen, L., Gallazzi, A., Laursen, P., Møller, P., Noterdaeme, P., Péroux, C., Pettini, M., & Vestergaard, M. 2013, MNRAS, 433, 3091
- Krogager et al. (2019) Krogager, J.-K., Fynbo, J. P. U., Møller, P., Noterdaeme, P., Heintz, K. E., & Pettini, M. 2019, MNRAS, 486, 4377
- Krogager et al. (2016) Krogager, J. K., Fynbo, J. P. U., Noterdaeme, P., Zafar, T., Møller, P., Ledoux, C., Krühler, T., & Stockton, A. 2016, MNRAS, 455, 2698
- Krogager et al. (2017) Krogager, J.-K., Møller, P., Fynbo, J. P. U., & Noterdaeme, P. 2017, MNRAS, 469, 2959
- Ledoux et al. (2006) Ledoux, C., Petitjean, P., Fynbo, J. P. U., Møller, P., & Srianand, R. 2006, A&A, 457, 71
- Mackenzie et al. (2019) Mackenzie, R., et al. 2019, MNRAS, 487, 5070
- McMullin et al. (2007) McMullin, J. P., Waters, B., Schiebel, D., Young, W., & Golap, K. 2007, in Astronomical Society of the Pacific Conference Series, Vol. 376, Astronomical Data Analysis Software and Systems XVI, ed. R. A. Shaw, F. Hill, & D. J. Bell, 127
- Møller & Christensen (2020) Møller, P. & Christensen, L. 2020, MNRAS, 492, 4805
- Møller et al. (2018) Møller, P., Christensen, L., Zwaan, M. A., Kanekar, N., Prochaska, J. X., Rhodin, N. H. P., Dessauges-Zavadsky, M., Fynbo, J. P. U., Neeleman, M., & Zafar, T. 2018, MNRAS, 474, 4039
- Møller et al. (2013) Møller, P., Fynbo, J. P. U., Ledoux, C., & Nilsson, K. K. 2013, MNRAS, 430, 2680
- Møller et al. (2002) Møller, P., Warren, S. J., Fall, S. M., Fynbo, J. U., & Jakobsen, P. 2002, ApJ, 574, 51
- Neeleman et al. (2018) Neeleman, M., Kanekar, N., Prochaska, J. X., Christensen, L., Dessauges-Zavadsky, M., Fynbo, J. P. U., Møller, P., & Zwaan, M. A. 2018, ApJL, 856, L12
- Neeleman et al. (2017) Neeleman, M., Kanekar, N., Prochaska, J. X., Rafelski, M., Carilli, C. L., & Wolfe, A. M. 2017, Science, 355, 1285
- Neeleman et al. (2019) Neeleman, M., Kanekar, N., Prochaska, J. X., Rafelski, M. A., & Carilli, C. L. 2019, ApJL, 870, L19
- Neeleman et al. (2020) Neeleman, M., Prochaska, J. X., Kanekar, N., & Rafelski, M. A. 2020, Nature, 581, 269
- Neeleman et al. (2013) Neeleman, M., Wolfe, A. M., Prochaska, J. X., & Rafelski, M. 2013, ApJ, 769, 54
- Noterdaeme et al. (2012) Noterdaeme, P. et al. 2012, A&A, 547, L1
- Péroux et al. (2012) Péroux, C., Bouché, N., Kulkarni, V. P., York, D. G., & Vladilo, G. 2012, MNRAS, 419, 3060
- Péroux et al. (2019) Péroux, C., Zwaan, M. A., Klitsch, A., Augustin, R., Hamanowicz, A., Rahmani, H., Pettini, M., Kulkarni, V., Straka, L. A., Biggs, A. D., York, D. G., & Milliard, B. 2019, MNRAS, 485, 1595
- Petitjean et al. (2002) Petitjean, P., Srianand, R., & Ledoux, C. 2002, MNRAS, 332, 383
- Planck Collaboration et al. (2018) Planck Collaboration, Aghanim, N., et al. 2018, arXiv e-prints, arXiv:1807.06209
- Prochaska et al. (2008) Prochaska, J. X., Chen, H.-W., Wolfe, A. M., Dessauges-Zavadsky, M., & Bloom, J. S. 2008, ApJ, 672, 59
- Prochaska et al. (2019) Prochaska, J. X., Neeleman, M., Kanekar, N., & Rafelski, M. 2019, ApJL, 886, L35
- Prochaska & Wolfe (1997) Prochaska, J. X. & Wolfe, A. M. 1997, ApJ, 487, 73
- Prochaska et al. (2007) Prochaska, J. X., Wolfe, A. M., Howk, J. C., Gawiser, E., Burles, S. M., & Cooke, J. 2007, ApJS, 171, 29
- Rafelski et al. (2014) Rafelski, M., Neeleman, M., Fumagalli, M., Wolfe, A. M., & Prochaska, J. X. 2014, ApJL, 782, L29
- Riechers et al. (2020) Riechers, D. A., et al. 2020, ApJL, 896, L21
- Tacconi et al. (2020) Tacconi, L. J., Genzel, R., & Sternberg, A. 2020, ARA&A (in press), arXiv:2003.06245
- Tacconi et al. (2013) Tacconi, L. J., et al. 2013, ApJ, 768, 74
- Tremonti et al. (2004) Tremonti, C. A., Heckman, T. M., Kauffmann, G., Brinchmann, J., Charlot, S., White, S. D. M., Seibert, M., Peng, E. W., Schlegel, D. J., Uomoto, A., Fukugita, M., & Brinkmann, J. 2004, ApJ, 613, 898
- Wiklind & Combes (1994) Wiklind, T. & Combes, F. 1994, A&A, 288, L41
- Wolfe et al. (2005) Wolfe, A. M., Gawiser, E., & Prochaska, J. X. 2005, ARA&A, 43, 861
- Wolfe & Prochaska (1998) Wolfe, A. M. & Prochaska, J. X. 1998, ApJ, 494, L15