Convolution Neural Networks for diagnosing colon and lung cancer histopathological images
Abstract
Lung and Colon cancer are one of the leading causes of mortality and morbidity in adults. Histopathological diagnosis is one of the key components to discern cancer type. The aim of the present research is to propose a computer aided diagnosis system for diagnosing squamous cell carcinomas and adenocarcinomas of lung as well as adenocarcinomas of colon using convolutional neural networks by evaluating the digital pathology images for these cancers. Hereby, rendering artificial intelligence as useful technology in the near future. A total of 2500 digital images were acquired from LC25000 dataset containing 5000 images for each class. A shallow neural network architecture was used classify the histopathological slides into squamous cell carcinomas, adenocarcinomas and benign for the lung. Similar model was used to classify adenocarcinomas and benign for colon. The diagnostic accuracy of more than and was recorded for lung and colon respectively.
1 Introduction
According to the World health organization(WHO) cancer is the leading cause of morality in the world. Lung cancer is the most commonly diagnosed cancer ( of the total cases) and the leading cause of cancer death ( of the total cancer deaths), while colorectal cancer contributes to () for mortality Bray et al.. A rising trend has been reported around the globe for the incidence of malignant tumors which may be attributed to an increase in population. Malignancy can occur to any age group by histopathological type is diagnosed mostly in elderly age group of 50-60 years Arslan et al.. It has been predicted that cancer mortality might bump up to untill 2035 Araghi et al..
Lung cells become cancerous when they mutate to grow uncontrollably and form a cluster called a tumor. Ame The worldwide increase in lung cancer has been attributed to different factors but mainly to the exposure to breathing dangerous or toxic substances and the rise in the number of aged people in the society. The symptoms, however, are not likely to be observed until it has spread to the other parts of the body, which makes it harder to treat it.
Although lung cancer can occur in people who have never smoked, it usually is the greatest risk for people who do. Adenocarcinoma and squamous cell carcinoma are the most commonly occurring types of lung cancer while the other histological types include small as well as large cell carcinomas. Adenocarcinoma of lung cancer usually occurs in current or former smokers but is also prevalent in non-smokers. This is more prone to occur in women and youth and is found in the outer parts of the lungs even before it spreads. Squamous cell carcinomas are also associated with the history of smoking. Small and Large cell carcinoma, on the other hand, can develop in any part of the lung and has the tendency to grow and unroll rapidly making it harder to medicate.
Colon, the final part of our digestive system, when host cancerous cells, could cause colon cancer. Colon cancer is not age-specific but it typically affects older adults. It usually begins as small, noncancerous (benign) clumps of cells called polyps that form on the inner side of the colon. Over time, some of these polyps can develop to cause colon cancers.
In most colon cancers, a tumor is formed when healthy cells in the lining of the colon or rectum grow uncontrollably. Adenocarcinomas of the colon or rectum develop in the lining of the large intestine occuring in the epithelial cells and then spread to the other layers. Mucinous adenocarcinomas and signet ring cell adenocarcinoma are two less common subtypes of adenocarcinoma but are aggressive and difficult to medicate. The changes can occur over the years in one’s body which is reliant on factors such as gender, ethnicity, age, smoking patterns, and socio-economic conditions. However, if a person has some unusual inherited syndrome, the changes can transpire in a small duration of some months.
The aim of the research paper revolves around measuring the potency of the proposed algorithm of the Convolutional Neural Network (CNN) LeCun et al. to detect the common types of lung and colon cancer in the human body. The architecture of the algorithm keeps in mind the patterns of the neurons and their connectivity inside the human brain which also attributes for it’s low pre-processing required in comparison to other classification algorithms. The ability of the algorithm to learn characteristics overpowers the primitive method wherein filters are hand-engineered. The ConvNet takes input in the form of images attributes weight (learnable weights and biases) to multiple features in the image, and is able to differentiate one image from the other. We use Histopathology slides Gurcan et al. as a dataset, since the preparation process preserves the underlying tissue architecture it provides an eclectic view of disease and its effect on tissues. Additionally,histopathology image renders as a ‘gold standard’ in diagnosing almost distinct cancer types Rubin et al..
In the later section the paper is organized in the following manner: Section 2 provides an insight about previously explored research in the current domain. Section 3 provided a brief introduction about LC25000 dataset. Section 4 covers a short introduction on CNN, In addition to this Section 5 elaborates the cnn architecture used in training both the models. Section 6 reports all the experimental results and findings. Finally, Section 7 concludes our experiment while presenting some insights on future work.
2 Related Work
Doi explored the potential for automatic image processing around 4 decades ago but it is still challenging due to complexity of images to analyze. Back then feature extraction was a key step in adopting machine learning based computer-aided diagnosis (CAD). Different ontologies of cancer has been investigated in, Brake te et al., Beller et al., Yin et al., Aerts et al., Eltonsy et al., Wei et al., Hawkins et al., Barata et al., Barata et al., Han et al., Sadeghi et al., Zikic et al., Meier et al.. Moreover, Munir et al. provides a detailed overview on cancer diagnosis by conducting experiments on several deep learning techniques. It also provides a comparison of various predominant architectures for each technique.
Also, Coudray et al. trained an inceptionv3 Szegedy et al. model for classification and mutation from non–small cell lung images of adenocarcinomas and squamous cell carcinomas achieving a mean area under curve(auc) of 0.97. They also mutated the result for ten most common genes for lung adenocarcinomas. Similarly Ardila et al. predicts the risk of lung cancer using deep learning techniques by computing prior and current tomography of the patients. Lakshmanaprabu et al. explored the CT scans using deep neural networks and linear discriminant analysis for automated diagnosis. Sirinukunwattana et al. used spatially constrained CNN to perform nuclei detection and classification of cancerous tissues in colon histology images.
Recently, Abbas et al. presented a comparative study on histopathology diagnosis on squamous cell carcinomas using CNNs. It compares various CNN architectures such as AlexNet, VGG-16, ResNet achieving an F-1 score of 0.97. Similarly, Bukhari et al. presents a comparative analysis on colonic adenocarcinomas using variations of ResNet architecture achieving a baseline accuracy of .
3 LC25000 Dataset
A brief introduction on dataset is provided followed by all the data preprocessing steps.
The LC25000 Dataset Borkowski et al. contains microsopic images of lung and colon.
The dataset can be bifuragted into five different classes namely,
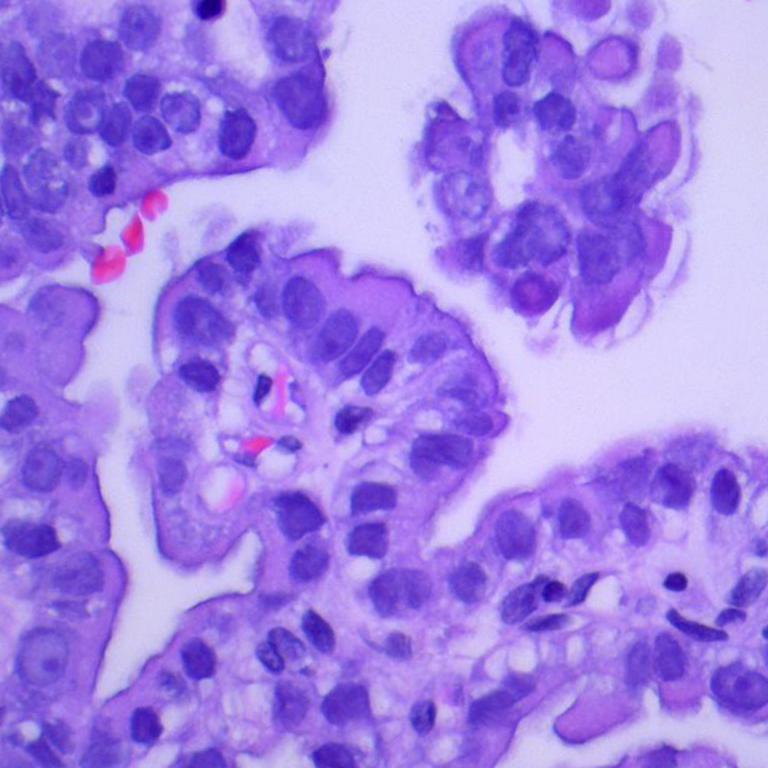
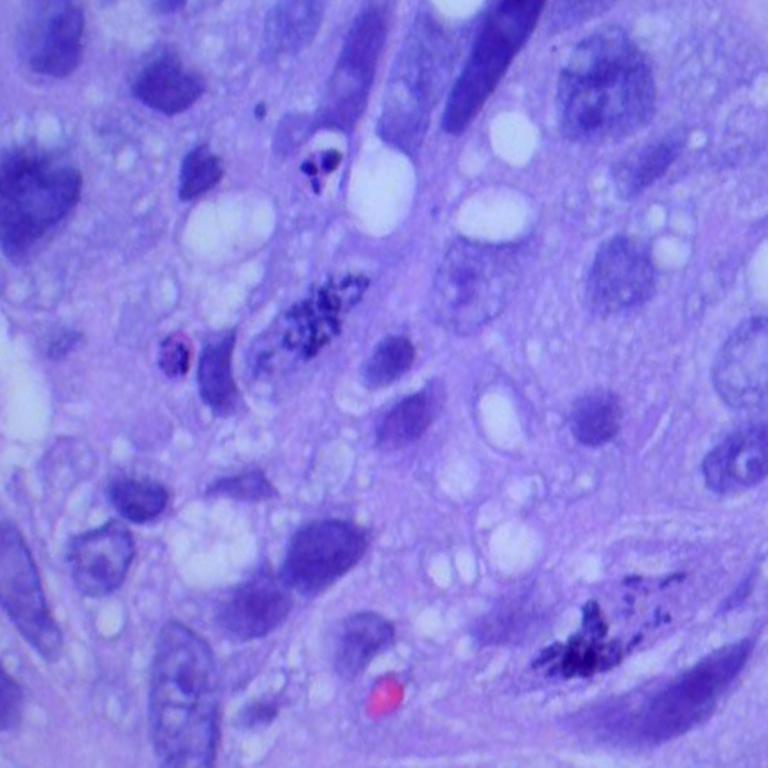
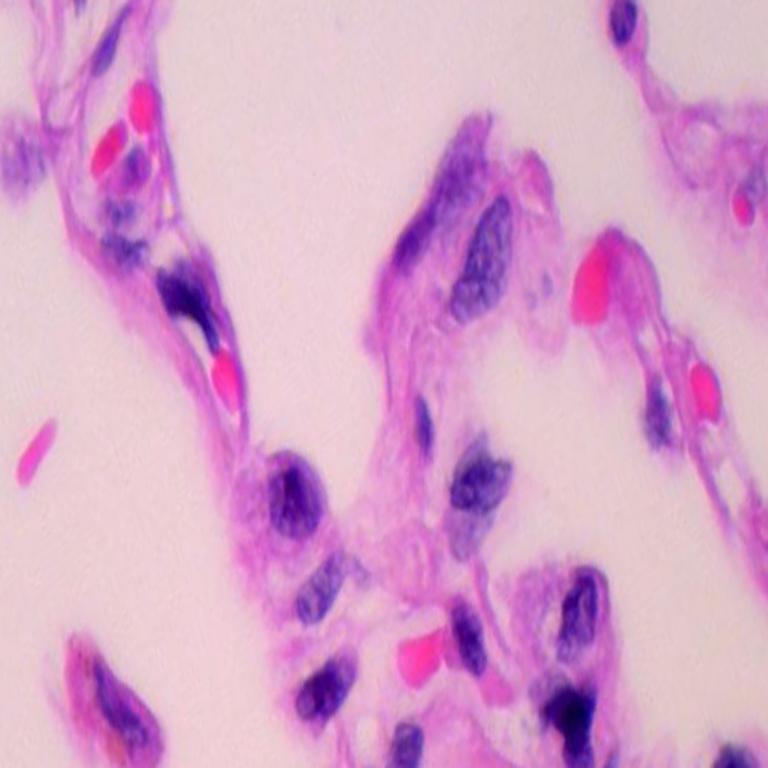
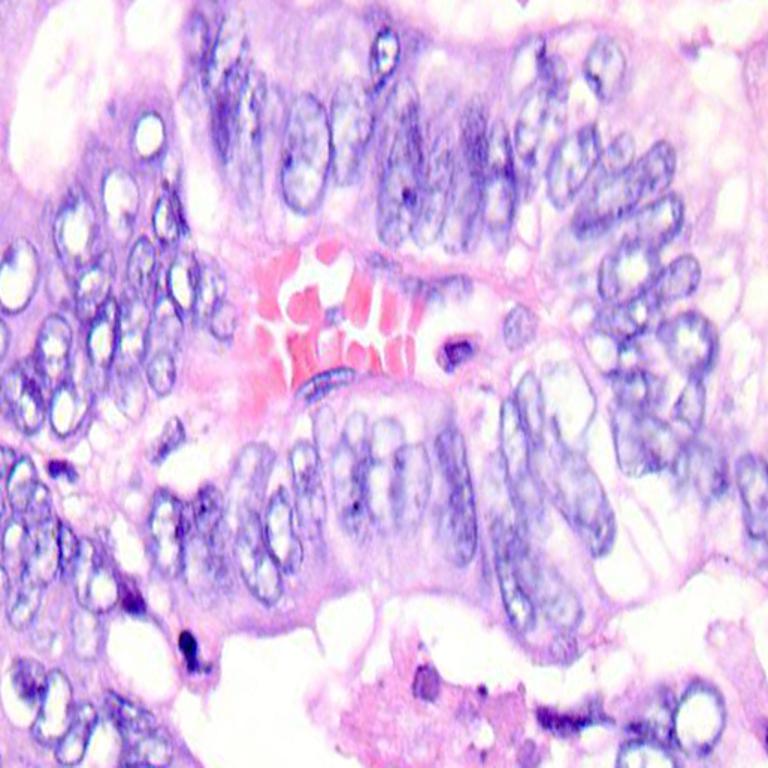
lung adenocarcinomas, lung squamous cell carcinomas, lung benign, colon adenocarcinomas and colon benign
each containing 5000 images.
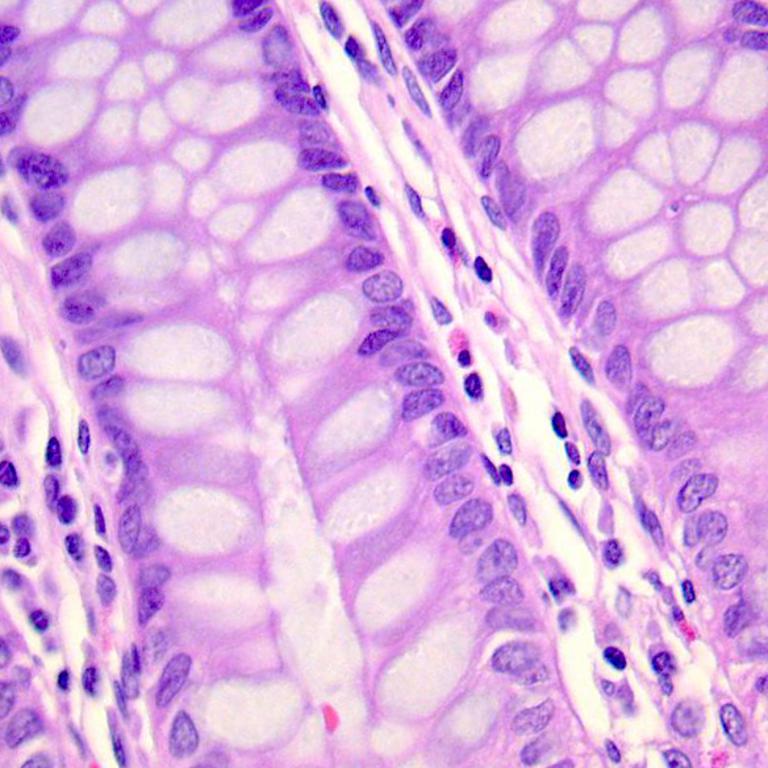
Figure 1 describes some sample images corresponding to above mentioned classes.
Original dataset contains only 750 images lung and 500 images of colon with pixel size of 1024x768,
later it was converted into square of 768x768 pixels.
Augmentor was used to expand the dataset into 25000 images with the help of rotation and flips.
Before feeding augmented data, it undergo some preprocessing.
Initially data was sampled into 4500 and 500 datapoints for training and test set respectively
for each class using random sampling proposed in Yates.
Furthermore images were resized to 150x150 pixels,
along with some randomized shear, zoom transformation followd by normaliztion of images.
4 Deep Learning Approach Using CNN
Image classification is a challenging task for the visual content, particularly microscopic images for example histopathological images due to high convolution of inter-intraclass dependencies. The underlying structures are complex and interwoven due to similar structural morphological textures. Figure 1 presents some of the complex textures present in histopathology of images. Deep learning is prevalent due to its ability to learn features directly from the input, providing us a window to avoid arduous feature extraction processes Bengio et al.. One of the key features of deep learning is to discover abstract level features and then deep dive for extracting structural semantics in the feature map. In recent years, deep learning, especially CNNs has proven to be an effective tool for classifying and diagnosing medical images Shen et al., Kermany et al., Lee et al., Suzuki In nutshell, CNN contains multiple trainable layers which could be stacked together along with a supervised classifier to learn feature maps from the given input data feed. Input data feed could be either digital or signal data such as audio, video, images and time-series. For example, upon considering a coloured image it is a feature map of 3D tensor, i.e., a 2D tensor for each colour channel.
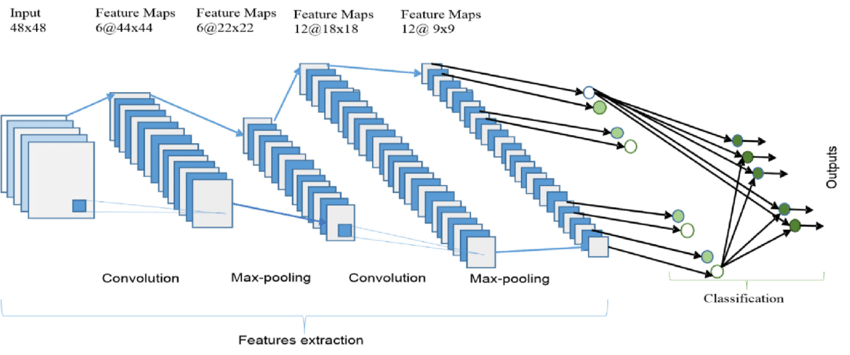
CNN architectures are composed of mainly three layers which are: convolution layer, max pooling layer and fully connected layer or dense layer. These layers could be stacked in multiple combinations to produce a CNN. An example of typical CNN is show in Figure 2.
In a typical CNN, convolution layer acts as a key component for any given architecture.
Convolution layers compute a dot product between weights and input signal connected to that local region.
The set of weights which are convoluted along the input vector is called kernel or filters.
Each filter is small but extends across the full depth of the input volume.
For image inputs a typical size of filter is generally (3x3, 5x5, 8x8).
These weights are shared across neurons so that filters can learn all the geometrical structures from the image.
The distance between applications of these filters is termed as stride.
If hyperparameter stride is smaller than filter size than overlapping convolutions are applied to the image.
It is a common practice to insert a pooling in between two convolution layers in order to downsample the image
along volume component, This is crucial to reduce progressively the spatial size of the representation.
Thus, reducing the number of parameters and computations required by the network helps in the overfitting control.
The pooling operation resizes the images along height and width discarding activation.
In practice, max pooling operation which provides a window of selecting the maximum value from input patch among neighborhoods
has shown better results Scherer et al..
In fully connected layer or dense layer, full connection is established between activations of input and their activation.
Computation is done with the help of matrix multiplication along with successive bias offset.
The last fully connected layer contains the final output such as probability density or logit values
Spanhol et al., Krizhevsky et al..
5 CNN Architecture and Training Strategy
In order to classify the (citeauthor dataset name) dataset we constructed the deep CNN with following layers and parameters:
Input Layer
This layer is used to load data and feed it to the first convolution layer, In our case the input is an image of size 150x150 pixels with colour channels which is 3 for RGB.
Convolution Layer
This layer is used to convolve the input image with trainable filters to learn the geo spatial structure of images, this model contains three convolution layers with filter size 3x3, stride set to 2 and padding kept the same. First layer contains 32 filters, followed by two layers with 64 filters each and they are initialized with Gaussian distribution. In addition to this, ReLU activation is applied for non linear operation to improve the performance Behnke
Pooling Layer
Pooling operation is used for downsampling the output images received from the convolution layer. There is one pooling layer after each convolution layer with pooling size of 2, padding set to valid. All the pooling layers use the most common max pooling operation.
Flatten Layer
This layer is used to convert the output from the convolution layer into a 1D tensor to connect a dense layer or fully connected layer.
Fully connected layer or dense layer
These layers treat the input as a simple vector and produce an output in a form of vector. Two dense layers are used in this model, first one contains 512 neurons and last one contains 3 and 2 neurons for lung and colon cancer respectively depending on the input class. Output from the last fully connected layer could be activated with the help of softmax activation.
| (1) |
Dropout Layer
In order to prevent overfitting of the model layers we use a dropout layer in between fully connected layers which randomly drops neurons from both visible and hidden layers Srivastava et al..
Table 1 Illustrates the parameters of the layers, where CONV+POOL stands for convolution layer followed by a pooling layer and FC by fully connected layer or dense layer.
| Layers | |||||
|---|---|---|---|---|---|
| 1 | 2 | 3 | 4 | 5 | |
| Type | CONV+POOL | CONV+POOL | CONV+POOL | FC | FC |
| Channels | 32 | 64 | 64 | 512 | 3 or 2 |
| Filter Size | 3x3 | 3x3 | 3x3 | - | - |
| Convolution Strides | 2x2 | 2x2 | 2x2 | - | - |
| Pooling Size | 2x2 | 2x2 | 2x2 | - | - |
| Pooling Strides | 1x1 | 1x1 | 1x1 | - | - |
For all the CNN modes a similar training protocol was used, purely supervised in nature. The RMSprop method proposed by Tieleman, Hinton with backpropagation was used to compute gradient and a mini batch size of 32 was used to update network weights, with starting learning rate of 10-4, in conjunction with and . Categorical cross entropy loss 2 is used to ensure that performance of the model is maintained throughout the training process. The CNN was trained for 100 iterations.
| (2) |
6 Results
To ensure that classifiers generalize well, the data was split into three categories, with 80-10-10 of data into training, testing and validation set respectively into distinct sets. This protocol was applied independently for both lung and colon cancer images. When discussing medical image processing it can be evaluated in two ways, first one is at patient level, i.e., determining the amount of images classified correctly for each patient. Secondly, it can be evaluated at the image where we calculate the number of cancer images classified correctly. In LC25000 dataset 3 no information about patients was provided hence we decided to move forward with a later method to evaluate the model performance. All the CNN models were trained on Google’s Colab using TensorFlow framework Abadi et al.. These models would be made available in h5 format at https://github.com/sanidhyamangal/lung_colon_cancer_research. Training each model took around 45 minutes.
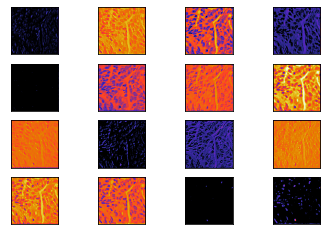
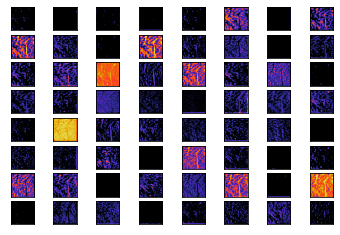
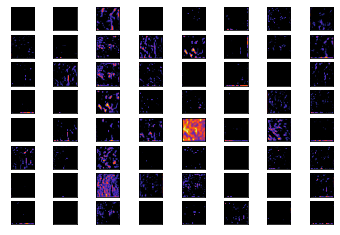
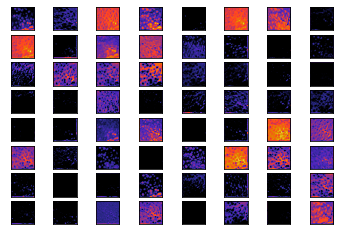
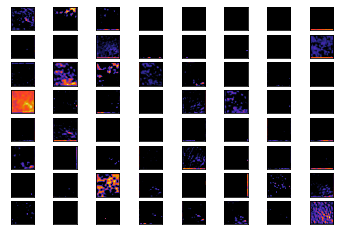
Deep Learning techniques are one of the advanced machine learning techniques which do not require the design of feature extraction by domain experts but model learns by itself. We can learn the feature detectors learned by models, considering the weights learned by feature maps. Figure 3 describes feature maps learned by all the convolution layers for both the models. We can visualize the filters at image level and also filters resemble like Gabor filters( Fogel, Sagi, Bovik et al., Zeiler, Fergus).

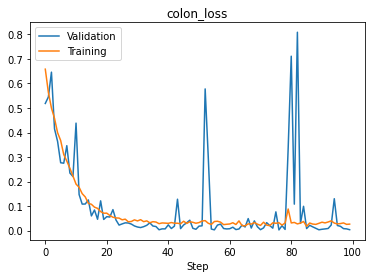
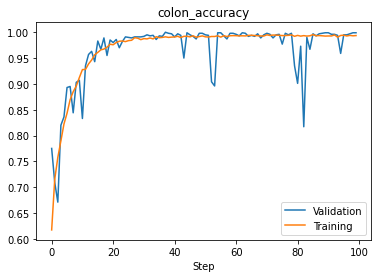
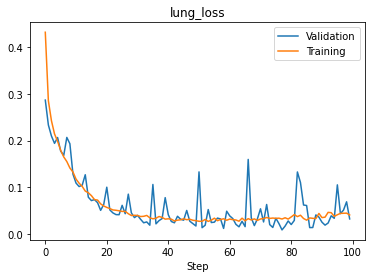
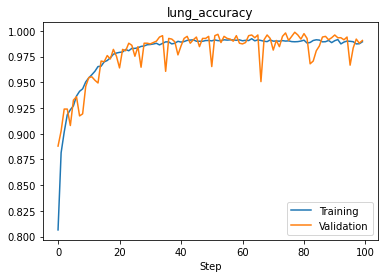
To better assess performance metrics, Figure 4 visualizes the plot between epochs vs loss and accuracy. It is quite transparent that there are jitters in all the accuracy and loss graphs due to the dropout layer which helps the neural network generalize. However, there is a slight aberration in the plots of colon, i.e., validation loss increases initially upto 5 epochs then starts to converge. Also, it can be inferred that there are large spikes in both accuracy and loss for the colon model at around and epoch. For both the models it could also be extrapolated that both the models took around 20 epochs to converge.
Table 2 reports the performace metrics for both the models, in both the modes, i.e., training and validation at image level.
| Type | Rule | Accuracy | Loss |
|---|---|---|---|
| Lung | Training | ||
| Validation | |||
| Colon | Training | ||
| Validation |
7 Conclusions
In this paper, we have presented a set of experiments conducted on the LC25000 dataset using a deep learning approach. We have shown that we could use a shallow CNN architecture, that has been designed for classifying color images of objects, and adapt it to the classification of lung and colon histopathological images. We have also proposed a training and evaluation strategy for training the CNN architecture, it allows to deal with the high-resolution of these textured images without converting those images to low-resolution images. Our experimental results obtained on the LC25000 showed improved accuracy obtained by CNN when compared to traditional machine learning models and deep convolutional neural networks models leveraging transfer learning trained on the same dataset but with state of the art texture descriptors. Future work can explore different CNN architectures and the optimization of the hyperparameters. Also, strategies to apply neural style transfer for generating interclass images for different histopathology. In addition to this generative models could be used to generate histopathological images for visualizing and exploring mutations on different ontologies.
Acknowledgments and Disclosure of Funding
We would like to acknowledge Mayank Pratap Singh, Aditi Chaurasia, Sumit Yadav, and Prachi Bundela for helpful discussions. Ravinder Singh shared his script for train test split with us and much-needed support with LaTeX typesetting. We would like to thank the developers of TensorFlow. We would also like to thank Engineerbabu IT Services PVT LTD. for providing computational resources.
References
- Ame (????) About Lung Cancer: Lung Cancer Overview. ????
- Abadi et al. (2015) Abadi Martín, Agarwal Ashish, Barham Paul, Brevdo Eugene, Chen Zhifeng, Citro Craig, Corrado Greg S., Davis Andy, Dean Jeffrey, Devin Matthieu, Ghemawat Sanjay, Goodfellow Ian, Harp Andrew, Irving Geoffrey, Isard Michael, Jia Yangqing, Jozefowicz Rafal, Kaiser Lukasz, Kudlur Manjunath, Levenberg Josh, Mané Dandelion, Monga Rajat, Moore Sherry, Murray Derek, Olah Chris, Schuster Mike, Shlens Jonathon, Steiner Benoit, Sutskever Ilya, Talwar Kunal, Tucker Paul, Vanhoucke Vincent, Vasudevan Vijay, Viégas Fernanda, Vinyals Oriol, Warden Pete, Wattenberg Martin, Wicke Martin, Yu Yuan, Zheng Xiaoqiang. TensorFlow: Large-Scale Machine Learning on Heterogeneous Systems. 2015. Software available from tensorflow.org.
- Abbas et al. (2020) Abbas Mohammad Ali, Bukhari Syed Usama Khalid, Syed Asmara, Shah Syed Sajid Hussain. The Histopathological Diagnosis of Adenocarcinoma & Squamous Cells Carcinoma of Lungs by Artificial intelligence: A comparative study of convolutional neural networks // medRxiv. 2020.
- Aerts et al. (2014) Aerts Hugo JWL, Velazquez Emmanuel Rios, Leijenaar Ralph TH, Parmar Chintan, Grossmann Patrick, Carvalho Sara, Bussink Johan, Monshouwer René, Haibe-Kains Benjamin, Rietveld Derek, others . Decoding tumour phenotype by noninvasive imaging using a quantitative radiomics approach // Nature communications. 2014. 5, 1. 1–9.
- Alom et al. (2019) Alom Md. Zahangir, Taha Tarek, Yakopcic Chris, Westberg Stefan, Sidike Paheding, Nasrin Mst, Hasan Mahmudul, Essen Brian, Awwal Abdul, Asari Vijayan. A State-of-the-Art Survey on Deep Learning Theory and Architectures // Electronics. 03 2019. 8. 292.
- Araghi et al. (2019) Araghi Marzieh, Soerjomataram Isabelle, Jenkins Mark, Brierley James, Morris Eva, Bray Freddie, Arnold Melina. Global trends in colorectal cancer mortality: projections to the year 2035 // International journal of cancer. 2019. 144, 12. 2992–3000.
- Ardila et al. (2019) Ardila Diego, Kiraly Atilla P, Bharadwaj Sujeeth, Choi Bokyung, Reicher Joshua J, Peng Lily, Tse Daniel, Etemadi Mozziyar, Ye Wenxing, Corrado Greg, others . End-to-end lung cancer screening with three-dimensional deep learning on low-dose chest computed tomography // Nature medicine. 2019. 25, 6. 954–961.
- Arslan et al. (2018) Arslan Necmi, Yilmaz Ahmet, Firat Ugur, Tanriverdi Mehmet Halis. Analysis of cancer cases from Dicle University Hospital; ten years’ experience Analysis of cancer cases // JOURNAL OF CLINICAL AND ANALYTICAL MEDICINE. 2018. 9, 2. 102–106.
- Barata et al. (2012) Barata Catarina, Marques Jorge S, Rozeira Jorge. A system for the detection of pigment network in dermoscopy images using directional filters // IEEE transactions on biomedical engineering. 2012. 59, 10. 2744–2754.
- Barata et al. (2014) Barata Catarina, Ruela Margarida, Mendonça Teresa, Marques Jorge S. A bag-of-features approach for the classification of melanomas in dermoscopy images: The role of color and texture descriptors // Computer vision techniques for the diagnosis of skin cancer. 2014. 49–69.
- Behnke (2003) Behnke Sven. Hierarchical neural networks for image interpretation. 2766. 2003.
- Beller et al. (2005) Beller Michael, Stotzka Rainer, Müller Tim Oliver, Gemmeke Hartmut. An example-based system to support the segmentation of stellate lesions // Bildverarbeitung für die Medizin 2005. 2005. 475–479.
- Bengio et al. (2013) Bengio Yoshua, Courville Aaron, Vincent Pascal. Representation learning: A review and new perspectives // IEEE transactions on pattern analysis and machine intelligence. 2013. 35, 8. 1798–1828.
- Borkowski et al. (2019) Borkowski Andrew A., Bui Marilyn M., Thomas L. Brannon, Wilson Catherine P., DeLand Lauren A., Mastorides Stephen M. Lung and Colon Cancer Histopathological Image Dataset (LC25000). 2019.
- Bovik et al. (1990) Bovik Alan C., Clark Marianna, Geisler Wilson S. Multichannel texture analysis using localized spatial filters // IEEE transactions on pattern analysis and machine intelligence. 1990. 12, 1. 55–73.
- Brake te et al. (2000) Brake Guido M te, Karssemeijer Nico, Hendriks Jan HCL. An automatic method to discriminate malignant masses from normal tissue in digital mammograms1 // Physics in Medicine & Biology. 2000. 45, 10. 2843.
- Bray et al. (2018) Bray Freddie, Ferlay Jacques, Soerjomataram Isabelle, Siegel Rebecca L, Torre Lindsey A, Jemal Ahmedin. Global cancer statistics 2018: GLOBOCAN estimates of incidence and mortality worldwide for 36 cancers in 185 countries // CA: a cancer journal for clinicians. 2018. 68, 6. 394–424.
- Bukhari et al. (2020) Bukhari Syed Usama Khalid, Asmara Syed, Bokhari Syed Khuzaima Arsalan, Hussain Syed Shahzad, Armaghan Syed Umar, SHAH SYED SAJID HUSSAIN. The Histological Diagnosis of Colonic Adenocarcinoma by Applying Partial Self Supervised Learning // medRxiv. 2020.
- Coudray et al. (2018) Coudray Nicolas, Ocampo Paolo Santiago, Sakellaropoulos Theodore, Narula Navneet, Snuderl Matija, Fenyö David, Moreira Andre L, Razavian Narges, Tsirigos Aristotelis. Classification and mutation prediction from non–small cell lung cancer histopathology images using deep learning // Nature medicine. 2018. 24, 10. 1559–1567.
- Doi (2007) Doi Kunio. Computer-aided diagnosis in medical imaging: historical review, current status and future potential // Computerized medical imaging and graphics. 2007. 31, 4-5. 198–211.
- Eltonsy et al. (2007) Eltonsy Nevine H, Tourassi Georgia D, Elmaghraby Adel S. A concentric morphology model for the detection of masses in mammography // IEEE transactions on medical imaging. 2007. 26, 6. 880–889.
- Fogel, Sagi (1989) Fogel Itzhak, Sagi Dov. Gabor filters as texture discriminator // Biological cybernetics. 1989. 61, 2. 103–113.
- Gurcan et al. (2009) Gurcan Metin N, Boucheron Laura E, Can Ali, Madabhushi Anant, Rajpoot Nasir M, Yener Bulent. Histopathological image analysis: A review // IEEE reviews in biomedical engineering. 2009. 2. 147–171.
- Han et al. (2015) Han Fangfang, Wang Huafeng, Zhang Guopeng, Han Hao, Song Bowen, Li Lihong, Moore William, Lu Hongbing, Zhao Hong, Liang Zhengrong. Texture feature analysis for computer-aided diagnosis on pulmonary nodules // Journal of digital imaging. 2015. 28, 1. 99–115.
- Hawkins et al. (2014) Hawkins Samuel H, Korecki John N, Balagurunathan Yoganand, Gu Yuhua, Kumar Virendra, Basu Satrajit, Hall Lawrence O, Goldgof Dmitry B, Gatenby Robert A, Gillies Robert J. Predicting outcomes of nonsmall cell lung cancer using CT image features // IEEE access. 2014. 2. 1418–1426.
- Kermany et al. (2018) Kermany Daniel S, Goldbaum Michael, Cai Wenjia, Valentim Carolina CS, Liang Huiying, Baxter Sally L, McKeown Alex, Yang Ge, Wu Xiaokang, Yan Fangbing, others . Identifying medical diagnoses and treatable diseases by image-based deep learning // Cell. 2018. 172, 5. 1122–1131.
- Krizhevsky et al. (2012) Krizhevsky Alex, Sutskever Ilya, Hinton Geoffrey E. Imagenet classification with deep convolutional neural networks // Advances in neural information processing systems. 2012. 1097–1105.
- Lakshmanaprabu et al. (2019) Lakshmanaprabu SK, Mohanty Sachi Nandan, Shankar K, Arunkumar N, Ramirez Gustavo. Optimal deep learning model for classification of lung cancer on CT images // Future Generation Computer Systems. 2019. 92. 374–382.
- LeCun et al. (1995) LeCun Yann, Bengio Yoshua, others . Convolutional networks for images, speech, and time series // The handbook of brain theory and neural networks. 1995. 3361, 10. 1995.
- Lee et al. (2017) Lee June-Goo, Jun Sanghoon, Cho Young-Won, Lee Hyunna, Kim Guk Bae, Seo Joon Beom, Kim Namkug. Deep learning in medical imaging: general overview // Korean journal of radiology. 2017. 18, 4. 570–584.
- Meier et al. (2013) Meier Raphael, Bauer Stefan, Slotboom Johannes, Wiest Roland, Reyes Mauricio. A hybrid model for multimodal brain tumor segmentation // Multimodal Brain Tumor Segmentation. 2013. 31. 31–37.
- Munir et al. (2019) Munir Khushboo, Elahi Hassan, Ayub Afsheen, Frezza Fabrizio, Rizzi Antonello. Cancer diagnosis using deep learning: a bibliographic review // Cancers. 2019. 11, 9. 1235.
- Rubin et al. (2008) Rubin Raphael, Strayer David S, Rubin Emanuel, others . Rubin’s pathology: clinicopathologic foundations of medicine. 2008.
- Sadeghi et al. (2013) Sadeghi Maryam, Lee Tim K, McLean David, Lui Harvey, Atkins M Stella. Detection and analysis of irregular streaks in dermoscopic images of skin lesions // IEEE transactions on medical imaging. 2013. 32, 5. 849–861.
- Scherer et al. (2010) Scherer Dominik, Müller Andreas, Behnke Sven. Evaluation of pooling operations in convolutional architectures for object recognition // International conference on artificial neural networks. 2010. 92–101.
- Shen et al. (2017) Shen Dinggang, Wu Guorong, Suk Heung-Il. Deep learning in medical image analysis // Annual review of biomedical engineering. 2017. 19. 221–248.
- Sirinukunwattana et al. (2016) Sirinukunwattana Korsuk, Raza Shan E Ahmed, Tsang Yee-Wah, Snead David RJ, Cree Ian A, Rajpoot Nasir M. Locality sensitive deep learning for detection and classification of nuclei in routine colon cancer histology images // IEEE transactions on medical imaging. 2016. 35, 5. 1196–1206.
- Spanhol et al. (2016) Spanhol Fabio Alexandre, Oliveira Luiz S, Petitjean Caroline, Heutte Laurent. Breast cancer histopathological image classification using convolutional neural networks // 2016 international joint conference on neural networks (IJCNN). 2016. 2560–2567.
- Srivastava et al. (2014) Srivastava Nitish, Hinton Geoffrey, Krizhevsky Alex, Sutskever Ilya, Salakhutdinov Ruslan. Dropout: a simple way to prevent neural networks from overfitting // The journal of machine learning research. 2014. 15, 1. 1929–1958.
- Suzuki (2017) Suzuki Kenji. Overview of deep learning in medical imaging // Radiological physics and technology. 2017. 10, 3. 257–273.
- Szegedy et al. (2016) Szegedy Christian, Vanhoucke Vincent, Ioffe Sergey, Shlens Jon, Wojna Zbigniew. Rethinking the inception architecture for computer vision // Proceedings of the IEEE conference on computer vision and pattern recognition. 2016. 2818–2826.
- Tieleman, Hinton (2012) Tieleman T., Hinton G. Lecture 6.5—RmsProp: Divide the gradient by a running average of its recent magnitude. 2012.
- Wei et al. (2005) Wei Jun, Sahiner Berkman, Hadjiiski Lubomir M, Chan Heang-Ping, Petrick Nicholas, Helvie Mark A, Roubidoux Marilyn A, Ge Jun, Zhou Chuan. Computer-aided detection of breast masses on full field digital mammograms // Medical physics. 2005. 32, 9. 2827–2838.
- Yates (2008) Yates Daniel. The practice of statistics : TI-83/84/89 graphing calculator enhanced. New York: W.H. Freeman, 2008.
- Yin et al. (1994) Yin Fang-Fang, Giger Maryellen L, Doi Kunio, Vyborny Carl J, Schmidt Robert A. Computerized detection of masses in digital mammograms: Automated alignment of breast images and its effect on bilateral-subtraction technique // Medical Physics. 1994. 21, 3. 445–452.
- Zeiler, Fergus (2014) Zeiler Matthew D., Fergus Rob. Visualizing and Understanding Convolutional Networks // Lecture Notes in Computer Science. 2014. 818–833.
- Zikic et al. (2012) Zikic Darko, Glocker Ben, Konukoglu Ender, Criminisi Antonio, Demiralp Cagatay, Shotton Jamie, Thomas Owen M, Das Tilak, Jena Raj, Price Stephen J. Decision forests for tissue-specific segmentation of high-grade gliomas in multi-channel MR // International Conference on Medical Image Computing and Computer-Assisted Intervention. 2012. 369–376.