\ul
Semi-permeability of graphene nanodrums in sucrose solution
Abstract
Semi-permeable membranes are important elements in water purification and energy generation applications, for which the atomic thickness and strength of graphene can enhance efficiency and permeation rate while maintaining good selectivity. Here, we show that an osmotic pressure difference forms across a suspended graphene membrane as a response to a sucrose concentration difference, providing evidence for its semi-permeability. This osmotic pressure difference is detected via the deflection of the graphene membrane that is measured by atomic force microscopy. Using this technique, the time dependence of this deflection allows us to measure the water permeation rate of a single 3.4 m diameter graphene membrane. Its value is close to the expected value of a single nanopore in graphene. The method thus allows one to experimentally study the semi-permeability of graphene membranes at the microscale when the leakage rate is miniscule. It can therefore find use in the development of graphene membranes for filtration, and can enable sensors that measure the concentration and composition of solutions.
I Introduction
Semi-permeable membranes are of essential for filtration and separation in the chemical, food and pharmaceutical industry Basile and Nunes (2011). Membrane technology plays a growing role in the transition to a sustainable society, for example in energy storage applications like fuel cells and batteries Che et al. (1998); Tan et al. (2020), in energy generation in osmotic power plants Logan and Elimelech (2012) and in water purification Shannon et al. (2008). Recent developments in nanotechnology allow for fabrication of sub-nanometer pores to improve the selectivity of semi-permeable membranes, enabling new applications Epsztein et al. (2020). A small thickness is beneficial for separation membranes, because it allows high flow rates at small power consumption Cheryan (1998). Therefore graphene, consisting of a single layer of carbon atoms bonded in a hexagonal lattice Geim and Novoselov (2007), is a promising candidate for future semi-permeable membranes with ultimate performance. Besides its small thickness, also the chemical stability Eftekhari and Garcia (2017) and mechanical strength of graphene Lee et al. (2008); Zandiatashbar et al. (2014); Wang et al. (2017) are advantageous. These properties have attracted considerable attention for studies into graphene-based water purification O’Hern et al. (2012); Surwade et al. (2015); O’Hern et al. (2015); Cohen-Tanugi and Grossman (2012); Humplik et al. (2011); Cohen-Tanugi and Grossman (2015); Rollings et al. (2016); Suk and Aluru (2014); Cohen-Tanugi and Grossman (2014); Suk and Aluru (2010); Boretti et al. (2018), gas separation Boutilier et al. (2014); Jiang et al. (2009); Kim et al. (2013); Celebi et al. (2014) and gas sensing Koenig et al. (2012); Dolleman et al. (2017a); Rosłoń et al. (2020). Water permeation studies on graphene often require macroscopic setups to apply an hydraulic pressure and measure the permeation rate. Therefore, the permeation occurs over a large area, making it difficult to verify molecular dynamics simulations performed at the nanoscale. Moreover, a single defect in a large membrane can dominate the permeation rate and thus significantly impact the total membrane performance. To further understand water permeability of graphene at the single pore level, it is therefore of interest to develop experimental techniques to measure the permeability on a microscopic level.
Here, we demonstrate the semi-permeability of single graphene nanodrums, which are graphene membranes suspended over circular cavities in a substrate, with an area of 9 m2. The semi-permeability is demonstrated by monitoring their deflection using a liquid atomic force microscopy (AFM) technique. It is observed that suspended graphene membranes sealing a cavity are deflected when a sucrose concentration difference is applied across the membrane. This deflection is attributed to the osmotic pressure generated on the membrane, which pushes the water out of the cavity and reduces its volume. The time-dependence of this deflection allows determination of the water permeation rate of the graphene drum and this continues until an equilibrium between the osmotic force and membrane force is obtained. Thus facilitating the water permeability of graphene to be studied at microscopic scales where the volumetric flux is miniscule.
II Experimental methods
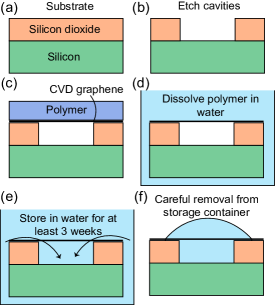
The steps taken for sample preparation are shown in Fig. 1. Fabrication starts from a silicon chip with a layer of 285 nm of thermally grown silicon dioxide (Fig. 1a). Circular cavities of 3.4 m diameter are patterned using electron beam lithography and etched to a depth of 285 nm in the oxide layer using reactive ion etching (Fig. 1b). A sheet of single-layer graphene grown by chemical vapor deposition (CVD) is transferred on top of the chip and suspended over the cavities using a water dissolvable transfer polymer (Fig. 1c). The transfer polymer is dissolved in water, after which the sample is kept wet during the rest of the fabrication and experiment (Fig. 1d). To allow water to permeate into the cavities, and to let the gas in the cavity permeate out and dissolve in the water, the sample is stored in a container with deionized (DI) water for more than three weeks before the experiment is started (Fig. 1e). By studying the samples in a liquid cell AFM, this sample preparation results in cavities filled with water in two out of the four samples; on the other two samples only broken drums are found.
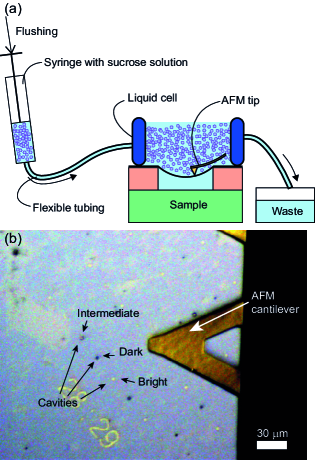
The deflection of the membranes is studied using atomic force microscopy in a liquid cell shown in Fig. 2a. Since the surface tension of water may break the graphene nanodrum, the cavities have to remain submerged. Therefore, the sample is removed from the container in such a way that a droplet of water remains on the center part of the chip (Fig. 1f). The sample is then moved to an AFM with a flexible silicon-rubber liquid cell. The 19 by 19 mm2 chip forms the bottom of the liquid cell, while the rubber encapsulation of the liquid cell ensures that the chip remains fully immersed in water during the experiment. AFM imaging is performed on a Bruker Dimension Icon AFM system operating in tapping mode. The cantilevers used are Bruker ScanAsyst Fluid, with a nominal stiffness of 0.7 N/m. The AFM scans over the surface until a suspended graphene drum is found that fully covers the cavity. From the optical image in the AFM we observe that the cavities have generally three different optical contrasts (Fig. 2b); some appear bright, others dark and some show intermediate contrast. All the drums used for the experiment show an intermediate optical contrast. From results of initial AFM tests it is hypothesized that the brightest and darkest cavities correspond to cavities with broken graphene and air-filled cavities sealed with graphene, respectively, but this was not studied in more detail.
The liquid cell has two flexible tubes connected to it (Fig. 2a), which can be used to flush the cell with a solution. A syringe with a sucrose solution of a well-known concentration is connected to one of the tubes and the system is flushed with 2 mL of the solution, which is a volume much larger than the volume of the liquid cell and the tubing (in the order of 100 L), such that the concentration outside the cavity is equal to the concentration in the syringe. Since the concentration in the cavity remains zero, a well-known concentration difference is applied across the membrane. By flushing the liquid cell slowly and carefully to minimize mechanical disturbances, the AFM can remain in contact with the substrate and continue scanning without having to retract the AFM tip from the surface. After flushing, the AFM continues to scan the drum in order to measure the height of the membrane as a function of time.
III Results
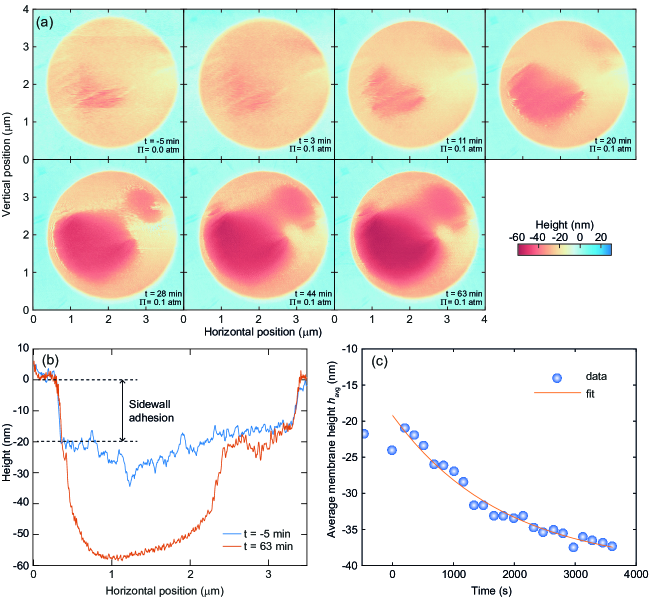
Figure 3a shows the height map of a 3.4-micron diameter drum during the experiment. At minutes the chip has been in DI-water for three weeks (first panel in Fig. 3a). Flushing with a 1.6 g/L sucrose solution ( atm) starts at min and ends at min. During the flushing the AFM tip remains in contact with the substrate, but the scans taken during this process are omitted due to the large mechanical disturbance. The first scan after the flush ends at mins (second panel in Fig. 3a). In the first two panels of Fig. 3a it is shown that the difference between the scans before (t=-5 min) and after (t=3 min) admitting sucrose is small. However, as time progresses the membrane steadily deflects downwards. The presence of red and yellow regions in the last panels in Fig. 3a indicate that the deflection is not uniform, suggesting that the tension distribution in this membrane is not uniform over the membrane area, similar to what was found in other works Davidovikj et al. (2016).
The height maps in Fig. 3a are used to calculate the average deflection of the drum over time as shown in Fig. 3c. All height maps are corrected for tilt using the silicon dioxide substrate next to the drum as a reference, whose height is set to zero. Only the part of the graphene, enclosed by the sidewalls (height < 10 nm in Fig. 3b), is used to determine the average deflection of the suspended drum. Even in the first scan, before flushing the liquid cell, the membrane height is already lower than that of the substrate. This is due to sidewall adhesion at the edge of the drum as can be seen in the horizontal line cuts in Fig. 3b. Due to the sidewall adhesion the membrane has an average height of nm in Fig. 3c at s. As time progresses, the membrane’s average height decreases which will be further analyzed below.
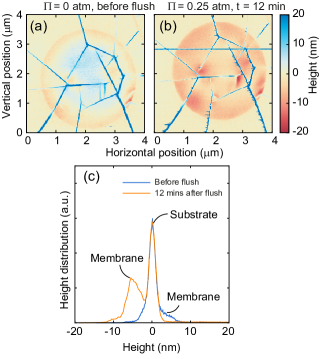
Figure 4 shows the experimental results on a second 3.4 m diameter drum. This drum shows clear wrinkles over the surface of the drum, which remain after flushing. Initially, the center of the membrane is higher than the substrate surface (Fig. 4a), and 12 minutes after flushing with a 4 g/L ( atm) sucrose solution the membrane is deflected downward (Fig. 4b). This can also be deduced from the change in the height distribution in Fig. 4c. The downwards deflection can be attributed to the osmotic pressure, consistent with the observations on the first drum in Fig. 3. Time-dependent deflection was not studied in this drum, because the AFM lost contact with the substrate during the flushing. Figure 4b shows the first scan after re-approaching the surface. No significant change in deflection was detected in subsequent scans after min, indicating that this drum permeates significantly faster than the drum in Fig. 3 and already reached equilibrium between the osmotic and membrane forces during the first scan after flushing.
IV Model for the time-dependent deflection
In this section a model is derived to describe the dynamics of the membrane under osmotic pressure. We consider the system to initially be in an equilibrium state, since it is kept in the water for a long time. Then, after introducing the sucrose solution, an osmotic pressure difference develops between the cavity and the environment. As an estimate of the upper limit, we consider the most extreme case where the graphene-sealed cavity is impermeable to the sucrose-particles and permeable for the water particles. In this case, the concentration of sucrose inside the cavity remains zero and the osmotic pressure difference is given by van ‘t Hoff’s law Kramer and Myers (2012):
| (1) |
where is Boltzmann constant, is temperature and the concentration of sucrose in the liquid cell environment.
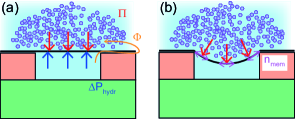
Figure 5a schematically shows the forces on the membrane immediately after the environment is flushed with a sucrose solution. The solute (sucrose molecules) generate an osmotic pressure on the membrane pushing it downwards. However, the water in the cavity is incompressible, causing a compressive hydraulic pressure in the cavity equal to the osmotic pressure. Since the fluid in the environment is at ambient pressure, there is a difference in pressure between the water inside the cavity and outside the cavity, where is the pressure resulting from the deflection of the membrane. This hydraulic pressure difference drives water molecules out of the cavity through the pores toward the environment. Using Darcy’s law we can express the volumetric flux of water as:
| (2) |
where is the water permeation rate per unit pressure difference, in units of m3 Pa-1 s-1. This flux reduces the volume of the cavity, causing the membrane to deflect downwards thereby tensioning the membrane, resulting in a pressure exerted by the membrane Bunch et al. (2008):
| (3) |
where is the pre-tension in the membrane, the Young’s modulus, the membrane thickness, Poisson’s ratio and is the radius of the drum. is the average deflection of the drum, defined as: , where the average height of the drum from the AFM measurement and is the average height of the drum in equilibrium when . For simplicity, we assume the deflections of the membrane are sufficiently small to ignore the term proportional to in Eq. 3. Using Eq. 2, the time-dependence of the membrane’s average deflection can be obtained by expressing the rate of change in volume of the cavity as: , which results in:
| (4) |
Solving this differential equation yields the following expression of the time-dependent deflection:
| (5) |
The total deflection (, where is the membrane’s final position) the membrane has after reaching thermodynamic equilibrium,
| (6) |
is governed by the tension in the membrane, but does not depend on the permeation rate, since it is obtained when . It is observed from Eq. 6 that a low pre-tension and large radius naturally leads to a larger deflection of the membrane. The characteristic time constant of the time-dependent deflection is governed by both the water permeation rate of and the tension in the membrane:
| (7) |
This shows that a small tension leads to a large response time of the system, as more volume needs to be displaced in order to reach thermodynamic equilibrium. As expected, a large permeation rate will lead to a shorter . Interestingly, for a constant permeation rate , the timeconstant depends strongly on the radius of the membrane . Finally, for the extraction of the permeation rate we note that is independent of according to Eq. 7, and is therefore independent of the sucrose concentration used during the experiment.
V Extracting tension and permeation rate
By fitting the model in Eq. 5 to the experimental data in Fig. 3c we extract the pre-tension and the permeation rate . From the measured total deflection nm we find a pretension N/m. This value is lower than the range found on similar CVD graphene drums based on estimates from their thermal time constant Dolleman et al. (2020a, b), but is reasonable compared to other works Lee et al. (2008); López-Polín et al. (2015). Using this value of the pre-tension and deflection, and values for the elastic properties of graphene in literature Lee et al. (2008), the third order term in Eq. 3 contributes approximately 10% to the total membrane pressure in thermodynamic equilibrium. This justifies ignoring the third order term in our analysis.
The time constant extracted from the fit in Fig. 3c is s. Using Eq. 7 and the pretension extracted above the water permeation rate is m3 Pa-1 s-1. In other works, the permeation rate of a single pore in graphene m3 Pa-1 s-1 is estimated from experiments Surwade et al. (2015), while theory Cohen-Tanugi and Grossman (2014) predicts a value of m3 Pa-1 s-1. Since our measured value of the permeation rate is similar to the expected value of a single nanopore, we conclude that the drum in Fig. 3 has a low defect density. Moreover, it is likely that the graphene-silicon dioxide interface is an important pathway for the diffusion of water molecules, similar to the case of gas permeation through graphene nanodrums Lee et al. (2019); Manzanares-Negro et al. (2018). The permeation rate per unit area m Pa-1 s-1, is 7 orders of magnitude lower than expected for nanoporous graphene Cohen-Tanugi and Grossman (2012); Boretti et al. (2018), supporting the notion of the low defect density in the suspended graphene.
For the second drum in Fig. 4, we estimate from Fig. 4(c) an average deflection of approximately 8 nm, resulting in N/m. However, the wrinkles on the membrane are as high as 20 nm, and this additional moment of inertia may cause them to acts as beams that contribute significantly to the overall stiffness of the membrane. Since no significant movement of the membrane is observed after the initial scan at 12 mins, we conclude that this drum was in full thermodynamic equilibrium within 12 minutes. Therefore, the time dependent permation could not be studied in the same detail as the first drum in Fig. 3. The downward deflection of the drum, however, does indicate that it is semi-permeable to the sucrose.
VI Discussion
Via AFM measurements we have presented evidence that a sucrose concentration gradient across a graphene membrane can cause it to deflect. This effect is attributed to the semipermeability of the graphene membrane for water and sucrose molecules, which causes an osmotic pressure to develop across it. From the total deflection the pre-tension of the membrane can be extracted, while the time-dependence of the deflection is used to extract the water permeation rate of a graphene drum. The value of the permeation rate is close to the value expected for a single pore in the graphene sheet, suggesting the defect density in the suspended CVD graphene is low. Different permeation mechanisms can cause water molecules, that have a kinetic diameter of 0.2 nm, to permeate into the cavity. The first possibility is through the small intrinsic defects in the suspended CVD-graphene sheet, the second is through the wrinkles of the graphene on top of the silicon dioxide (that might act as a lateral channel) and the third is diffusion along the SiO2-graphene interface. Dissolved sucrose molecules have a molecular diameter of 0.9 nm,Price et al. (2016) significantly larger than that of water molecules (0.26 nm), causing it to diffuse at much slower rates (or not diffuse at all) through these permeation pathways. As a consequence, it is expected that the graphene is more permeable to water molecules than to sucrose molecules.
We note that if the graphene would be permeable for the sucrose, it would be expected that after the initial ’fast’ downward deflection of the membrane, it would be followed by a slower upward deflection of the membrane until the sucrose concentration on both sides of the membrane would equilibrate and the membrane would return to its initial position Dolleman et al. (2017a). Since no such equilibration or upward deflection was observed within the 60 minutes of measurement, we can conclude that our assumption that the graphene drum is impermeable for sucrose molecules is correct within the experimentally relevant times.
In future work, more information on the permeation mechanism can be revealed by measuring the time constant as a function of drum diameter or membrane thickness, similar to approaches taken to measure the gas permeability of graphene Bunch et al. (2008). Furthermore, sealing the graphene at the edges will remove the permeation pathways through the silicon dioxide-graphene interface and the wrinkles, allowing permeation to occur only through defects in the graphene membrane Lee et al. (2019). Since our measured value of the permeation rate is close to the expected value of a single nanopore in graphene, such a sealed nanodrum might be suitable to study the (semi-)permeability of individual nanopores. While the AFM method is suitable to study drums with very low permeation rates, introducing many pores or defects in the suspended membrane will significantly increase the permeation rate and therefore decrease . This means that faster detection techniques may be more suitable to measure the time-dependent deflection of nanoporous graphene, which could be achieved by high-speed AFM Katan and Dekker (2011); or optical techniques such as colorimetry Cartamil-Bueno et al. (2016) or laser interferometry Dolleman et al. (2017b). The main advantage of using AFM is the possibility to image the inhomogeneities due to wrinkles and nonuniform tension and to study their impact on the deflection profile in detail, which is difficult to achieve with optical techniques.
The observed deflection of graphene by osmotic pressures is interesting for applications as an osmotic pressure sensor that detects the concentration of solutes, since the deflection of the membrane is a function of the concentration (Eq. 6). Graphene-based osmotic pressure sensors use less area than sensors that have been demonstrated using MEMS technology Ch and Paily (2015). Moreover, graphene has excellent chemical stability Eftekhari and Garcia (2017), large mechanical strength and flexibility; and the small membrane areas achievable with these systems allow for the measurement of extremely low permeation rates while maintaining relatively short response times . Reliable fabrication of suspended graphene membranes submerged in water, with tight tolerances on wrinkles and defect densities, is the main challenge for further research in this direction.
VII Conclusion
In conclusion, we present evidence that graphene membranes that seal a cavity are deflected by osmotic pressure induced by a sucrose solution. This deflection is characterized by atomic force microscopy in water, demonstrating the feasibility of mechanically characterizing suspended graphene in a liquid environment. When the concentration of sucrose in the surroundings is increased, the membrane deflects downward with an exponential time-dependence which can be explained by our theoretical model. This allows the extraction of the water permeation rate of a single 3.4 m diameter drum, which is found to be m3 Pa-1 s-1. Since this is close to the expected value of the permeation rate of a single nanopore in graphene, this suggests a low defect density of the suspended graphene sheet. The work opens avenues for studying the semipermeability of graphene membranes via the effect of osmotic pressure on its deflection, and can thus contribute to realizing graphene membrane technology for separation, sensing, energy storage and energy generation applications.
Acknowledgements
The authors thank Applied Nanolayers BV for the supply and transfer of single-layer CVD graphene. This work is part of the research programme Integrated Graphene Pressure Sensors (IGPS) with project number 13307 which is financed by the Netherlands Organisation for Scientific Research (NWO). The research leading to these results also received funding from the European Union’s Horizon 2020 research and innovation programme under grant agreement No 785219 and 881603.
References
- Basile and Nunes (2011) Angelo Basile and Suzana Pereira Nunes, Advanced membrane science and technology for sustainable energy and environmental applications (Elsevier, 2011).
- Che et al. (1998) Guangli Che, Brinda B Lakshmi, Ellen R Fisher, and Charles R Martin, “Carbon nanotubule membranes for electrochemical energy storage and production,” Nature 393, 346–349 (1998).
- Tan et al. (2020) Rui Tan, Anqi Wang, Richard Malpass-Evans, Rhodri Williams, Evan Wenbo Zhao, Tao Liu, Chunchun Ye, Xiaoqun Zhou, Barbara Primera Darwich, Zhiyu Fan, Lukas Turcani, Edward Jackson, Linjiang Chen, Samantha Y Chong, Tao Li, Kim E Jelfs, Andrew I Cooper, Nigel P Brandon, Clare P Grey, Neil B McKeown, and Qilei Song, “Hydrophilic microporous membranes for selective ion separation and flow-battery energy storage,” Nature Materials 19, 195–202 (2020).
- Logan and Elimelech (2012) Bruce E Logan and Menachem Elimelech, “Membrane-based processes for sustainable power generation using water,” Nature 488, 313–319 (2012).
- Shannon et al. (2008) Mark A. Shannon, Paul W. Bohn, Menachem Elimelech, John G. Georgiadis, Benito J. Marinas, and Anne M. Mayes, “Science and technology for water purification in the coming decades,” Nature 452, 301–310 (2008).
- Epsztein et al. (2020) Razi Epsztein, Ryan M DuChanois, Cody L Ritt, Aleksandr Noy, and Menachem Elimelech, “Towards single-species selectivity of membranes with subnanometre pores,” Nature Nanotechnology , 1–11 (2020).
- Cheryan (1998) Munir Cheryan, Ultrafiltration and microfiltration handbook (CRC press, 1998).
- Geim and Novoselov (2007) Andre K Geim and Konstantin S Novoselov, “The rise of graphene,” Nature Materials 6, 183 (2007).
- Eftekhari and Garcia (2017) Ali Eftekhari and Hermenegildo Garcia, “The necessity of structural irregularities for the chemical applications of graphene,” Materials Today Chemistry 4, 1 – 16 (2017).
- Lee et al. (2008) Changgu Lee, Xiaoding Wei, Jeffrey W Kysar, and James Hone, “Measurement of the elastic properties and intrinsic strength of monolayer graphene,” Science 321, 385–388 (2008).
- Zandiatashbar et al. (2014) Ardavan Zandiatashbar, Gwan-Hyoung Lee, Sung Joo An, Sunwoo Lee, Nithin Mathew, Mauricio Terrones, Takuya Hayashi, Catalin R Picu, James Hone, and Nikhil Koratkar, “Effect of defects on the intrinsic strength and stiffness of graphene,” Nature Communications 5, 3186 (2014).
- Wang et al. (2017) Luda Wang, Christopher M Williams, Michael S H Boutilier, Piran R Kidambi, and Rohit Karnik, “Single-layer graphene membranes withstand ultrahigh applied pressure,” Nano Letters 17, 3081–3088 (2017).
- O’Hern et al. (2012) Sean C O’Hern, Cameron A Stewart, Michael SH Boutilier, Juan-Carlos Idrobo, Sreekar Bhaviripudi, Sarit K Das, Jing Kong, Tahar Laoui, Muataz Atieh, and Rohit Karnik, “Selective molecular transport through intrinsic defects in a single layer of CVD graphene,” ACS Nano 6, 10130–10138 (2012).
- Surwade et al. (2015) Sumedh P Surwade, Sergei N Smirnov, Ivan V Vlassiouk, Raymond R Unocic, Gabriel M Veith, Sheng Dai, and Shannon M Mahurin, “Water desalination using nanoporous single-layer graphene,” Nature Nanotechnology 10, 459–464 (2015).
- O’Hern et al. (2015) Sean C O’Hern, Doojoon Jang, Suman Bose, Juan-Carlos Idrobo, Yi Song, Tahar Laoui, Jing Kong, and Rohit Karnik, “Nanofiltration across defect-sealed nanoporous monolayer graphene,” Nano Letters 15, 3254–3260 (2015).
- Cohen-Tanugi and Grossman (2012) David Cohen-Tanugi and Jeffrey C Grossman, “Water desalination across nanoporous graphene,” Nano Letters 12, 3602–3608 (2012).
- Humplik et al. (2011) Tom Humplik, J Lee, S C O’hern, BA Fellman, MA Baig, SF Hassan, M A Atieh, F Rahman, T Laoui, R Karnik, and E N Wang, “Nanostructured materials for water desalination,” Nanotechnology 22, 292001 (2011).
- Cohen-Tanugi and Grossman (2015) David Cohen-Tanugi and Jeffrey C Grossman, “Nanoporous graphene as a reverse osmosis membrane: recent insights from theory and simulation,” Desalination 366, 59–70 (2015).
- Rollings et al. (2016) Ryan C Rollings, Aaron T Kuan, and Jene A Golovchenko, “Ion selectivity of graphene nanopores,” Nature Communications 7, 11408 (2016).
- Suk and Aluru (2014) Myung E Suk and N R Aluru, “Ion transport in sub-5-nm graphene nanopores,” The Journal of Chemical Physics 140, 084707 (2014).
- Cohen-Tanugi and Grossman (2014) David Cohen-Tanugi and Jeffrey C Grossman, “Water permeability of nanoporous graphene at realistic pressures for reverse osmosis desalination,” The Journal of Chemical Physics 141, 074704 (2014).
- Suk and Aluru (2010) Myung E Suk and N R Aluru, “Water transport through ultrathin graphene,” The Journal of Physical Chemistry Letters 1, 1590–1594 (2010).
- Boretti et al. (2018) Albert Boretti, Sarim Al-Zubaidy, Miroslava Vaclavikova, Mohammed Al-Abri, Stefania Castelletto, and Sergey Mikhalovsky, “Outlook for graphene-based desalination membranes,” npj Clean Water 1, 1–11 (2018).
- Boutilier et al. (2014) Michael SH Boutilier, Chengzhen Sun, Sean C O’Hern, Harold Au, Nicolas G Hadjiconstantinou, and Rohit Karnik, “Implications of permeation through intrinsic defects in graphene on the design of defect-tolerant membranes for gas separation,” ACS Nano 8, 841–849 (2014).
- Jiang et al. (2009) De-en Jiang, Valentino R Cooper, and Sheng Dai, “Porous graphene as the ultimate membrane for gas separation,” Nano Letters 9, 4019–4024 (2009).
- Kim et al. (2013) Hyo Won Kim, Hee Wook Yoon, Seon-Mi Yoon, Byung Min Yoo, Byung Kook Ahn, Young Hoon Cho, Hye Jin Shin, Hoichang Yang, Ungyu Paik, Soongeun Kwon, Jae-Young Choi, and Ho Bum Park, “Selective gas transport through few-layered graphene and graphene oxide membranes,” Science 342, 91–95 (2013).
- Celebi et al. (2014) Kemal Celebi, Jakob Buchheim, Roman M Wyss, Amirhossein Droudian, Patrick Gasser, Ivan Shorubalko, Jeong-Il Kye, Changho Lee, and Hyung Gyu Park, “Ultimate permeation across atomically thin porous graphene,” Science 344, 289–292 (2014).
- Koenig et al. (2012) Steven P Koenig, Luda Wang, John Pellegrino, and J Scott Bunch, “Selective molecular sieving through porous graphene,” Nature Nanotechnology 7, 728 (2012).
- Dolleman et al. (2017a) Robin J Dolleman, Santiago J Cartamil-Bueno, Herre S J van der Zant, and Peter G Steeneken, “Graphene gas osmometers,” 2D Materials 4, 011002 (2017a).
- Rosłoń et al. (2020) Irek E Rosłoń, Robin J Dolleman, Hugo Licona, Martin Lee, Makars Šiškins, Henning Lebius, Lukas Madauß, Marika Schleberger, Farbod Alijani, Herre S J van der Zant, and Peter G Steeneken, “Graphene effusion-based gas sensor,” arXiv preprint arXiv:2001.09509 (2020).
- Davidovikj et al. (2016) Dejan Davidovikj, Jesse J Slim, Santiago J Cartamil-Bueno, Herre S J van der Zant, Peter G Steeneken, and Warner J Venstra, “Visualizing the motion of graphene nanodrums,” Nano Letters 16, 2768–2773 (2016).
- Kramer and Myers (2012) Eric M Kramer and David R Myers, “Five popular misconceptions about osmosis,” American Journal of Physics 80, 694–699 (2012).
- Bunch et al. (2008) J Scott Bunch, Scott S Verbridge, Jonathan S Alden, Arend M Van Der Zande, Jeevak M Parpia, Harold G Craighead, and Paul L McEuen, “Impermeable atomic membranes from graphene sheets,” Nano Letters 8, 2458–2462 (2008).
- Dolleman et al. (2020a) Robin J Dolleman, Gerard J Verbiest, Yaroslav M Blanter, Herre SJ van der Zant, and Peter G Steeneken, “Nonequilibrium thermodynamics of acoustic phonons in suspended graphene,” Physical Review Research 2, 012058 (2020a).
- Dolleman et al. (2020b) Robin J Dolleman, Yaroslav M Blanter, Herre SJ van der Zant, Peter G Steeneken, and Gerard J Verbiest, “Phonon scattering at kinks in suspended graphene,” Physical Review B 101, 115411 (2020b).
- López-Polín et al. (2015) Guillermo López-Polín, Cristina Gómez-Navarro, Vincenzo Parente, Francisco Guinea, Mikhail I Katsnelson, Francesc Perez-Murano, and Julio Gómez-Herrero, “Increasing the elastic modulus of graphene by controlled defect creation,” Nature Physics 11, 26–31 (2015).
- Lee et al. (2019) Martin Lee, Dejan Davidovikj, Banafsheh Sajadi, Makars Siskins, Farbod Alijani, Herre S J van der Zant, and Peter G Steeneken, “Sealing graphene nanodrums,” Nano Letters 19, 5313–5318 (2019).
- Manzanares-Negro et al. (2018) Y Manzanares-Negro, P Ares, M Jaafar, G López-Polín, and C Gómez-Herrero, “Improved graphene blisters by ultra-high pressure sealing,” arXiv preprint arXiv:1809.03786 (2018).
- Price et al. (2016) Hannah C Price, Johan Mattsson, and Benjamin J Murray, “Sucrose diffusion in aqueous solution,” Physical Chemistry Chemical Physics 18, 19207–19216 (2016).
- Katan and Dekker (2011) Allard J Katan and Cees Dekker, “High-speed AFM reveals the dynamics of single biomolecules at the nanometer scale,” Cell 147, 979–982 (2011).
- Cartamil-Bueno et al. (2016) Santiago J Cartamil-Bueno, Peter G Steeneken, Alba Centeno, Amaia Zurutuza, Herre SJ van der Zant, and Samer Houri, “Colorimetry technique for scalable characterization of suspended graphene,” Nano Letters 16, 6792–6796 (2016).
- Dolleman et al. (2017b) Robin J Dolleman, Dejan Davidovikj, Herre SJ van der Zant, and Peter G Steeneken, “Amplitude calibration of 2D mechanical resonators by nonlinear optical transduction,” Applied Physics Letters 111, 253104 (2017b).
- Ch and Paily (2015) Nagesh Ch and Roy P Paily, “Design of an osmotic pressure sensor for sensing an osmotically active substance,” Journal of Micromechanics and Microengineering 25, 045019 (2015).