Characterizing cryogenic amplifiers with a matched temperature-variable noise source
Abstract
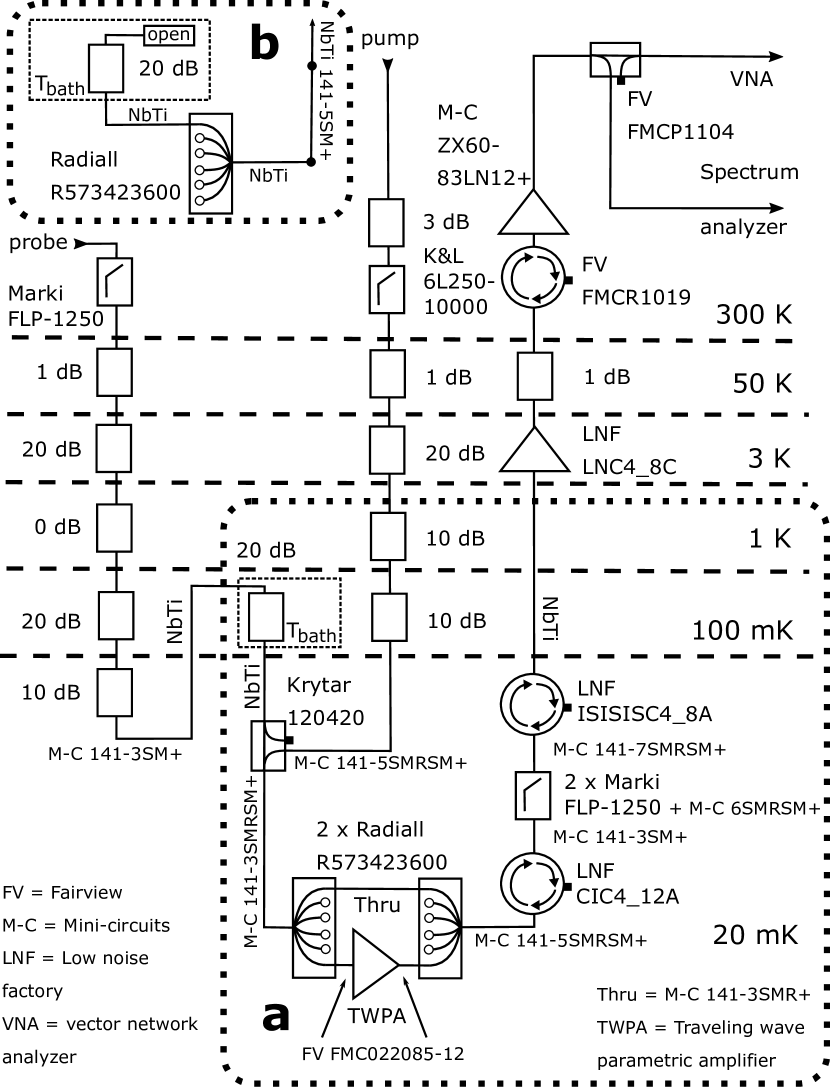
We present a cryogenic microwave noise source with a characteristic impedance of 50 , which can be installed in a coaxial line of a cryostat. The bath temperature of the noise source is continuously variable between 0.1 K and 5 K without causing significant back-action heating on the sample space. As a proof-of-concept experiment, we perform Y-factor measurements of an amplifier cascade that includes a traveling wave parametric amplifier and a commercial high electron mobility transistor amplifier. We observe system noise temperatures as low as mK at 5.7 GHz corresponding to excess photons. The system we present has immediate applications in the validation of solid-state qubit readout lines.
I Introduction
Detection of weak microwave signals in a cryogenic environment is a primary task in the field of quantum technology. Solid-state qubits with transition frequencies in the microwave region operate at millikelvin bath temperatures in order to reduce thermally excited population of a qubit and to reduce noise. In practice, discriminating the state of the qubit relies on observing the qubit-state-dependent frequency shift imposed by the qubit on a coupled readout resonator Blais et al. (2004); Wallraff et al. (2005). The readout protocol of the microwave resonator imposes strict added-noise and gain requirements on the first amplifier in the chain to achieve single shot readout without averaging Krantz et al. (2019). To address this challenge, various ultra-low noise amplifiers have been developed including quantum-limited parametric amplifiers exploiting the non-linearity of Josephson junctions Castellanos-Beltran et al. (2008); Mutus et al. (2013); White et al. (2015); Macklin et al. (2015); Zorin et al. (2017); Planat et al. (2020), and non-linearities in superconducting thin films Vissers et al. (2016); Ranzani et al. (2018); Chaudhuri et al. (2017); Malnou et al. (2021). Further development of dispersive readout requires accurate measurements of quantum-limited amplification chains within dilution refrigerators. Moreover, the study of quantum noise is directly relevant to applications in quantum state control Schoelkopf et al. (2003).
Noise performance of a microwave amplifier can be expressed as a noise temperature, i.e., the noise added to a signal by an amplifier that is equivalent to that of a matched resistor of thermodynamic temperature . A common method for determining the amplifier noise temperature is the hot-cold source method or so-called Y-factor method Mura (1966); Pozar (2012). The procedure places a matched load resistor with a "hot" temperature at the input of an amplifier and the amplified output noise is recorded using a spectrum analyzer in a specified bandwidth. The previous step is repeated using a vastly different "cold" input noise temperature with corresponding amplified noise , and the Y-factor is then defined as the ratio of the output noise powers . Finally, the effective noise temperature of the amplifier is obtained using the Y-factor .
Applying the Y-factor method to an amplifier in a millikelvin environment with a noise temperature in the regime K poses the following technical challenges. First, impedance differences between the hot and cold source signal pathways when operated through a coaxial switch can lead to systematic errors Fernandez (1998). Second, as a practical challenge, cold-loads are not widely available and require users to build custom components Cano, Wadefalk, and Gallego-Puyol (2010); Yeh et al. (2017). In addition, uncertainty of the two temperature points that define can lead to fitting errors especially if the amplifier under test (AUT) has a low noise temperature compared to the cold load, requiring additional systematic correction terms Otegi, Collantes, and Sayed (2005). Furthermore, if the load resistor is poorly thermalized, the calculated noise temperature from the Y-factor measurement will be overestimated Cano, Wadefalk, and Gallego-Puyol (2010). Other noise measurement techniques for low temperatures have been demonstrated including using a 50 tunnel junction as a source of shot noise Su-Wei Chang et al. (2016); Spietz et al. (2003); Spietz, Schoelkopf, and Pari (2006). Alternatively, the power of a microwave tone can be accurately calibrated in a narrow band using the ac Stark shift of a qubit itself, and the signal to noise ratio of the transmitted tone can be measured directly Macklin et al. (2015). In these techniques, system complexity increases, or bandwidth decreases, which motivates manufacturable noise sources for Y-factor characterization of amplifiers with noise temperatures below 1 K.
In this article, we describe a compact noise source — designed with a characteristic impedance of 50 — that can be operated in a temperature range between 0.1 K–-5 K within a cryostat without causing significant back action heating on the base temperature stage. As an application, we implement a typical qubit readout line Krinner et al. (2019) for circuit quantum electrodynamicsBlais et al. (2020) and measure noise temperature of the amplifier cascade. In particular, the cascade includes a traveling wave parametric amplifier (TWPA) Yurke et al. (1996); White et al. (2015); Macklin et al. (2015), a commercially available cryogenic high electron mobility transistor amplifier (HEMT) Schleeh et al. (2012); Gu et al. (2013), and additional room temperature amplification.
II Methods
II.1 Thermal noise source
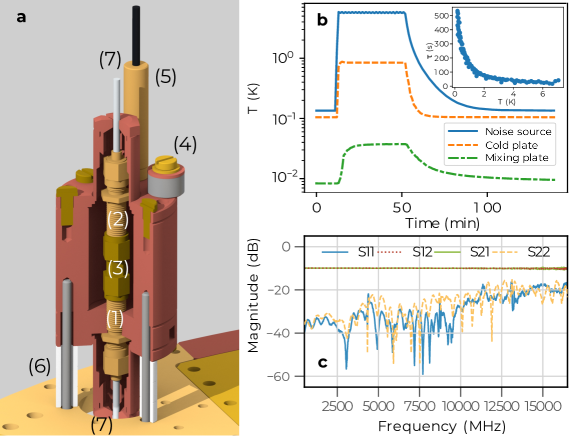
We illustrate the noise source and its characteristics in Fig. 1 and a photograph of its parts is provided in Appendix A. The central elements are the matched resistor networks that we implement using two 10 dB bulkhead copper-cased attenuators with K-2.92mm jack interfaces shown as (1) and (2) in Fig. 1a. The attenuator is realized with an on-chip Ni–Cr thin film resistor network that is clamped within a Cu (C101 alloy Finger and Kerr (2008)) case. The inner contacts of the attenuator are made from gold-plated Be–Cu alloy. The thermalization of the copper-cased attenuator is more efficient than that of a commercial stainless steel counterpart and one of the bulkheads (1) is fastened directly to threads in the copper body of the noise source. The operation principle of the noise source is that the resistive heater bobbin of (4) increases the temperature of the Cu body (with a mass of approximately 0.45 kg) including the inner bulkhead attenuators of (1) and (2) to emit thermal noise into the coaxial line. Temperature monitoring and feedback are implemented using a ruthenium oxide thermometer attached to the body of the noise source in (5). The thermometer is calibrated against a noise thermometer (a magnetic field fluctuation thermometer, from Magnicon GmbH) which was calibrated at Physikalisch-Technische Bundesanstalt against the PLTS-2000 Engert, Heyer, and Fischer (2013); Engert et al. (2016). The source can be operated either by transmitting a microwave probe tone through (1) and (2), or as a single-ended noise source where noise is emitted directly from one of the ports. The source is designed to be mounted to an ISO-KF25 port in a dilution refrigerator flange so that a superconducting semi-rigid coaxial cable can pass through the port opening as shown in Fig. 1a. In the measurements presented in this article, the noise source is mounted to a stage with a base temperature of 100 mK, i.e., the cold-plate stage of a commercial dilution refrigerator cryostat, where the mixing chamber stage below it reaches a temperature of approximately 8 mK.
To limit unwanted heating of the surrounding areas of the cryostat, the three attachment points of (6) are designed as thermal weak links that consist of three M3x50 mm stainless steel screws running through alumina fish-spine beads with an area-to-length ratio of 3.9 mm. At high temperatures of greater than 3 K, conduction through the alumina beads dominates the heat transfer so that the noise source can be cooled quickly during the initial cooldown. However, at lower temperatures, thermal conductance of the alumina beads becomes weak compared to stainless steel screws, and the screws are the thermal weak link between the noise source and flange. For example, if the noise source is at the temperature of 1 K, and the supporting flange is 100 mK, the heat conductivity integrals Pobell (2007) are evaluated as W / cm and W / cm for the stainless steel and alumina beads respectively. Taken together, the total heating power on the mounting flange due to the noise source is 100 W. Based on simple estimations, any residual heating due to radiation is at least three magnitudes lower even if the noise source were at 5 K. Furthermore, connections between the attenuator ports and the other stages of the cryostat are made with thin superconducting NbTi cables to minimize heat transfer through the microwave cabling. The coaxial cables directly connected to the noise source have an NbTi center conductor diameter of 0.2 mm, PTFE dielectric outer diameter of 0.66 mm, and NbTi outer conductor diameter of 0.9 mm. Non-magnetic gold-plated Be–Cu connectors are soldered to the NbTi coaxial cable ends using standard techniques such as those in Ref. 33. The impedance specification for this cable is at 4 K.
We studied the back-action heating of the noise source on its surroundings and display the results in Fig. 1b. In practice, we find that the source can be operated between 0.1 K and 5 K when placed on the cold plate of a dilution refrigerator without significant heating of the lowest temperature stage (mixing chamber plate). Importantly, this provides enough dynamic range in output noise temperature to analyze both near-quantum limited-amplifiers and low noise HEMT amplifiers. In Figure 1b, at a noise source temperature of 5 K the mixing chamber heats up to 30 mK. This unwanted heating of the sample space could be further reduced (at the expense of a longer time constant) by increasing the length of the stainless steel screws and number of alumina beads. The thermal time constant of the noise source is temperature-dependent and governed by the ratio of the heat capacity of the copper-body of the noise source to the thermal conductance of the weak link Bachmann et al. (1972). We measure the time constant by first elevating the noise source temperature to a constant value using a constant heater power. Subsequently, the heating power is reduced by 5 %, and the cooling curve between each steady state temperature was fit to an exponential decay with time constant . The procedure was repeated over a range of heater powers that correspond to the temperature points in the inset of Fig. 1b. As the temperature increases from 0.1 K to 5 K, the corresponding thermal time constant of the noise source decreases from > 500 s to 10 s. In the following sections, waiting times of at least between temperature data points are used. For example, to guarantee thermalization of the noise source in the results of Sec. III, we always wait 20 minutes after changing the temperature feedback setpoint and before starting a measurement.
We characterize the impedance matching of the same type of attenuator as the ones installed in the noise source by measuring the calibrated reflection and transmission using a multiline thru-reflect-line technique originally outlined in Refs. 35; 36 and further described in Appendix B. As shown in Fig. 1c, the reflected signals are below -20 dB over a frequency span from 500 MHz – 11 GHz at the temperature of 10 mK. Based on this impedance matching, we omit mismatch effects in the noise error budget of the following sections. Furthermore, we observe that the attenuation remains at a nearly constant value of 9.977 dB over the measurable frequency range and that its deviation from the room temperature attenuation value is negligible ( change). The bandwidth of the measurement is limited by the directional coupler in the measurement.
II.2 Measurement Principle
Figure 2 displays the noise source with controllable physical temperature mK installed at the input of the cascaded amplifiers. A full wiring diagram with all components is shown in Appendix B.1 (Fig. 6a). The physical temperature determines the input noise temperature in either a classical or quantum regime Clerk et al. (2010). In the classical regime of (where is the Boltzmann constant, is the Planck constant, and is the operation frequency of the AUT) we consider the condition Pozar (2012). In contrast, the quantum regime is characterized by , with a correspondence between and as,
| (1) |
To improve accuracy, we always include this quantum correction to the noise emitted by the noise source, even at higher noise temperatures.
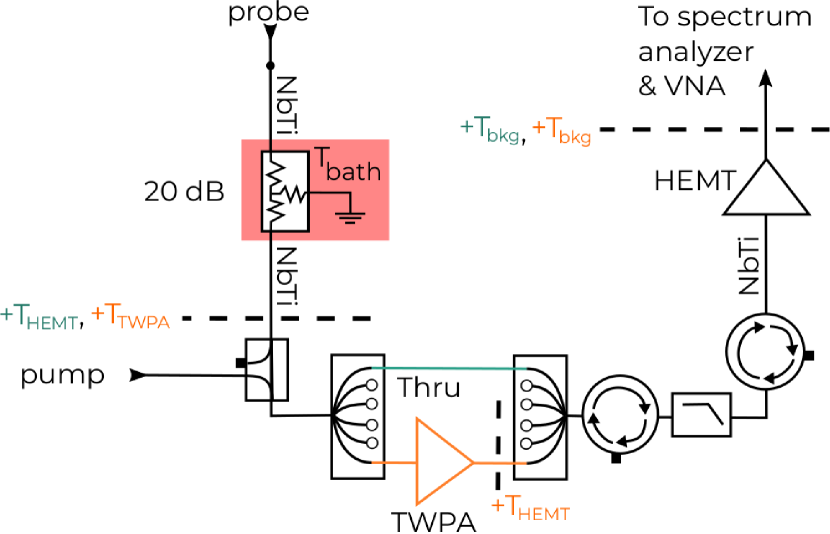
The wiring configuration of Fig. 2 is designed to compare noise results with and without the TWPA. Specifically, two distinct signal paths can be selected with the coaxial switch that is installed at the millikelvin stage. The first path includes only a 76-mm-long coaxial transmission line labeled "Thru" (green line) to bypass the TWPA, and the second signal path includes the TWPA (orange triangle). The microwave pump tone required to operate the TWPA can be combined with the signal paths through a directional coupler at the mixing chamber stage of the cryostat. After the HEMT and room temperature amplification (not shown in Fig. 2), a spectrum analyzer detects the output noise power from the system. In particular, we measure the integrated noise power from a 10 kHz span to represent noise at a single operating frequency. Additionally, we apply a probe tone at the center of the selected span. This enables accurate detection of the difference in magnitudes of transmission between the first and second signal paths to determine the gain of the TWPA. We set the resolution bandwidth of the spectrum analyzer to 100 Hz in order to keep the incoming noise at least 10 dB above the noise floor of the spectrum analyzer as well as to detect the weak probe at a signal-to-noise ratio of at least 10 dB. Since the signal-to-noise ratio allows it, the probe power is set to a safe low value of approximately -130 dBm at the input of the noise source, both to prevent pre-amplifier saturation and to limit self-heating of the noise source.
We consider initially the output power of the first signal path that bypasses the TWPA. To express the measured output noise power in terms of equivalent noise temperatures of individual components, we divide by the sum of amplifier gain and component losses , the measurement bandwidth Hz, and as
| (2) |
where is the experimentally controllable input noise temperature from the noise source via Eq. (1), is the noise temperature of the HEMT with gain , and arises from the amplification and loss in components at higher temperature stages following the HEMT. The green text labels (,) in Fig. 2 indicate the noise of lumped noise contributions along the first signal path. These contributions govern the system noise , which is the key quantity when determining the performance of the amplifier chain.
We collect many pairs of data points , for and fit these with Eq. (2) reformulated as , which we demonstrate with an example fit in Appendix B.2. This reordering of terms is done because the gain contained in the slope cannot be measured directly with the wiring of Figs. 2 and 6. The offset reveals the noise added by the cascade, which is equivalent to the system noise after the addition of a minimum input noise using Eq. (1). In other words, nearly input noise would emerge as the noise coming from the 10-mK mixing chamber stage itself, even in the absence of experimentally added noise. In addition to amplification, the measured system noise quantifies the noise contributions due to the loss in passive components such as the cables, isolators, and filters between the noise source and HEMT. On the other hand, the high gain of the HEMT makes noise after the HEMT insignificant given the condition .
For the second signal path of Fig. 2 that includes the TWPA, we expect to obtain a lower system noise temperature due to the added gain from the TWPA as well as its low physical temperature and composition from low-loss superconducting materials. More precisely, the TWPA is an approximately 50-ohm transmission line composed of a series array of 4064 Josephson junctions with a critical current of about 4 A, fabricated at VTT with the side-wall spacer passivated junction process Grönberg et al. (2017). Additional details including a list of design parameters, an electrical circuit model, and a microphotograph of the device are available in Appendix C.1. Using a strong pump tone, the Kerr-nonlinearity of the junctions allows a four-wave mixing process where an additional idler appears at with as the signal and the pump frequency. This process adds additional steps to the measurements and data analysis since the idler band is also a source of noise, as we detail in Appendix B.2. Another consideration is that, to prevent saturation of the TWPA, we operate the noise source at low temperatures of . In this low temperature regime, the quantum corrections of Eq. (1) are especially important Clerk et al. (2010).
The wiring schematic of Fig. 2 enables the operation of the TWPA with negligible perturbation on the noise source. The pump tone (of approximately 0.14 nW of microwave power at the TWPA input) is introduced through a dedicated line and is combined with the signal path immediately before the TWPA at the base stage of the cryostat with the directional coupler shown in Fig. 2. This directional coupler isolates the noise source from the incoming pump by a directivity factor of 15 dB. In addition, the power reflected from the TWPA back to the noise source is suppressed by 16.5 dB with respect to the incoming pump given the reflection coefficient of Table 1 in Appendix C. Therefore the pump power reaching the noise source is seven orders of magnitude lower than the heat applied directly to the noise source at the noise source temperature of K.
III Measurement Results and Analysis
We characterize the TWPA gain using the wiring introduced in Sec. II.2 and display the results in Fig. 3 measured with a network analyzer. The device is pumped at 5968 MHz with an approximate power of -69 dBm at its input port (that was estimated by accounting for dB loss arising from cable losses). Using a probe tone of approximately -131 dBm at the TWPA input port, we observe the characteristic semi-circle gain profile that is centered on the pump frequency as can be seen in the blue "pump on" trace of Fig. 3. In comparison, when the pump is turned off we observe attenuation from dielectric loss in the transmission line of the TWPA (orange trace). The loss (4.5 dB at 8 GHz) in the un-pumped device motivates using the separate coaxial "Thru" for accurate loss-calibrated gain measurements of parametric amplifiers that are operated in transmission. The calibrated gain of the TWPA stays above 10 dB in a 700 MHz region around the pump.

After verifying the TWPA operation we are now prepared to perform the Y-factor measurements for both signal paths following the measurement principle of Sec. II.2 using many input noise temperature points. We plot the noise temperature results in Fig. 4 where the error bars are derived in Appendix B.3. For the "Thru" signal path that bypasses the TWPA, the noise is dominated by the wiring and connectors between the noise source and HEMT, filters, isolators, and the added noise of the HEMT. The system noise—plotted as blue markers of Fig. 4—is measured at frequencies between 5 GHz – 7 GHz, and its lowest value is K near 6 GHz. The noise exceeds the values reported in the data sheet of the HEMT (dashed line) of approximately 1.7 – 1.9 K. We can explain this discrepancy by performing a separate control experiment where we remove the isolators, and filters from the output line. In the control experiment, we operate the noise source in a single-ended mode at 6.5 GHz (red cross in Fig. 4) with the source directly connected to the HEMT through coaxial cables (see schematic of Appendix B.1, Fig. 6b). The system noise temperature in the control experiment is 2.2 K which is in agreement with the value reported in the HEMT data sheet. Therefore, we conclude that the wiring, isolators, and filters have a non-negligible contribution to the system noise. Regardless, in any practical quantum measurement, one needs to isolate a sample or a parametric amplifier from a reflective and relatively high temperature HEMT. Therefore, the higher-than-specified system noise values represent realistic system performance.
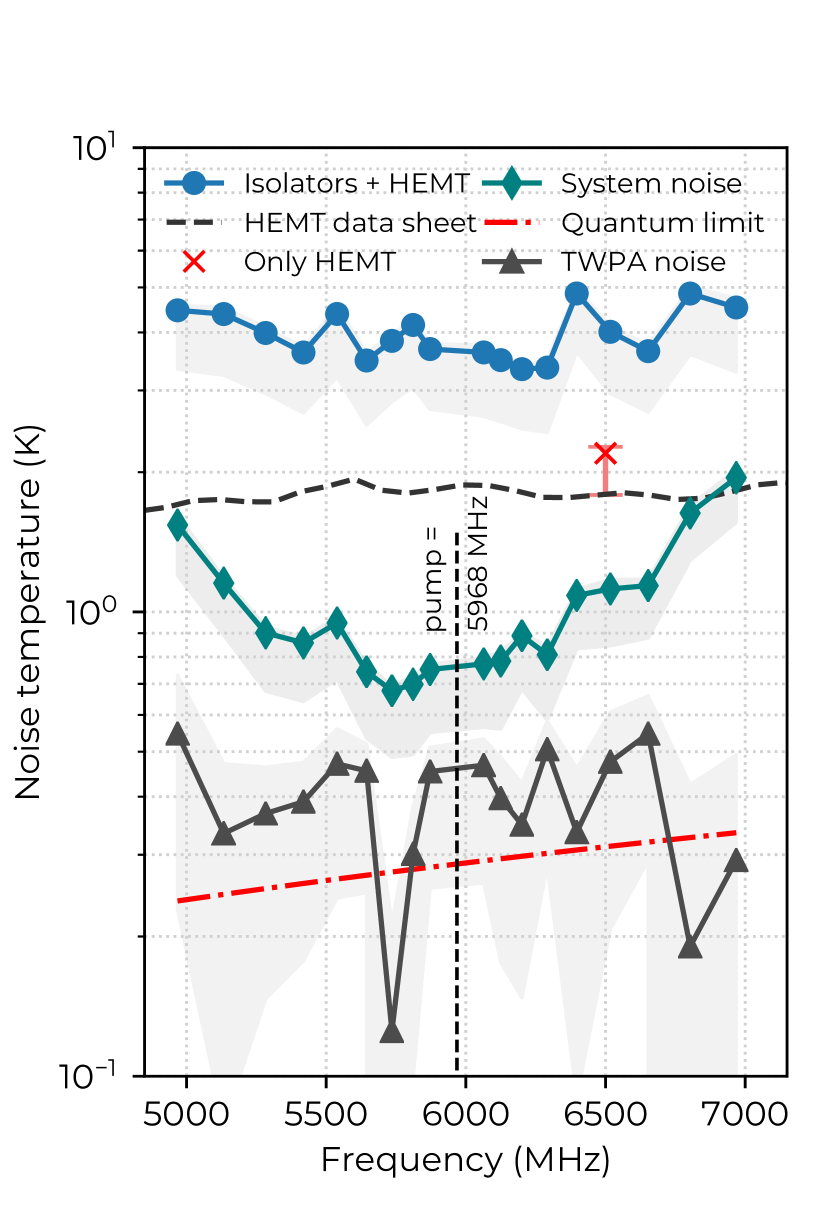
Measured through the signal path that includes the TWPA, the system noise (teal diamonds) reaches its lowest value of mK at a frequency of 5735 MHz (which is detuned by 233 MHz from the pump). This result is times the one-photon quantum limit Caves (1982) (red dash-dotted line) that also includes input noise. We note that the measured system noise follows an inverted trend with respect to the frequency-dependent gain profile of Fig. 3, because the gain of the low-noise TWPA can dilute the added noise of the HEMT in the total system noise.
Finally, we calculate the intrinsic noise of the TWPA by analyzing the differences in system noise and gain between the two signal paths. We reduce the system noise from the "Thru" signal path to the input of the TWPA and calculate the difference which is the TWPA noise . The relatively higher scatter and wider error bars (shaded region) on this derived quantity is the result of the error in the system noises from the two paths adding together, since the gain of the TWPA is not enough to completely eliminate the contribution of the HEMT to the total system noise. In the future, this error could be decreased by increasing the resolution bandwidth accompanied by a moderate improvement to pre-amplification, which would make the measurement faster and reduce statistical uncertainty in the acquired noise. However, we find that the strong pump easily saturates amplifiers that follow the TWPA and hence we were unsuccessful in adding more pre-amplification for this experiment. Without additional pre-amplification, the resolution bandwidth could still be increased to approximately 1 kHz by rewiring the coupler at room temperature to use the through line for the noise acquisition.
Another representation for the noise of the TWPA can be obtained by converting the intrinsic noise temperature to photons. We calculate the weighted average of input noise photons with , leading to an estimate of photons, which is close to the one-photon quantum limit. This analysis supports the hypothesis that if the amplifier gain increased, the system noise would asymptotically decrease toward the quantum limit to achieve optimal signal-to-noise.
IV Conclusion
In conclusion, we have developed a well-matched temperature controllable "cold" noise source designed for characterization of ultra-low noise amplifiers in a cryogenic environment. The dynamic range is designed for modern cryogenic amplifiers including both quantum limited parametric amplifiers and HEMTs. We demonstrate its use in conjunction with an amplifier cascade intended for qubit readout. Our results also highlight the significance of the losses in components that directly precede the HEMT, which we observe can even double the system noise temperatures. The noise source apparatus lays the groundwork for testing other sensitive low-noise amplifiers and optimized readout line configurations.
Acknowledgements.
S.S. thanks E.T. Mannila for useful discussions on noise measurements. V.V., L.G., and J.H. acknowledge financial support from the Academy of Finland through its Centers of Excellence Program (project nos. 312059 and 312294) and grant no. 321700, and from the EU Flagship on Quantum Technology H2020-FETFLAG-2018-03 project 820363 OpenSuperQ. Furthermore, the authors gratefully acknowledge Janne Lehtinen and Mika Prunnila from VTT Technical Research Center of Finland Ltd also involved in the TWPA development. This research made use of scikit-rf, an open-source Python package for RF and Microwave applications.Appendix A Photograph of noise source
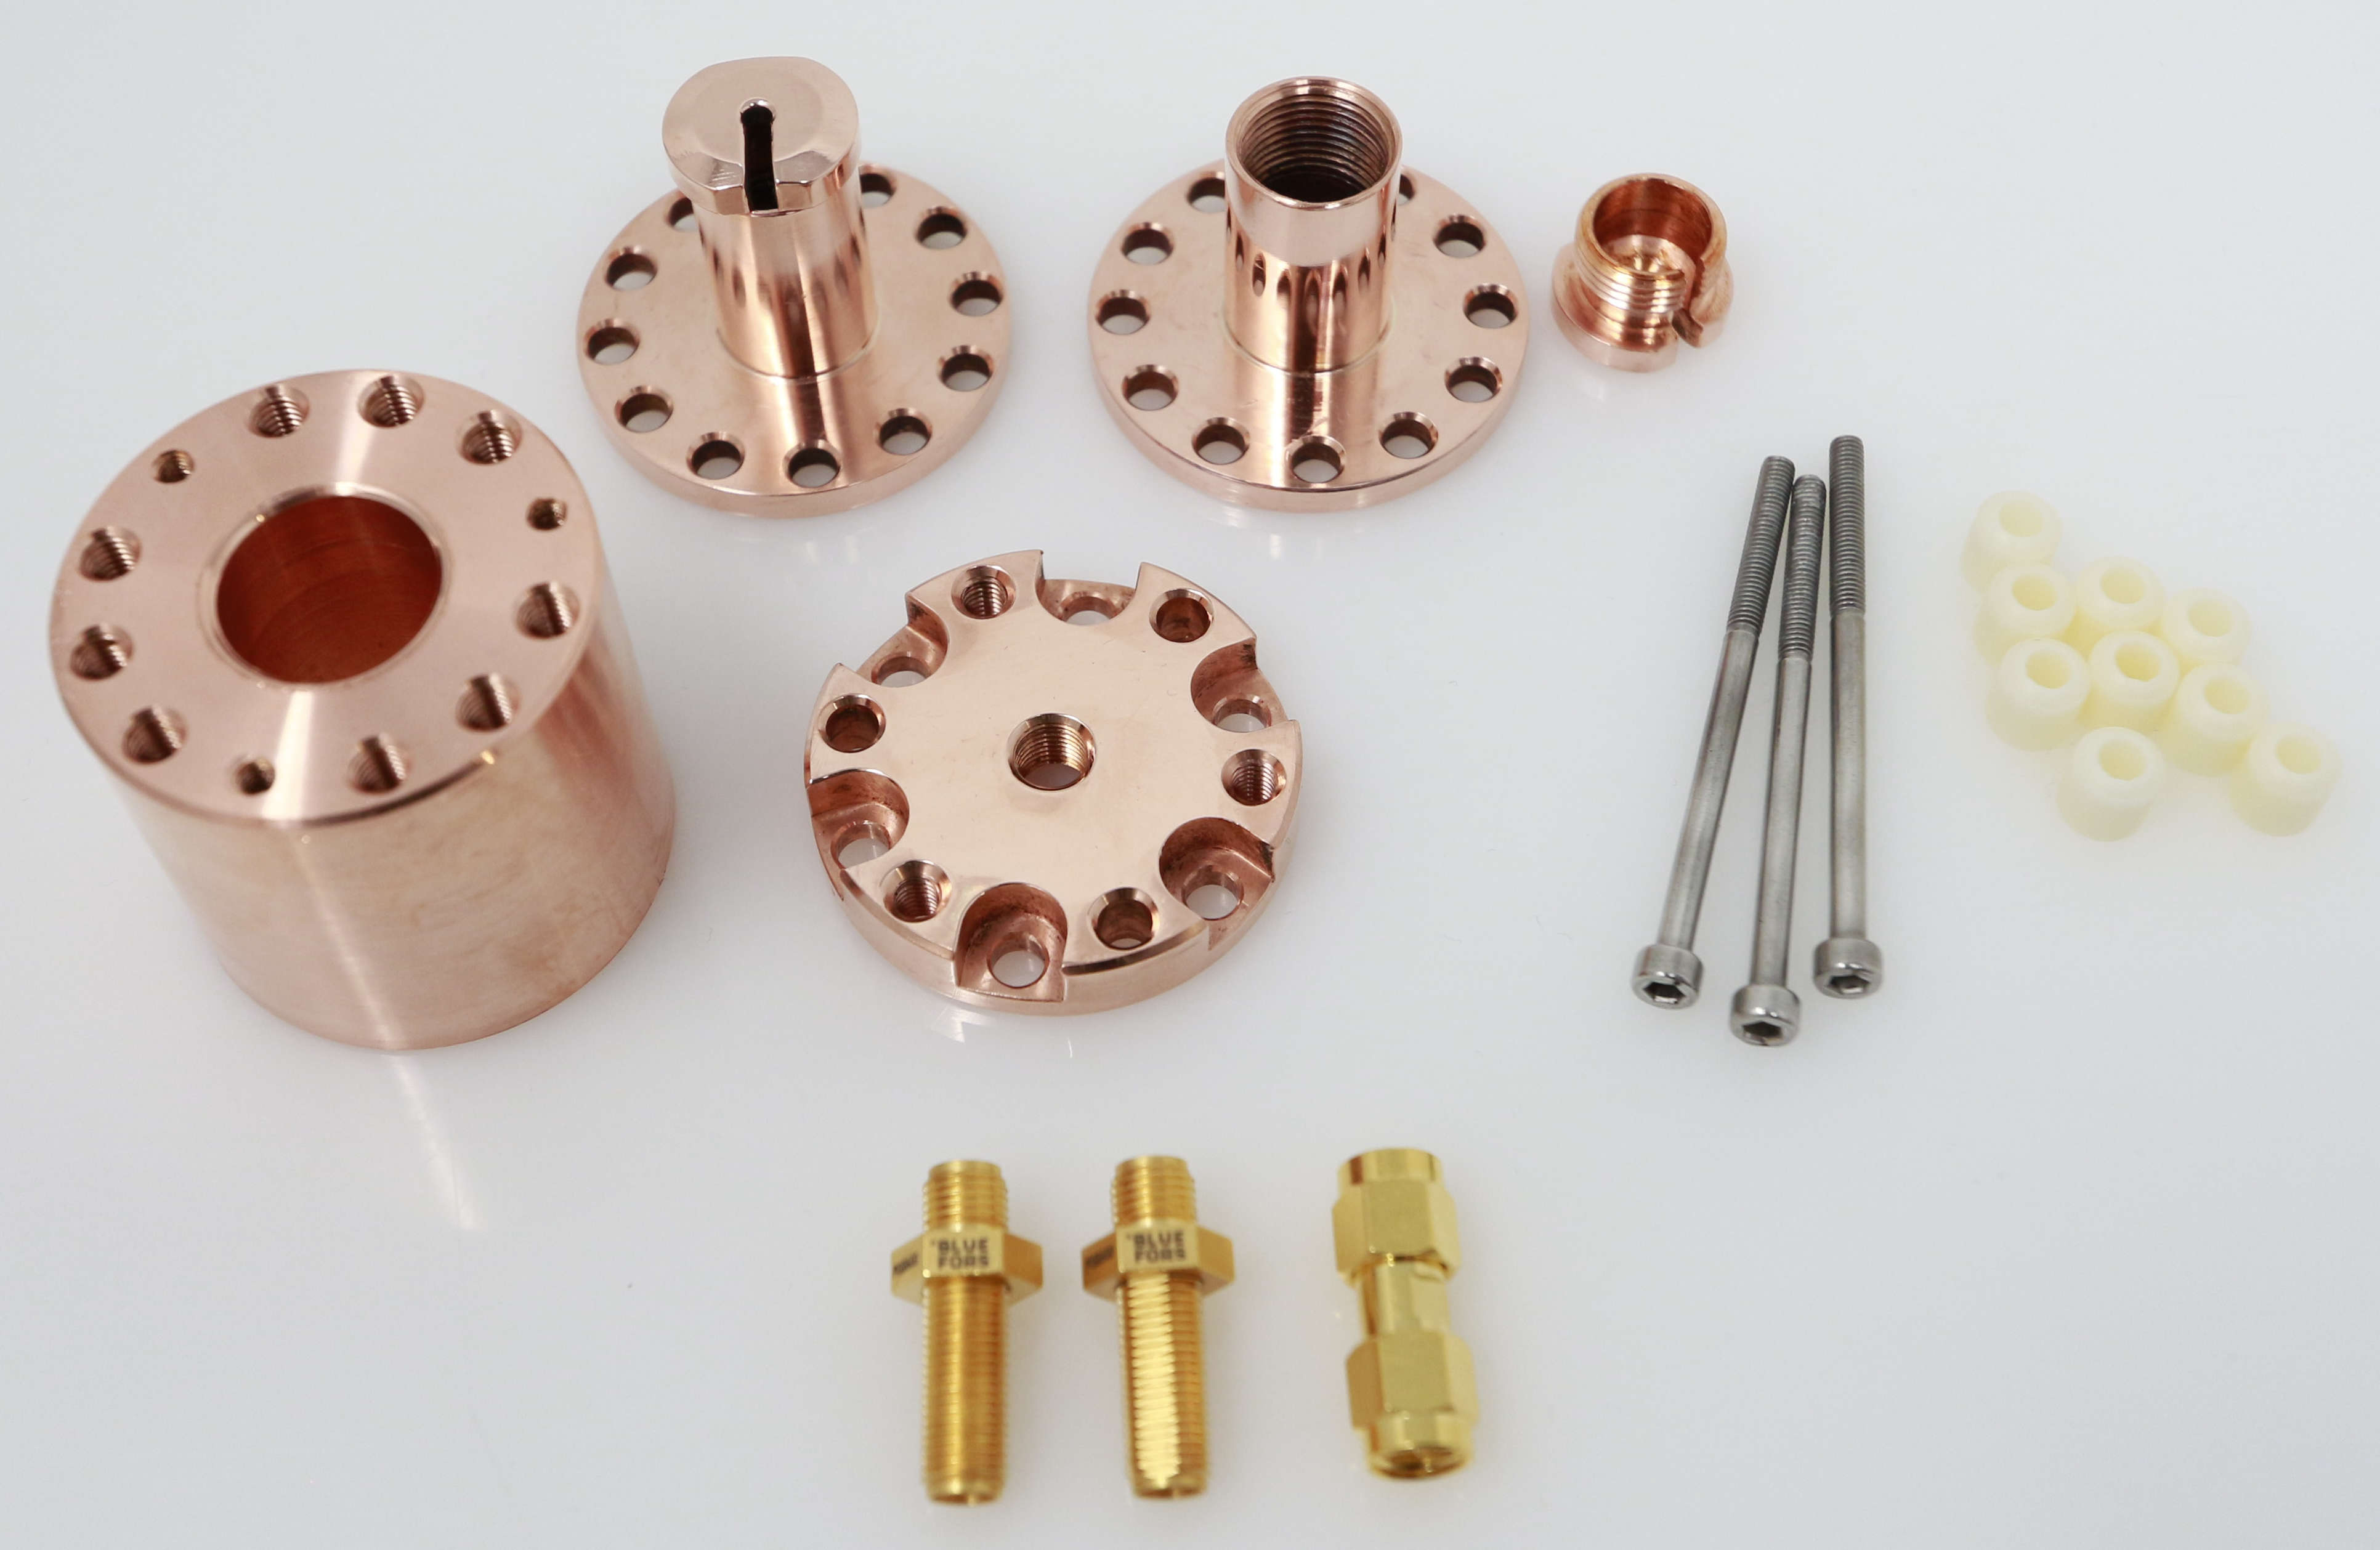
Photograph of the parts used for building the noise source (Fig. 5).
Appendix B Details on measurement and analysis
B.1 Full Measurement Schematic
The detailed wiring schematic for noise and gain measurements is shown in Fig. 6.
B.2 Data Analysis
In addition to the quantum corrections presented in Eq. (1) of the main text, when considering the added noise due to the parametric processes in the TWPA, the presence of the additional idler tone needs to be taken into account. This can be done by introducing an effective input noise as
| (3) |
where the first term constitutes noise from the signal frequency . The second term, arising from four wave mixing, is noise from the idler frequency converted at a gain of and reduced back to the input by division with the gain of the TWPA . Now, using the effective input noise , we may write the system noise equation for the path of Fig. 2 that includes the TWPA in a similar manner as was done for the "Thru" path in the main text. This time we refer to the orange variables and write the system noise as
| (4) |
where is the intrinsic noise of the TWPA, is the same background noise from Eq. (2) again made negligible by HEMT gain , whereas the HEMT noise is approximately equal to that measured using the "Thru" path, since the lumped contributions differ by only a few low-loss components. Therefore, measuring the system noise through both paths allows calculating the intrinsic noise of the parametric amplifier. The error arising from the differing components is taken into account following the principles presented in the next subsection.
In order to apply the above equations, the noise measurements are performed in a similar manner, as for the "Thru" path of Fig. 2: we heat the source, wait for 20 minutes for the proportional integral differential (PID) feedback to stabilize the temperature, and measure spectra in 10 kHz windows centered on the chosen signal frequencies. A slight difference in the TWPA measurements is that the spectra are also captured at the corresponding idler frequencies to determine signal and conversion gains accurately. This procedure is repeated over a range of bath temperatures between 0.135 and 0.9 K.
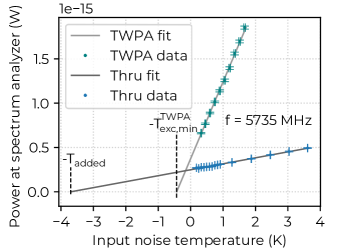
Using Eqs. (1), (3), and (4), we then fit linear equations of the form where is proportional to the total gain and is the excess noise over the one-photon quantum limit for system noise, when only vacuum noise is assumed at the input. An example fit, corresponding to the lowest measured system noise of mK at 5735 MHz is shown in Fig. 7 alongside a corresponding fit for the "Thru" path as per Eq. (2). Now, evaluating at gives us the lowest system noise temperature we could realistically obtain if the amplifier cascade were wired to receive input noise from the mixing chamber stage at base temperature. The fit is weighted using calibration errors of the thermometer and the spectrum analyzer which we estimate to be in the order of 5 mK–7 mK and 0.25 dB, respectively. Actuating the rf switch heats up the mixing chamber, and therefore we only toggle between probe paths after measuring all the temperature points for a path. For this reason, the effective input noise of Eq. (3) is determined using averaged signal and conversion gains to even out any drifts and their errors appear also in horizontal uncertainty of the teal-colored data of Fig. 7, as we explain in the upcoming subsection.
B.3 Error analysis
In our noise calculations shown so far, we have omitted the microwave circuitry after the HEMT as well as the insertion loss from rf switches, filters, isolators, and other wiring between the noise source and the first amplifier. In reality, to obtain the error bars for instance for the noise of "Thru" path in Fig. 4, we have already corrected the system noise of Eq. (2) with
| (5) |
where is again the offset from the fit, and are the loss and temperature of the attenuator modeling the insertion loss. The input noise of 10 mK does not affect the error estimation:
| (6) |
where the third and fourth terms are still very small due to the high gain of the HEMT, is the error of mean given by least squares, is the uncorrected insertion loss, and and are the corrections to switch temperature and insertion loss. We feel that the latter errors can only reduce the noise temperature and they should equate to zero for positive errors. In the negative case, reasonable estimates are -100 mK and the difference of 0 dB and the maximal estimated loss of -1 dB. The latter number is based on data sheet values for the rf switches and the isolators before the HEMT amplifier.
The error in system noise temperature for the path that includes the TWPA, i.e. Eq. (4), is derived quite similarly but we may now limit the insertion loss to 0.5 dB from the first rf switch. A new consideration is that, the variations of the probe and conversion gains also have to be taken into account in the effective input noise of Eq. (3), as it is needed in fitting and its error defines the respective weights for individual data points. Since we always operate at a signal-to-noise ratio of over 10 dB, even at the highest source temperature, noise power at the probe frequency should not affect the observed magnitude of the probe signal on the spectrum analyzer. Therefore, for both of these types of gains, at a given frequency, we may take the mean value (of all gains of the same type) across all source temperatures. We then use these means and their statistical errors in calculating the effective input noise and its uncertainty for that frequency.
Using the above method, we avoid switching during the sweep through the temperature operating points, and therefore switching is done only once during the whole experiment. A switching event heats up the mixing chamber slightly and for this reason we monitor the mixing chamber temperature and wait for it to cool below 20 mK before we start the measurement through the other path. So any error due to repeatibility of switch insertion loss will be systematic in all the noise power data measured for a single path, which means that it only affects the gain values obtained and therefore the estimate for intrinsic noise of the TWPA. We find that the errors in the latter are more influenced by the fact that it is a difference of two quantities, as we also mention in the main text, and by the error in gains which are of the order of 1 dB. To investigate the latter point, we tested the switch repeatability in a separate cooldown. With shorting caps on each switch port on nominally identical switches, we cycled through all the switch channels ten times at base temperature, with a waiting time of 2 minutes between switching events. In this way, we found that the variability indicative of insertion loss is less than 0.5 dB from 6 to 7 GHz and negligible below 6 GHz.
B.4 Cryogenic S-parameter measurement
A multiline Thru-Reflect-Line (TRL) calibration procedure was performed to measure cryogenic S-parameter data of the attenuator used in the noise source by implementing the methods previously outlined in Refs. 35; 36. The two input and two output signals were sourced and received by a pre-calibrated four-port vector network analyzer. The signals were routed through directional couplers at the MXC stage and into single-pole six-throw latching electromechanical switches so that transmission and reflection could be acquired from both ports of a two-port device under test connected between the switches. Thru, Reflect, Line 1, Line 2, and the 10 dB attenuator-under-test were connected with identical length cables (phase-matched within <1 ps) and connected between the switch ports. The Thru, Line 1, and Line 2 were comprised of sections of rigid coaxial transmission line with different physical lengths of 22.23 mm, 25.58 mm, and 46.66 mm respectively. The coaxial transmission lines were designed with a nominal impedance of 50 with an inner contact diameter of 1.27 mm, and a Teflon-dielectric outer diameter of 4 mm. These components were manufactured with cryogenic compatible metals: gold-plated C101 Cu alloy housing and a Be–Cu gold-plated center conductor. The Reflect standards were realized with a shorting cap that shunted the center conductor to its shield. The calibration algorithm was implemented with an open-source software tools in www.scikit-rf.org.
The Thru, Line 1, and Line 2 standards were pre-characterized at room temperature using a commercial network analyzer with an electronic calibration kit using a reference input impedance of 50 . At room temperature these standards had less than 25 dB reflections across the frequency band between 300 kHz and 18 GHz. In the specific measurement band of interest in Fig. 4, all standards had lower than 35 dB room temperature return loss. We detect a increase in the mean of the transmission line phase velocity of the calibration standards after they are cooled to cryogenic temperature. This corresponds to a increase in the reference characteristic impedance of Fig. 4c that we attribute in this case to the decrease of capacitance during thermal contraction of the dielectric. Ongoing work focuses on improving the sensitivity of the cryogenic reflection measurement and establishing direct traceability of the cryogenic S-parameter measurements to metrological standards.
Appendix C Traveling wave parametric amplifier
C.1 Design and fabrication
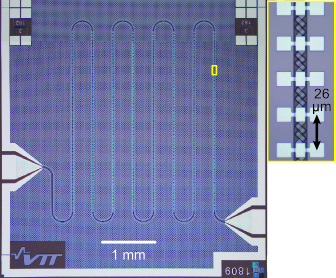
VTT has developed Josephson traveling wave parametric amplifiers (TWPAs) that are fabricated with a side-wall passivated spacer (SWAPS) niobium junction technology Grönberg et al. (2017). The multi-layer fabrication process relies on UV photolithography and semi-automated 150-mm wafer processing steps. The substrate is high-resistivity silicon, and the layer thicknesses of the metals and the insulator range between 50 nm and 120 nm. As in Ref. 6, the TWPA concept is a coplanar waveguide (CPW) transmission line where the center conductor is composed of Josephson junctions (Fig. 8). The non-linearity of the Josephson inductance with respect to electric current allows a four-wave mixing process where the energy of a strong microwave pump tone (at frequency ) is transferred to a weak signal (at frequency ). At the same time, an idler tone emerges at the frequency . The non-linearity also causes a phase mismatch between the pump, signal, and idler, which could be compensated for by dispersion engineering White et al. (2015); Macklin et al. (2015). In a lossless and phase-matched (-mismatched) TWPA the power gain grows exponentially (quadratically) with the device length.
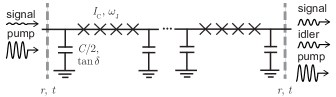
Microphotographs of our phase-mismatched TWPA show a meandering layout where a four-junction unit cell is repeated 1016 times (Fig. 9). We target a critical current density of for the Nb/Al-AlOx/Nb junctions. The shunt capacitance to ground is dominated by parallel plates separated by atomic layer deposited AlOx, with a capacitance density per unit area of about 1.5 fF. The electrical device parameters are listed in Table 1.
The TWPA chip with dimensions of 5 mm 10 mm 675 m is mounted into a superconducting aluminum package. Inside the package there is a printed circuit board (PCB, material Rogers RO4003C) sandwiched between the aluminum base and lid. Aluminum bondwires connect the TWPA into the PCB. On the PCB, surface-mount subminiature push-on (SMP) microwave connectors provide an interface with coaxial wiring external to the package. Segments of ground-backed coplanar waveguide carry microwaves on the PCB between the SMP connectors and the TWPA chip.
| Parameter | Symbol | Value |
| Junction critical current | 4.4 | |
| Josephson plasma frequency 111The dispersiveness of the CPW is mainly determined by the Josephson plasma resonance and the unit cell cut-off. | GHz | |
| Unit cell physical length | 26 m | |
| Unit cell inductance (unpumped) 222Stray geometric inductance (capacitance) extracted from ANSYS HFSS electromagnetic simulations amounts to about 3 % (4 %) of the unit cell. | 312 pH | |
| Unit cell capacitance 222Stray geometric inductance (capacitance) extracted from ANSYS HFSS electromagnetic simulations amounts to about 3 % (4 %) of the unit cell. | 115 fF | |
| Dielectric loss tangent 333In our numerical model only the signal and idler experience dielectric loss, while the pump remains unaffected. | 0.0025 | |
| Pump current amplitude 444A free parameter when we optimize the numerical model. | ||
| Mirror reflection coefficient 444A free parameter when we optimize the numerical model. | 0.15 | |
| Mirror transmission coefficient |
C.2 Numerical modeling
To simulate the TWPA transmission we combine the following set of tools: coupled-mode equations (CMEs) of the co-propagating waves O’Brien et al. (2014), modeling of dielectric loss Macklin et al. (2015), and analysis of gain ripples Planat et al. (2020). The pump is assumed to be stiff and the pump current has a constant amplitude . The magnitude of the idler entering the TWPA input is zero. The numerically solved CMEs produce the complex-valued transmission scattering parameters and of the signal tone in a pumped and unpumped CPW, respectively. Imperfect radio-frequency mode conversions at the interfaces between the CPW and the sample holder are the principal reason for the gain ripples that we observe experimentally. We model the impedance mismatch with Fabry-Perot cavity formalism where mirrors (reflection coefficient , transmission coefficient ) reside at the TWPA input and output (Fig. 8) Planat et al. (2020). In Fig. 3 we present simulated curves of the transmitted power along with the experimental data. They have been calculated as the squared absolute values of
| (7a) | |||
| (7b) | |||
Here, Eq. (7a) [Eq. (7b)] represents the pumped (unpumped) TWPA. Backward-propagating signals are assumed to experience .
In the numerical model we neglect the small geometric inductances and capacitances, the magnitudes of which are presented in Table 1. Since they are linear, low-loss circuit elements, the values of and are slightly underestimated.
Data availability
The data that support the findings of this study are available from the corresponding author upon reasonable request.
References
- Blais et al. (2004) A. Blais, R.-S. Huang, A. Wallraff, S. M. Girvin, and R. J. Schoelkopf, “Cavity quantum electrodynamics for superconducting electrical circuits: An architecture for quantum computation,” Phys. Rev. A 69, 062320 (2004).
- Wallraff et al. (2005) A. Wallraff, D. I. Schuster, A. Blais, L. Frunzio, J. Majer, M. H. Devoret, S. M. Girvin, and R. J. Schoelkopf, “Approaching Unit Visibility for Control of a Superconducting Qubit with Dispersive Readout,” Phys. Rev. Lett. 95, 060501 (2005).
- Krantz et al. (2019) P. Krantz, M. Kjaergaard, F. Yan, T. P. Orlando, S. Gustavsson, and W. D. Oliver, “A quantum engineer’s guide to superconducting qubits,” Applied Physics Reviews 6, 021318 (2019).
- Castellanos-Beltran et al. (2008) M. A. Castellanos-Beltran, K. D. Irwin, G. C. Hilton, L. R. Vale, and K. W. Lehnert, “Amplification and squeezing of quantum noise with a tunable Josephson metamaterial,” Nature Physics 4, 929–931 (2008).
- Mutus et al. (2013) J. Y. Mutus, T. C. White, E. Jeffrey, D. Sank, R. Barends, J. Bochmann, Y. Chen, Z. Chen, B. Chiaro, A. Dunsworth, J. Kelly, A. Megrant, C. Neill, P. J. J. O’Malley, P. Roushan, A. Vainsencher, J. Wenner, I. Siddiqi, R. Vijay, A. N. Cleland, and J. M. Martinis, “Design and characterization of a lumped element single-ended superconducting microwave parametric amplifier with on-chip flux bias line,” Appl. Phys. Lett. 103, 122602 (2013).
- White et al. (2015) T. C. White, J. Y. Mutus, I.-C. Hoi, R. Barends, B. Campbell, Y. Chen, Z. Chen, B. Chiaro, A. Dunsworth, E. Jeffrey, J. Kelly, A. Megrant, C. Neill, P. J. J. O’Malley, P. Roushan, D. Sank, A. Vainsencher, J. Wenner, S. Chaudhuri, J. Gao, and J. M. Martinis, “Traveling wave parametric amplifier with Josephson junctions using minimal resonator phase matching,” Appl. Phys. Lett. 106, 242601 (2015).
- Macklin et al. (2015) C. Macklin, K. O’Brien, D. Hover, M. E. Schwartz, V. Bolkhovsky, X. Zhang, W. D. Oliver, and I. Siddiqi, “A near–quantum-limited Josephson traveling-wave parametric amplifier,” Science 350, 307–310 (2015).
- Zorin et al. (2017) A. B. Zorin, M. Khabipov, J. Dietel, and R. Dolata, “Traveling-Wave Parametric Amplifier Based on Three-Wave Mixing in a Josephson Metamaterial,” in 2017 16th International Superconductive Electronics Conference (ISEC) (2017) pp. 1–3.
- Planat et al. (2020) L. Planat, A. Ranadive, R. Dassonneville, J. Puertas Martínez, S. Léger, C. Naud, O. Buisson, W. Hasch-Guichard, D. M. Basko, and N. Roch, “Photonic-Crystal Josephson Traveling-Wave Parametric Amplifier,” Phys. Rev. X 10, 021021 (2020).
- Vissers et al. (2016) M. R. Vissers, R. P. Erickson, H.-S. Ku, L. Vale, X. Wu, G. C. Hilton, and D. P. Pappas, “Low-noise kinetic inductance traveling-wave amplifier using three-wave mixing,” Appl. Phys. Lett. 108, 012601 (2016).
- Ranzani et al. (2018) L. Ranzani, M. Bal, K. C. Fong, G. Ribeill, X. Wu, J. Long, H.-S. Ku, R. P. Erickson, D. Pappas, and T. A. Ohki, “Kinetic inductance traveling-wave amplifiers for multiplexed qubit readout,” Appl. Phys. Lett. 113, 242602 (2018).
- Chaudhuri et al. (2017) S. Chaudhuri, D. Li, K. D. Irwin, C. Bockstiegel, J. Hubmayr, J. N. Ullom, M. R. Vissers, and J. Gao, “Broadband parametric amplifiers based on nonlinear kinetic inductance artificial transmission lines,” Appl. Phys. Lett. 110, 152601 (2017).
- Malnou et al. (2021) M. Malnou, M. Vissers, J. Wheeler, J. Aumentado, J. Hubmayr, J. Ullom, and J. Gao, “Three-wave mixing kinetic inductance traveling-wave amplifier with near-quantum-limited noise performance,” PRX Quantum 2, 010302 (2021).
- Schoelkopf et al. (2003) R. Schoelkopf, A. Clerk, S. Girvin, K. Lehnert, and M. Devoret, “Qubits as spectrometers of quantum noise,” in Quantum Noise in Mesoscopic Physics, Vol. 97, edited by Y. Nazarov (Springer, Dordrecht, 2003) pp. 175–203.
- Mura (1966) P. H. D. Mura, “An Ultra-low-noise 1700-Mc Parametric Amplifier System,” Technical note NASA-TN-D-3339 (NASA, Goddard Space Flight Center Greenbelt, MD, 1966).
- Pozar (2012) D. Pozar, Microwave Engineering, 4th ed. (Wiley, 2012).
- Fernandez (1998) J. E. Fernandez, “A Noise-Temperature Measurement System Using a Cryogenic Attenuator,” Telecommunications and Mission Operations Progress Report 135, 1–9 (1998).
- Cano, Wadefalk, and Gallego-Puyol (2010) J. L. Cano, N. Wadefalk, and J. D. Gallego-Puyol, “Ultra-Wideband Chip Attenuator for Precise Noise Measurements at Cryogenic Temperatures,” IEEE Trans. Microwave Theory Techn. 58, 2504–2510 (2010).
- Yeh et al. (2017) J.-H. Yeh, J. LeFebvre, S. Premaratne, F. C. Wellstood, and B. S. Palmer, “Microwave attenuators for use with quantum devices below 100 mk,” J. Appl. Phys. 121, 224501 (2017).
- Otegi, Collantes, and Sayed (2005) N. Otegi, J. M. Collantes, and M. Sayed, “Uncertainty estimation in noise figure measurements at microwave frequencies,” in AMUEM 2005 – International Workshop, 17 (IEEE, 2005) pp. 84–89.
- Su-Wei Chang et al. (2016) Su-Wei Chang, J. Aumentado, Wei-Ting Wong, and J. C. Bardin, “Noise measurement of cryogenic low noise amplifiers using a tunnel-junction shot-noise source,” in 2016 IEEE MTT-S International Microwave Symposium (IMS) (IEEE, San Francisco, CA, 2016) pp. 1–4.
- Spietz et al. (2003) L. Spietz, K. W. Lehnert, I. Siddiqi, and R. J. Schoelkopf, “Primary electronic thermometry using the shot noise of a tunnel junction,” Science 300, 1929–1932 (2003).
- Spietz, Schoelkopf, and Pari (2006) L. Spietz, R. J. Schoelkopf, and P. Pari, “Shot noise thermometry down to 10 mk,” Appl. Phys. Lett. 89, 183123 (2006).
- Krinner et al. (2019) S. Krinner, S. Storz, P. Kurpiers, P. Magnard, J. Heinsoo, R. Keller, J. Lütolf, C. Eichler, and A. Wallraff, “Engineering cryogenic setups for 100-qubit scale superconducting circuit systems,” EPJ Quantum Technol. 6, 2 (2019).
- Blais et al. (2020) A. Blais, A. L. Grimsmo, S. M. Girvin, and A. Wallraff, “Circuit Quantum Electrodynamics,” arXiv:2005.12667 [quant-ph] (2020), arXiv:2005.12667 [quant-ph] .
- Yurke et al. (1996) B. Yurke, M. L. Roukes, R. Movshovich, and A. N. Pargellis, “A low-noise series-array Josephson junction parametric amplifier,” Appl. Phys. Lett. 69, 3078–3080 (1996).
- Schleeh et al. (2012) J. Schleeh, G. Alestig, J. Halonen, A. Malmros, B. Nilsson, P. A. Nilsson, J. P. Starski, N. Wadefalk, H. Zirath, and J. Grahn, “Ultralow-Power Cryogenic InP HEMT With Minimum Noise Temperature of 1 K at 6 GHz,” IEEE Electron Device Letters 33, 664–666 (2012).
- Gu et al. (2013) D. Gu, J. Randa, R. Billinger, and D. K. Walker, “Measurement and uncertainty analysis of a cryogenic low-noise amplifier with noise temperature below 2 K,” Radio Science 48, 344–351 (2013).
- Finger and Kerr (2008) R. Finger and A. R. Kerr, “Microwave loss reduction in cryogenically cooled conductors,” Int. J. Infrared Milli. Waves 29, 924–932 (2008).
- Engert, Heyer, and Fischer (2013) J. Engert, D. Heyer, and J. Fischer, “Low-temperature thermometry below 1 k at ptb,” AIP Conference Proceedings 1552, 136–141 (2013), https://aip.scitation.org/doi/pdf/10.1063/1.4819528 .
- Engert et al. (2016) J. Engert, A. Kirste, A. Shibahara, A. Casey, L. V. Levitin, J. Saunders, O. Hahtela, A. Kemppinen, E. Mykkänen, M. Prunnila, D. Gunnarsson, L. Roschier, M. Meschke, and J. Pekola, “New Evaluation of from 0.02 K to 1 K by Independent Thermodynamic Methods,” Int J Thermophys 37, 125 (2016).
- Pobell (2007) F. Pobell, Matter and Methods at Low Temperatures, 3rd ed. (Springer-Verlag, Berlin Heidelberg, 2007).
- DeBry and Lafyatis (2018) K. DeBry and G. Lafyatis, “Note: Electroplating process for connectorizing superconducting nbti cables,” Rev. Sci. Instrum. 89, 076108 (2018), https://doi.org/10.1063/1.5030431 .
- Bachmann et al. (1972) R. Bachmann, F. J. DiSalvo, T. H. Geballe, R. L. Greene, R. E. Howard, C. N. King, H. C. Kirsch, K. N. Lee, R. E. Schwall, H.-U. Thomas, and R. B. Zubeck, “Heat Capacity Measurements on Small Samples at Low Temperatures,” Rev. Sci. Instrum. 43, 205–214 (1972).
- Ranzani et al. (2013) L. Ranzani, L. Spietz, Z. Popovic, and J. Aumentado, “Two-port microwave calibration at millikelvin temperatures,” Rev. Sci. Instrum. 84, 034704 (2013).
- Yeh and Anlage (2013) J.-H. Yeh and S. M. Anlage, “In situ broadband cryogenic calibration for two-port superconducting microwave resonators,” Rev. Sci. Instrum. 84, 034706 (2013), https://doi.org/10.1063/1.4797461 .
- Clerk et al. (2010) A. A. Clerk, M. H. Devoret, S. M. Girvin, F. Marquardt, and R. J. Schoelkopf, “Introduction to quantum noise, measurement, and amplification,” Rev. Mod. Phys. 82, 1155–1208 (2010).
- Grönberg et al. (2017) L. Grönberg, M. Kiviranta, V. Vesterinen, J. Lehtinen, S. Simbierowicz, J. Luomahaara, M. Prunnila, and J. Hassel, “Side-wall spacer passivated sub-m Josephson junction fabrication process,” Supercond. Sci. Technol. 30, 125016 (2017).
- Caves (1982) C. M. Caves, “Quantum limits on noise in linear amplifiers,” Phys. Rev. D 26, 1817–1839 (1982).
- O’Brien et al. (2014) K. O’Brien, C. Macklin, I. Siddiqi, and X. Zhang, “Resonant Phase Matching of Josephson Junction Traveling Wave Parametric Amplifiers,” Phys. Rev. Lett. 113, 157001 (2014).