Low frequency radio observations of the ‘quiet’ corona during the descending phase of sunspot cycle 24
Abstract
We carried out a statistical study of the ‘quiet’ solar corona during the descending phase of the sunspot cycle 24 (i.e. 2015 January - 2019 May) using data obtained with the Gauribidanur RAdioheliograPH (GRAPH) at 53 MHz and 80 MHz simultaneously. Our results show that the equatorial (east-west) diameters of the solar corona at the above two frequencies shrunk steadily. The decrease was found to be due to a gradual reduction in the coronal electron density (). Independent estimates of in the equatorial region of the ‘background’ corona using white-light coronagraph observations indicate a decline consistent with our findings.
Geophysical Research Letters
Indian Institute of Astrophysics, Koramangala 2nd Block, Bangalore, Karnataka, India - 560034 Sir Parashurambhau College, Pune, Maharashtra, India - 411 030 Skolkovo Institute of Science and Technology, 3, Nobel Street, Moscow - 121205, Russian Federation Department of Physics, University of Helsinki, P.O. Box 64, FI-00014 Helsinki, Finland
R. Rameshramesh@iiap.res.in
We investigated the equatorial diameter of ‘quiet’ solar corona at low radio frequencies during the descending phase of sunspot cycle 24.
Localized sources of emission in the radio images were identified and removed using iterative multi-Gaussian curve fitting technique.
The minimum radius of the ‘quiet’ solar corona at a typical frequency like 53 MHz was found to be .
1 Introduction
One of the well established result from the white-light observations during total solar eclipses and with coronagraphs is that the shape/size and electron density of the corona varies with the sunspot cycle. This is because of the close correspondence between the coronal brightness and the electron density which in turn is an indicator of the coronal magnetic field (see for e.g. \citeAMacQueen2001. These studies were primarily about the ‘global’ corona which included structures like the coronal streamers also. We wanted to investigate the ‘quiet’ solar corona (i.e., the corona distinct from emission due to transient and long-lasting discrete sources) at radio frequencies during the sunspot cycle 24 since it could provide independent results related to the latter. Observations of thermal bremsstrahlung radio emission from the ‘quiet’ solar corona at frequencies 100 MHz are expected to be particularly useful in this connection since the radiation originates fully in the corona. The corona above the visible solar disk and off the solar limb can be simultaneously imaged. Hence the present work.
2 Observations
The radio observations were carried out using the facilities operated by the Indian Institute of Astrophysics (IIA) in the Gauribidanur observatory (\citeARamesh2011a,Ramesh2014; https://www.iiap.res.in/?q=centers/radio). Two-dimensional radio images obtained with the Gauribidanur RAdioheliograPH (GRAPH; \citeARamesh1998,Ramesh1999a,Ramesh2006b) at 80 MHz and 53 MHz during the period 2015 January - 2019 May were used. The GRAPH is a T-shaped long radio interferometer array and it has an angular resolution (‘beam’) of (R.A. decl.) and at the above two frequencies, respectively. The integration time is 250 msec and the observing bandwidth is 2 MHz. Observations are carried out everyday for 2.5 hr on either side of the transit of the Sun over the local meridian in Gauribidanur. However for the present work, we limited ourselves to the data obtained for a period of min around the transit. Since the source zenith angle will be the least during that time, any possible refraction effects due to the ionosphere are generally minimal [Stewart \BBA McLean (\APACyear1982), Jacobson \BOthers. (\APACyear1991), Mercier (\APACyear1996)]. Note that the local latitude of Gauribidanur is N. This is within the decl. range of S to N over which the Sun moves back and forth every year. So, even when the Sun is at decl., its elevation for GRAPH would be high (). For radio spectral data, we used observations with the Gauribidanur LOw-frequency Solar Spectrograph (GLOSS; \citeAEbenezer2001,Ebenezer2007,Kishore2014,Hariharan2016b), Gauribidanur RAdio Spectro-Polarimeter (GRASP; \citeASasi2013a,Kishore2015,Hariharan2015), and e-CALLISTO [Monstein \BOthers. (\APACyear2007), Benz \BOthers. (\APACyear2009)]. We also used data obtained with the Gauribidanur Radio Interferometric Polarimeter (GRIP; \citeARamesh2008). The combined use of the aforementioned imaging, spectral, and polarimetric data help to understand the radio signatures associated with the corresponding solar activity in a better manner (see for e.g. \citeASasikumar2013b). The optical data were obtained in white-light with the COR1 coronagraph of the Sun-Earth Connection Coronal and Heliospheric Investigation (SECCHI; \citeAHoward2008) on board the Solar Terrestrial Relationship Observatory-A (STEREO-A, https://cor1.gsfc.nasa.gov/).
The GRAPH data were carefully selected such that: (i) no H and/or X-ray flares, coronal mass ejections (CMEs), and short/long duration non-thermal radio burst activities were reported during our observing period as well as for 30 min before and after (ftp://ftp.swpc.noaa.gov/pub/warehouse; http://sidc.oma.be/cactus/). In addition to the above, we verified the presence/absence of radio burst activities using data obtained with GLOSS, GRASP and e-CALLISTO also. Observations with the GRIP were particularly useful to verify the presence/absence of discrete sources of weak non-thermal emission like noise storm continuum on any given day via their circularly polarized radio emission and accordingly select the GRAPH data (see for e.g. \citeARamesh2011b,Mugundhan2018b,McCauley2019). Note that observations with a correlation radio interferometer with mutually perpendicular linearly polarized antennas as in GRIP are sensitive for circular polarization measurements (see for e.g. \citeAThompson2001). With all the aforementioned checks, we unambiguously identified GRAPH observations of ‘quiet’ Sun for 494 days; (ii) the spectral index between 53 MHz and 80 MHz is expected to be in the range +1.6 to +3.9 for thermal emission from the solar corona [Erickson \BOthers. (\APACyear1977), Subramanian \BBA Sastry (\APACyear1988), Ramesh \BOthers. (\APACyear2000), Ramesh, Nataraj\BCBL \BOthers. (\APACyear2006), Oberoi \BOthers. (\APACyear2017)]. But we considered only observations with spectral index from the aforementioned 494 days of observations to minimize confusion due to possible contribution of non-thermal emission and/or temperature gradients in the corona (see for e.g. \citeASubramanian1988). This resulted in 382 days of concurrent data at the two frequencies for further analysis.
3 The Method
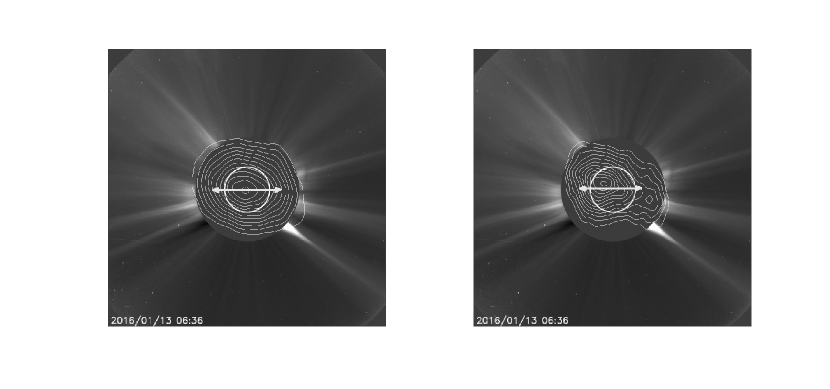
We wanted to investigate the size of the ‘quiet’ solar corona by measuring its equatorial diameter at different epochs using two-dimensional (2D) radio imaging data obtained with the GRAPH. Note that we limited ourselves to diameter measurements since it is a directly observable quantity. The equatorial diameter was particularly chosen for the study due to the comparatively better and declination independent angular resolution of the GRAPH in the east-west direction. Further the polar diameter are generally biased by the equatorward extension of the polar coronal holes during the descending phase of a sunspot cycle [Hundhausen \BOthers. (\APACyear1981)]. To obtain the equatorial diameter, we determined the one-dimensional (1D) brightness distribution averaged over an angular width of centered on the solar equator (i.e. where the decl. co-ordinate in the y-axis is equal to the decl. of the Sun on that day) in the 2D images obtained with the GRAPH (see for e.g. Figure 1). Since the above angular width is small, the ‘critical’ plasma level (corresponding to any particular observing frequency) at different locations within the enclosed coronal regions can be assumed to be at the same heliocentric distance. Each 1D brightness distribution obtained as mentioned above was reproduced using an iterative multi-Gaussian least squares curve fitting technique as described in \citeARamesh2006a. The minimum width of each Gaussian profile was limited to , the smallest source size reported at frequencies 100 MHz [Ramesh \BOthers. (\APACyear1999\APACexlab\BCnt1), Ramesh \BBA Ebenezer (\APACyear2001), Ramesh \BBA Sastry (\APACyear2000), Kathiravan \BOthers. (\APACyear2011), Ramesh \BOthers. (\APACyear2012), Mugundhan \BOthers. (\APACyear2016), Mugundhan, Ramesh, Kathiravan, Gireesh, Kumari\BCBL \BOthers. (\APACyear2018)]. The typical discrete thermal sources in the above frequency range are mostly the radio counterparts of large scale structures like the coronal streamers and/or coronal holes. The source sizes are at 73.8 MHz [Kundu \BOthers. (\APACyear1977), Lantos \BOthers. (\APACyear1987), Schmahl \BOthers. (\APACyear1994)]. The above size measurements indicate that the angular resolutions of the GRAPH at 53 MHz and 80 MHz are reasonably sufficient to identify discrete sources of thermal radio emission at the respective frequencies in the present case. This is true even for weak noise storm continuum sources, the other suspected candidate of slowly varying emission at frequencies 100 MHz [Lantos (\APACyear1999)], since their angular size is at 73.8 MHz [Kundu \BBA Gopalswamy (\APACyear1990)].
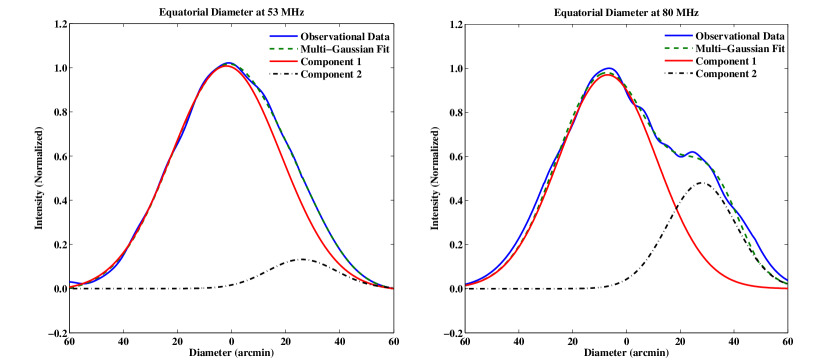
We also imposed the following conditions to consider the data obtained at a particular epoch for further analysis: (i) the fits for the 53 MHz and 80 MHz observations must have one Gaussian profile each with width and the width of the such a profile in the fit for the 53 MHz observations should be larger than the corresponding 80 MHz profile on the same day; (ii) the discrete solar radio sources identified from the fit should be present at both the frequencies; (iii) the sum of the amplitudes of the Gaussian profiles used to fit the observed 1D brightness distribution at any given position on the latter should be nearly equal to the observed amplitude there. These conditions further reduced our data set to 336 days (see Section 2). The iterative fit procedure was carried out till the difference in the amplitudes between the fit and the observations is 0.05 SFU (1 SFU=), the minimum detectable flux density with GRAPH. In addition to the Gaussian of width , we used a maximum of four additional Gaussians to get the best fit on any given day at each of the two frequencies.
The Gaussian profiles that satisfied the criteria (i) mentioned above were considered to represent the ‘background’ corona, and their actual widths in the respective fits were considered to be the equatorial diameters at the corresponding frequencies for the observations on a particular day. Assuming Gaussian shape for the GRAPH beam, we eliminated its contribution to the diameter estimate using the formula , where is the source size without beam contribution, is the estimated source size as described above, and is the beam size. An example of the diameter measurements using the above method is shown in Figure 2. There is excellent correspondence between the observations and the multi-Gaussian fit. Discrete sources close to the limb that are not so clearly discernible in the 2D radio images (for e.g. the source near the west limb in the 80 MHz image in Figure 1 is less prominent in the 53 MHz image) are also effectively identified and removed (see Figure 2). The incomplete removal of such sources could lead to a larger equatorial diameter.
A comparison of the radio and whitelight images in Figure 1 indicate that the radio contours are elongated in the east-west direction. This is predominantly due to enhanced radio emission associated with the multiple, closely spaced bright whitelight structures seen above the occulting disk of the coronagraph in the east and west directions. The contours appear smoothed because of the differences in angular resolution between radio and optical observations. An inspection of the near-Sun 1.05-3) whitelight coronagraph images (https://download.hao.ucar.edu/2016/01/12/20160113_020824_kcor_l1_cropped.gif) is in support of the above arguments. Note that SOHO/LASCO-C2 observations correspond to heliocentric distances and hence the structures are seen distinctly. The differences between the 53 MHz and 80 MHz images themselves are chiefly due to the comparitively higher angular resolution of the GRAPH at 80 MHz and scattering of radio waves by density inhomogeneities in the solar corona [Aubier \BOthers. (\APACyear1971), Thejappa \BBA Kundu (\APACyear1992), Ramesh (\APACyear2000)]. It was shown by \citeAThejappa2008 that positional displacements due to scattering could be at 50 MHz compared to 73.8 MHz. Earlier, \citeASastry1994 had reported observations of shift between the centroids of the ‘quiet’ Sun and the optical Sun. The ‘resolved’ discrete radio source near the west limb in the 80 MHz image as against the 53 MHz image, and the separation between the centroids of the ‘quiet’ Sun in the 53 MHz and 80 MHz images are consistent with the above arguments.
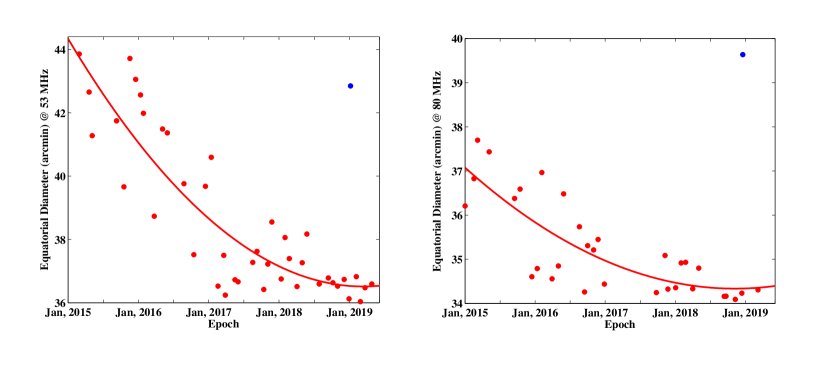
Figure 3 shows the monthly minimum values in the equatorial diameters of the solar corona at 53 MHz and 80 MHz during the period 2015 January - 2019 May estimated using the above methodology. The gap in the data points during 2017, particularly at 80 MHz, is due to the use of GRAPH for observations of background cosmic radio sources that are occulted by the solar corona at the above frequency (see for e.g. \citeASlee1961,Ramesh2001a,Sasikumar2016). We chose the monthly minimum values of the diameters since they are more likely to represent the ‘quiet’ solar corona which at low radio frequencies is supposed to be the corona that is nearly free of localized thermal and/or non-thermal sources (see for e.g. \citeALeblanc1969a).
4 Analysis and Results
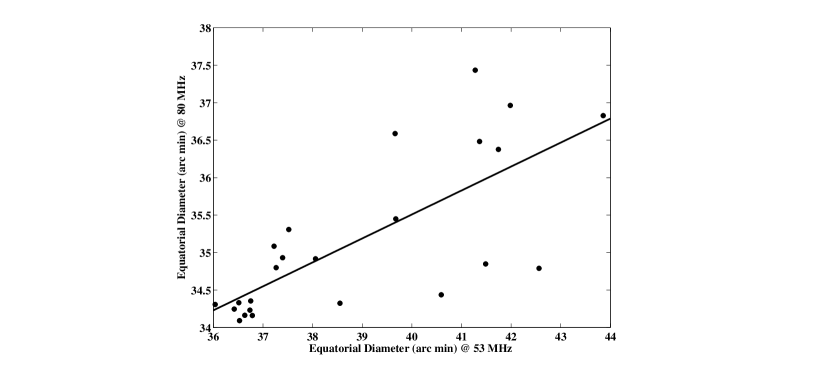
An inspection of Figure 3 and the quadratic least squares fits to the data points there reveals a gradual decrease in the equatorial diameters at both 53 MHz and 80 MHz from January 2015. There is a high degree of correlation (74%) between the diameter values at the above two frequencies (Figure 4). This indicates that the discrete sources have been uniformally identified and removed at both 53 MHz and 80 MHz. Note that if the diameters had been over estimated due to possible incomplete removal of the discrete sources, particularly near the limb(s), then the distribution of the monthly minimum diameter values at 53 MHz and 80 MHz could have been random instead of exhibiting a decreasing trend as mentioned above. These are in support of the methodology described in Section 3 to estimate the diameters in the present case.
The decrease in the diameter values at 53 MHz and 80 MHz in Figure 3 is an indication of the decrease in the heliocentric distances () of the ‘critical’ plasma levels corresponding to 53 MHz and 80 MHz in the solar atmosphere. It is well known that most of the observed thermal radio emission from the ‘quiet’ Sun at any given radio frequency () orginates only from the corresponding ‘critical’ level in the solar atmosphere. Since plasma frequency , and (where is the frequency of observation) at the critical ‘plasma’ level mentioned above, the aforementioned decreases indicate that there should have been a corresponding decrease in during the same interval. The quadratic least squares fits to the data points in Figure 3 indicate that the the 53 MHz equatorial diameter in 2019 January () is nearly same as the 80 MHz equatorial diameter in 2015 January. Since and , the above implies that at the corresponding heliocentric distance (i.e. 1.16) had decreased by a factor 2.3 between 2015 January and 2019 January. Comparing this with the published reports on in the equatorial region of the ‘quiet’ Sun, we find that appears to the lowest value ever reported at 1.16 (see for e.g. Figure 2 in \citeAWarmuth2005). This implies that radio emission at 53 MHz from the ‘quiet’ Sun originated at 1.16 during the minimum phase of sunspot cycle 24. Note that the average height of the coronal type II radio bursts during the declining phase of sunspot cycle 23 was found to be smaller compared to their average height during the maximum phase due to a similar decrease in [Gopalswamy \BOthers. (\APACyear2009)].
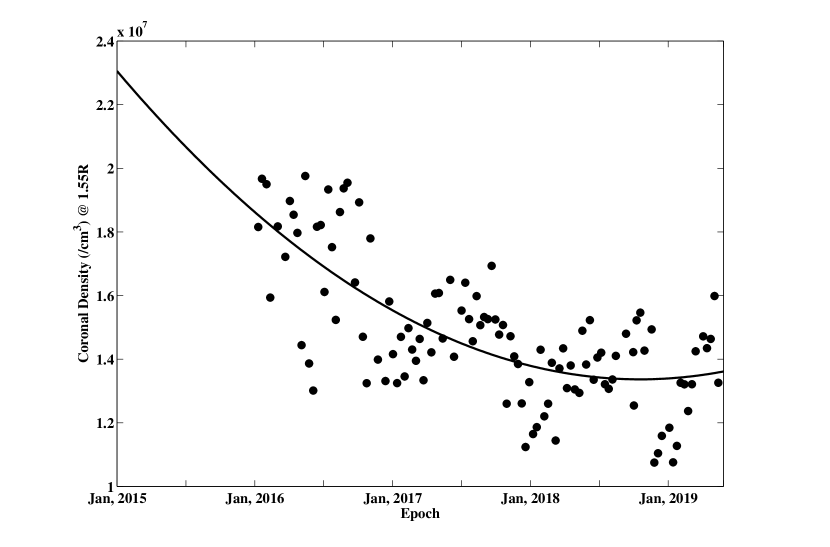
We verified the aforementioned decrease in during the descending phase of sunspot cycle 24 by independently estimating at 1.55 in the equatorial region of the ‘quiet’ corona using the linearly polarized brightness (pB) measurements with STEREO-A/COR1 (http://sd-www.jhuapl.edu/secchi/lz/L0/a/seq/) and the inversion technique based on spherically symmetric polynomial approximation (SSPA; \citeAWang2014,Wang2017; solar.physics.montana.edu/wangtj/sspa.tar). The estimates were obtained at 1.55 since it is the nearest distance to/above the STEREO-A/COR1 occulting disk (radius1.4) which is close to the equatorial diameters indicated by the overall fits in Figure 3. A set of three STEREO-A/COR1 images taken sequentially around 06:30 UT with the linear polarizer at angles , , and with respect to the reference direction were used to construct the pB image. The time interval between the image obtained at each of the aforementioned positions of the polarizer is 9 sec. Note that STEREO-A/COR1 pB images obtained at a different time on the same day could have also been used since our interest is mainly in the ‘quiet’ corona whose characteristics like generally vary on comparitively longer time scales only. Note that there was no data available from STEREO spacecraft for 2015 January - 2015 December as it passed behind the Sun. So we used 2016 January - 2019 May data. We analysed data obtained on three different days each month, with an interval of 10 days, during the above period. The images were processed to align with the solar North, and calibrated to remove the instrumental scattered light. The background was subtracted using data derived from a complete solar rotation. We used SSPA to obtain 2D maps of along the equator, i.e. at position angles (PA) and . We averaged the from PA and at 1.55 to reduce the variation in .
Figure 5 shows the values thus obtained on 117 different days during interval 2016 January - 2019 May when there were no coronal streamers and/or coronal holes in the above PA range. The scatter in the estimates are mostly due to the assumption of spherically symmetric approximation for the inversion and the errors associated with instrumental background subtraction due to bad pixels in the detector. The quadratic least squares fit to the data points in Figure 5 indicates a decreasing trend in . The maximum and minimum values of obtained from the fit are (2015 January) and (2019 January), respectively. This implies that had decreased by a factor of 1.8 at 1.55 in the above interval during the descending phase of sunspot cycle 24. This is reasonably consistent with the decrease in estimated from the GRAPH observations at 1.16 (see Figure 3). The nearly equal factor by which has decreased at two different heliocentric distances suggest an overall decline in .
5 Summary
We investigated the changes in the size of the solar corona during the period 2015 January - 2019 May (descending phase of sunspot cycle 24) using data obtained with the GRAPH at 53 MHz and 80 MHz. Our results indicate that the heliocentric distances at which radio emission at the above two frequencies orginate in the equatorial region of the ‘quiet’ solar corona gradually decreased during the said period due to a decrease in . We independently verified the latter using white-light coronagraph estimates of in the equatorial region of ‘background’ corona that was devoid of coronal streamers and/or coronal holes.
Acknowledgements.
We are indebted to the staff of the Gauribidanur observatory for their help in maintenance of the antenna/receiver systems, and the observations. The STEREO/SECCHI data used here are produced by an international consortium of the Naval Research Laboratory (USA), Lockheed Martin Solar and Astrophysics Lab (USA), NASA Goddard Space Flight Center (USA), Rutherford Appleton Laboratory (UK), University of Birmingham (UK), Max-Planck-Institut für Sonnensystemforschung (Germany), Centre Spatiale de Liége (Belgium), Institut d’Optique Théorique et Appliquée (France), and Institut d’Astrophysique Spatiale (France). The white-light values reported are due to the code developed by T.J.Wang for STEREO-COR1 pB observations. The SOHO data are produced by a consortium of the Naval Research Laboratory (USA), Max-Planck-Institut fuer Aeronomie (Germany), Laboratoire d’Astronomie (France), and the University of Birmingham (UK). SOHO is a project of international cooperation between ESA and NASA. One of the authors (AK) acknowledges the European Research Council (ERC) under the European Union’s Horizon 2020 Research and Innovation Programme Project SolMAG 724391. A. Kumari, D. Ketaki, and M. Vrunda were at the Gauribidanur observatory when the work was carried out. Data used in the study are available at https://www.iiap.res.in/gauribidanur/home.html. We thank the referees for their comments which helped us to present the results in a better manner.References
- Aubier \BOthers. (\APACyear1971) \APACinsertmetastarAubier1971{APACrefauthors}Aubier, M., Leblanc, Y.\BCBL \BBA Boischot, A. \APACrefYearMonthDay1971. \BBOQ\APACrefatitleObservations of the Quiet Sun at Decameter Wavelengths - Effects of Scattering on the Brightness Distribution Observations of the Quiet Sun at Decameter Wavelengths - Effects of Scattering on the Brightness Distribution.\BBCQ \APACjournalVolNumPagesAstron. Astrophys.12435-441. \PrintBackRefs\CurrentBib
- Benz \BOthers. (\APACyear2009) \APACinsertmetastarBenz2009{APACrefauthors}Benz, A\BPBIO., Monstein, C., Meyer, H., Manoharan, P\BPBIK., Ramesh, R., Altyntsev, A.\BDBLCho, K\BHBIS. \APACrefYearMonthDay2009. \BBOQ\APACrefatitleA World-Wide Net of Solar Radio Spectrometers: e-CALLISTO A World-Wide Net of Solar Radio Spectrometers: e-CALLISTO.\BBCQ \APACjournalVolNumPagesEarth, Moon and Planets104277-285. {APACrefDOI} 10.1007/s11038-008-9267-6 \PrintBackRefs\CurrentBib
- Ebenezer \BOthers. (\APACyear2001) \APACinsertmetastarEbenezer2001{APACrefauthors}Ebenezer, E., Ramesh, R., Subramanian, K\BPBIR., Sundara Rajan, M\BPBIS.\BCBL \BBA Sastry, C\BPBIV. \APACrefYearMonthDay2001. \BBOQ\APACrefatitleA new digital spectrograph for observations of radio burst emission from the Sun A new digital spectrograph for observations of radio burst emission from the Sun.\BBCQ \APACjournalVolNumPagesAstron. Astrophys.3671112-1116. {APACrefDOI} 10.1051/0004-6361:20000540 \PrintBackRefs\CurrentBib
- Ebenezer \BOthers. (\APACyear2007) \APACinsertmetastarEbenezer2007{APACrefauthors}Ebenezer, E., Subramanian, K\BPBIR., Ramesh, R., Sundara Rajan, M\BPBIS.\BCBL \BBA Kathiravan, C. \APACrefYearMonthDay2007. \BBOQ\APACrefatitleGauribidanur radio array solar spectrograph (GRASS) Gauribidanur radio array solar spectrograph (GRASS).\BBCQ \APACjournalVolNumPagesBull. Astron. Soc. India35111-119. \PrintBackRefs\CurrentBib
- Erickson \BOthers. (\APACyear1977) \APACinsertmetastarErickson1977{APACrefauthors}Erickson, W\BPBIC., Gergely, T\BPBIE., Kundu, M\BPBIR.\BCBL \BBA Mahoney, M\BPBIJ. \APACrefYearMonthDay1977. \BBOQ\APACrefatitleDetermination of the decameter wavelength spectrum of the quiet Sun Determination of the decameter wavelength spectrum of the quiet Sun.\BBCQ \APACjournalVolNumPagesSolar Phys.5457-63. {APACrefDOI} 10.1007/BF00146425 \PrintBackRefs\CurrentBib
- Gopalswamy \BOthers. (\APACyear2009) \APACinsertmetastarGopalswamy2009{APACrefauthors}Gopalswamy, N., Thompson, W\BPBIT., Davila, J\BPBIM., Kaiser, M\BPBIL., Yashiro, S., Mäkelä, P.\BDBLHoward, R\BPBIA. \APACrefYearMonthDay2009\APACmonth10. \BBOQ\APACrefatitleRelation Between Type II Bursts and CMEs Inferred from STEREO Observations Relation Between Type II Bursts and CMEs Inferred from STEREO Observations.\BBCQ \APACjournalVolNumPagesSolar Phys.259227. {APACrefDOI} 10.1007/s11207-009-9382-1 \PrintBackRefs\CurrentBib
- Hariharan \BOthers. (\APACyear2015) \APACinsertmetastarHariharan2015{APACrefauthors}Hariharan, K., Ramesh, R.\BCBL \BBA Kathiravan, C. \APACrefYearMonthDay2015. \BBOQ\APACrefatitleObservations of Near-Simultaneous Split-Band Solar Type-II Radio Bursts at Low Frequencies Observations of Near-Simultaneous Split-Band Solar Type-II Radio Bursts at Low Frequencies.\BBCQ \APACjournalVolNumPagesSolar Phys.2902479-2489. {APACrefDOI} 10.1007/s11207-015-0761-5 \PrintBackRefs\CurrentBib
- Hariharan \BOthers. (\APACyear2016b) \APACinsertmetastarHariharan2016b{APACrefauthors}Hariharan, K., Ramesh, R., Kathiravan, C., Abhilash, H\BPBIN.\BCBL \BBA Rajalingam, M. \APACrefYearMonthDay2016b. \BBOQ\APACrefatitleHigh Dynamic Range Observations of Solar Coronal Transients at Low Radio Frequencies with a Spectro-correlator High Dynamic Range Observations of Solar Coronal Transients at Low Radio Frequencies with a Spectro-correlator.\BBCQ \APACjournalVolNumPagesAstrophys. J. Suppl.22221. {APACrefDOI} 10.3847/0067-0049/222/2/21 \PrintBackRefs\CurrentBib
- Howard \BOthers. (\APACyear2008) \APACinsertmetastarHoward2008{APACrefauthors}Howard, R\BPBIA., Moses, J\BPBID., Vourlidas, A., Newmark, J\BPBIS., Socker, D\BPBIG., Plunkett, S\BPBIP.\BDBLCarter, T. \APACrefYearMonthDay2008. \BBOQ\APACrefatitleSun Earth Connection Coronal and Heliospheric Investigation (SECCHI) Sun Earth Connection Coronal and Heliospheric Investigation (SECCHI).\BBCQ \APACjournalVolNumPagesSpace Sci. Rev.13667-115. {APACrefDOI} 10.1007/s11214-008-9341-4 \PrintBackRefs\CurrentBib
- Hundhausen \BOthers. (\APACyear1981) \APACinsertmetastarHundhausen1981{APACrefauthors}Hundhausen, A\BPBIJ., Hansen, R\BPBIT.\BCBL \BBA Hansen, S\BPBIF. \APACrefYearMonthDay1981. \BBOQ\APACrefatitleCoronal evolution during the sunspot cycle: Coronal holes observed with the Mauna Loa K-coronameters Coronal evolution during the sunspot cycle: Coronal holes observed with the Mauna Loa K-coronameters.\BBCQ \APACjournalVolNumPagesJ. Geophys. Res.862079-2094. {APACrefDOI} 10.1029/JA086iA04p02079 \PrintBackRefs\CurrentBib
- Jacobson \BOthers. (\APACyear1991) \APACinsertmetastarJacobson1991{APACrefauthors}Jacobson, A\BPBIR., Massey, R\BPBIS.\BCBL \BBA Erickson, W\BPBIC. \APACrefYearMonthDay1991. \BBOQ\APACrefatitleA study of transionospheric refraction of radio waves using the Clark Lake Radio Observatory A study of transionospheric refraction of radio waves using the Clark Lake Radio Observatory.\BBCQ \APACjournalVolNumPagesAnn. Geophysicae9546-552. \PrintBackRefs\CurrentBib
- Kathiravan \BOthers. (\APACyear2011) \APACinsertmetastarKathiravan2011{APACrefauthors}Kathiravan, C., Ramesh, R., Indrajit V. Barve.\BCBL \BBA Rajalingam, M. \APACrefYearMonthDay2011. \BBOQ\APACrefatitleRadio Observations of the Solar Corona During an Eclipse Radio Observations of the Solar Corona During an Eclipse.\BBCQ \APACjournalVolNumPagesAstrophys. J.73091. {APACrefDOI} 10.1088/0004-637X/730/2/91 \PrintBackRefs\CurrentBib
- Kishore \BOthers. (\APACyear2014) \APACinsertmetastarKishore2014{APACrefauthors}Kishore, P., Kathiravan, C., Ramesh, R., Rajalingam, M.\BCBL \BBA Indrajit V. Barve. \APACrefYearMonthDay2014. \BBOQ\APACrefatitleGauribidanur Low-Frequency Solar Spectrograph Gauribidanur Low-Frequency Solar Spectrograph.\BBCQ \APACjournalVolNumPagesSolar Phys.2893995-4005. {APACrefDOI} 10.1007/s11207-014-0539-1 \PrintBackRefs\CurrentBib
- Kishore \BOthers. (\APACyear2015) \APACinsertmetastarKishore2015{APACrefauthors}Kishore, P., Ramesh, R., Kathiravan, C.\BCBL \BBA Rajalingam, M. \APACrefYearMonthDay2015. \BBOQ\APACrefatitleA Low-Frequency Radio Spectropolarimeter for Observations of the Solar Corona A Low-Frequency Radio Spectropolarimeter for Observations of the Solar Corona.\BBCQ \APACjournalVolNumPagesSolar Phys.2902409-2422. {APACrefDOI} 10.1007/s11207-015-0705-0 \PrintBackRefs\CurrentBib
- Kundu \BOthers. (\APACyear1977) \APACinsertmetastarKundu1977{APACrefauthors}Kundu, M\BPBIR., Gergely, T\BPBIE.\BCBL \BBA Erickson, W\BPBIC. \APACrefYearMonthDay1977. \BBOQ\APACrefatitleObservations of the quiet Sun at meter and decameter wavelengths Observations of the quiet Sun at meter and decameter wavelengths.\BBCQ \APACjournalVolNumPagesSolar Phys.53489-496. {APACrefDOI} 10.1007/BF00160291 \PrintBackRefs\CurrentBib
- Kundu \BBA Gopalswamy (\APACyear1990) \APACinsertmetastarKundu1990{APACrefauthors}Kundu, M\BPBIR.\BCBT \BBA Gopalswamy, N. \APACrefYearMonthDay1990. \BBOQ\APACrefatitleFilament Eruption and Storm Radiation at Meter / Decameter Wavelengths Filament Eruption and Storm Radiation at Meter / Decameter Wavelengths.\BBCQ \APACjournalVolNumPagesSolar Phys.129133-152. {APACrefDOI} 10.1007/BF00154370 \PrintBackRefs\CurrentBib
- Lantos (\APACyear1999) \APACinsertmetastarLantos1999b{APACrefauthors}Lantos, P. \APACrefYearMonthDay1999. \BBOQ\APACrefatitleLow Frequency Observations of the Quiet Sun: a Review Low Frequency Observations of the Quiet Sun: a Review.\BBCQ \BIn T. Bastian, N. Gopalswamy\BCBL \BBA K. Shibasaki (\BEDS), \APACrefbtitleSolar Physics with Radio Observations Solar physics with radio observations (\BVOL 479, \BPG 11-24). \PrintBackRefs\CurrentBib
- Lantos \BOthers. (\APACyear1987) \APACinsertmetastarLantos1987{APACrefauthors}Lantos, P., Alissandrakis, C\BPBIE., Gergely, T\BPBIE.\BCBL \BBA Kundu, M\BPBIR. \APACrefYearMonthDay1987. \BBOQ\APACrefatitleQuiet Sun and Slowly Varying Component at Meter and Decameter Wavelengths Quiet Sun and Slowly Varying Component at Meter and Decameter Wavelengths.\BBCQ \APACjournalVolNumPagesSolar Phys.112325-340. {APACrefDOI} 10.1007/BF00148787 \PrintBackRefs\CurrentBib
- Leblanc \BBA Le Squeren (\APACyear1969) \APACinsertmetastarLeblanc1969a{APACrefauthors}Leblanc, Y.\BCBT \BBA Le Squeren, A\BPBIM. \APACrefYearMonthDay1969. \BBOQ\APACrefatitleDimensions, Temperature and Electron Density of the Quiet Corona Dimensions, Temperature and Electron Density of the Quiet Corona.\BBCQ \APACjournalVolNumPagesAstron. Astrophys.1239-248. \PrintBackRefs\CurrentBib
- MacQueen \BOthers. (\APACyear2001) \APACinsertmetastarMacQueen2001{APACrefauthors}MacQueen, R\BPBIM., Burkepile, J\BPBIT., Holzer, T\BPBIE., Stanger, A\BPBIL.\BCBL \BBA Spence, K\BPBIE. \APACrefYearMonthDay2001\APACmonth03. \BBOQ\APACrefatitleSolar Coronal Brightness Changes and Mass Ejections during Solar Cycle 22 Solar Coronal Brightness Changes and Mass Ejections during Solar Cycle 22.\BBCQ \APACjournalVolNumPagesAstrophys. J.5491175-1182. {APACrefDOI} 10.1086/319464 \PrintBackRefs\CurrentBib
- McCauley \BOthers. (\APACyear2019) \APACinsertmetastarMcCauley2019{APACrefauthors}McCauley, P\BPBII., Cairns, I\BPBIH., White, S\BPBIM., Mondal, S., Lenc, E., Morgan, J.\BCBL \BBA Oberoi, D. \APACrefYearMonthDay2019. \BBOQ\APACrefatitleThe Low-Frequency Solar Corona in Circular Polarization The Low-Frequency Solar Corona in Circular Polarization.\BBCQ \APACjournalVolNumPagesSolar Phys.294106. {APACrefDOI} 10.1007/s11207-019-1502-y \PrintBackRefs\CurrentBib
- Mercier (\APACyear1996) \APACinsertmetastarMercier1996{APACrefauthors}Mercier, C. \APACrefYearMonthDay1996. \BBOQ\APACrefatitleSome characteristics of atmospheric gravity waves observed by radio interferometry Some characteristics of atmospheric gravity waves observed by radio interferometry.\BBCQ \APACjournalVolNumPagesAnn. Geophysicae1442-58. {APACrefDOI} 10.1007/s00585-996-0042-6 \PrintBackRefs\CurrentBib
- Monstein \BOthers. (\APACyear2007) \APACinsertmetastarMonstein2007{APACrefauthors}Monstein, C., Ramesh, R.\BCBL \BBA Kathiravan, C. \APACrefYearMonthDay2007. \BBOQ\APACrefatitleRadio spectrum measurements at the Gauribidanur observatory Radio spectrum measurements at the Gauribidanur observatory.\BBCQ \APACjournalVolNumPagesBull. Astron. Soc. India35473-480. \PrintBackRefs\CurrentBib
- Mugundhan \BOthers. (\APACyear2016) \APACinsertmetastarMugundhan2016{APACrefauthors}Mugundhan, V., Ramesh, R., Indrajit V. Barve., Kathiravan, C., Gireesh, G\BPBIV\BPBIS., Kharb, P.\BCBL \BBA Misra, A. \APACrefYearMonthDay2016. \BBOQ\APACrefatitleLow-Frequency Radio Observations of the Solar Corona with Arcminute Angular Resolution: Implications for Coronal Turbulence and Weak Energy Releases Low-Frequency Radio Observations of the Solar Corona with Arcminute Angular Resolution: Implications for Coronal Turbulence and Weak Energy Releases.\BBCQ \APACjournalVolNumPagesAstrophys. J.831154. {APACrefDOI} 10.3847/0004-637X/831/2/154 \PrintBackRefs\CurrentBib
- Mugundhan, Ramesh, Kathiravan, Gireesh\BCBL \BBA Hegde (\APACyear2018) \APACinsertmetastarMugundhan2018b{APACrefauthors}Mugundhan, V., Ramesh, R., Kathiravan, C., Gireesh, G.\BCBL \BBA Hegde, A. \APACrefYearMonthDay2018. \BBOQ\APACrefatitleSpectropolarimetric Observations of Solar Noise Storms at Low Frequencies Spectropolarimetric Observations of Solar Noise Storms at Low Frequencies.\BBCQ \APACjournalVolNumPagesSolar Phys.29341. {APACrefDOI} 10.1007/s11207-018-1260-2 \PrintBackRefs\CurrentBib
- Mugundhan, Ramesh, Kathiravan, Gireesh, Kumari\BCBL \BOthers. (\APACyear2018) \APACinsertmetastarMugundhan2018a{APACrefauthors}Mugundhan, V., Ramesh, R., Kathiravan, C., Gireesh, G\BPBIV\BPBIS., Kumari, A., Hariharan, K.\BCBL \BBA Indrajit V. Barve. \APACrefYearMonthDay2018. \BBOQ\APACrefatitleThe First Low-frequency Radio Observations of the Solar Corona on ?200 km Long Interferometer Baseline The First Low-frequency Radio Observations of the Solar Corona on ?200 km Long Interferometer Baseline.\BBCQ \APACjournalVolNumPagesAstrophys. J. Lett.855L8. {APACrefDOI} 10.3847/2041-8213/aaaf64 \PrintBackRefs\CurrentBib
- Oberoi \BOthers. (\APACyear2017) \APACinsertmetastarOberoi2017{APACrefauthors}Oberoi, D., Sharma, R.\BCBL \BBA Rogers, A\BPBIE\BPBIE. \APACrefYearMonthDay2017. \BBOQ\APACrefatitleEstimating Solar Flux Density at Low Radio Frequencies Using a Sky Brightness Model Estimating Solar Flux Density at Low Radio Frequencies Using a Sky Brightness Model.\BBCQ \APACjournalVolNumPagesSolar Phys.29275. {APACrefDOI} 10.1007/s11207-017-1096-1 \PrintBackRefs\CurrentBib
- Ramesh (\APACyear2000) \APACinsertmetastarRamesh2000a{APACrefauthors}Ramesh, R. \APACrefYearMonthDay2000. \BBOQ\APACrefatitleLow Frequency Radio Emission from the ’Quiet Sun’ Low Frequency Radio Emission from the ’Quiet Sun’.\BBCQ \APACjournalVolNumPagesJ. Astrophys. Astron.21237-240. {APACrefDOI} 10.1007/BF02702398 \PrintBackRefs\CurrentBib
- Ramesh (\APACyear2011) \APACinsertmetastarRamesh2011a{APACrefauthors}Ramesh, R. \APACrefYearMonthDay2011. \BBOQ\APACrefatitleLow frequency solar radio astronomy at the Indian Institute of Astrophysics Low frequency solar radio astronomy at the Indian Institute of Astrophysics.\BBCQ \BIn A\BPBIR. Choudhuri \BBA D. Banerjee (\BEDS), \APACrefbtitle1st Asia-Pacific Sol. Phys. Meeting 1st asia-pacific sol. phys. meeting (\BVOL 2, \BPG 55-61). \PrintBackRefs\CurrentBib
- Ramesh (\APACyear2014) \APACinsertmetastarRamesh2014{APACrefauthors}Ramesh, R. \APACrefYearMonthDay2014. \BBOQ\APACrefatitleSolar observations at low frequencies with the Gauribidanur radioheliograph Solar observations at low frequencies with the Gauribidanur radioheliograph.\BBCQ \BIn J\BPBIN. Chengalur \BBA Y. Gupta (\BEDS), \APACrefbtitleMetrewavelength Sky Metrewavelength sky (\BVOL 13, \BPG 19-24). \PrintBackRefs\CurrentBib
- Ramesh \BBA Ebenezer (\APACyear2001) \APACinsertmetastarRamesh2001b{APACrefauthors}Ramesh, R.\BCBT \BBA Ebenezer, E. \APACrefYearMonthDay2001. \BBOQ\APACrefatitleDecameter Wavelength Observations of an Absorption Burst from the Sun and Its Association with an X2.0/3B Flare and the Onset of a “Halo” Coronal Mass Ejection Decameter Wavelength Observations of an Absorption Burst from the Sun and Its Association with an X2.0/3B Flare and the Onset of a “Halo” Coronal Mass Ejection.\BBCQ \APACjournalVolNumPagesAstrophys. J. Lett.558L141-L143. {APACrefDOI} 10.1086/323498 \PrintBackRefs\CurrentBib
- Ramesh \BOthers. (\APACyear2012) \APACinsertmetastarRamesh2012b{APACrefauthors}Ramesh, R., Kathiravan, C., Indrajit V. Barve.\BCBL \BBA Rajalingam, M. \APACrefYearMonthDay2012. \BBOQ\APACrefatitleHigh Angular Resolution Radio Observations of a Coronal Mass Ejection Source Region at Low Frequencies during a Solar Eclipse High Angular Resolution Radio Observations of a Coronal Mass Ejection Source Region at Low Frequencies during a Solar Eclipse.\BBCQ \APACjournalVolNumPagesAstrophys. J.744165. {APACrefDOI} 10.1088/0004-637X/744/2/165 \PrintBackRefs\CurrentBib
- Ramesh \BOthers. (\APACyear2001) \APACinsertmetastarRamesh2001a{APACrefauthors}Ramesh, R., Kathiravan, C.\BCBL \BBA Sastry, C\BPBIV. \APACrefYearMonthDay2001\APACmonth02. \BBOQ\APACrefatitleLow-Frequency Radio Observations of the Angular Broadening of the Crab Nebula Due to a Coronal Mass Ejection Low-Frequency Radio Observations of the Angular Broadening of the Crab Nebula Due to a Coronal Mass Ejection.\BBCQ \APACjournalVolNumPagesAstrophys. J. Lett.548L229-L231. {APACrefDOI} 10.1086/319098 \PrintBackRefs\CurrentBib
- Ramesh \BOthers. (\APACyear2011) \APACinsertmetastarRamesh2011b{APACrefauthors}Ramesh, R., Kathiravan, C.\BCBL \BBA Satya Narayanan, A. \APACrefYearMonthDay2011. \BBOQ\APACrefatitleLow-frequency Observations of Polarized Emission from Long-lived Non-thermal Radio Sources in the Solar Corona Low-frequency Observations of Polarized Emission from Long-lived Non-thermal Radio Sources in the Solar Corona.\BBCQ \APACjournalVolNumPagesAstrophys. J.73439. {APACrefDOI} 10.1088/0004-637X/734/1/39 \PrintBackRefs\CurrentBib
- Ramesh \BOthers. (\APACyear2008) \APACinsertmetastarRamesh2008{APACrefauthors}Ramesh, R., Kathiravan, C., Sundara Rajan, M\BPBIS., Indrajit V. Barve\BCBL \BBA Sastry, C\BPBIV. \APACrefYearMonthDay2008. \BBOQ\APACrefatitleA Low-Frequency (30 - 110 MHz) Antenna System for Observations of Polarized Radio Emission from the Solar Corona A Low-Frequency (30 - 110 MHz) Antenna System for Observations of Polarized Radio Emission from the Solar Corona.\BBCQ \APACjournalVolNumPagesSolar Phys.253319-327. {APACrefDOI} 10.1007/s11207-008-9272-y \PrintBackRefs\CurrentBib
- Ramesh, Nataraj\BCBL \BOthers. (\APACyear2006) \APACinsertmetastarRamesh2006a{APACrefauthors}Ramesh, R., Nataraj, H\BPBIS., Kathiravan, C.\BCBL \BBA Sastry, C\BPBIV. \APACrefYearMonthDay2006. \BBOQ\APACrefatitleThe Equatorial Background Solar Corona during Solar Minimum The Equatorial Background Solar Corona during Solar Minimum.\BBCQ \APACjournalVolNumPagesAstrophys. J.648707-711. {APACrefDOI} 10.1086/505677 \PrintBackRefs\CurrentBib
- Ramesh \BBA Sastry (\APACyear2000) \APACinsertmetastarRamesh2000c{APACrefauthors}Ramesh, R.\BCBT \BBA Sastry, C\BPBIV. \APACrefYearMonthDay2000. \BBOQ\APACrefatitleRadio observations of a coronal mass ejection induced depletion in the outer solar corona Radio observations of a coronal mass ejection induced depletion in the outer solar corona.\BBCQ \APACjournalVolNumPagesAstron. Astrophys.358749-752. \PrintBackRefs\CurrentBib
- Ramesh \BOthers. (\APACyear1999\APACexlab\BCnt1) \APACinsertmetastarRamesh1999b{APACrefauthors}Ramesh, R., Subramanian, K\BPBIR.\BCBL \BBA Sastry, C\BPBIV. \APACrefYearMonthDay1999\BCnt1. \BBOQ\APACrefatitleEclipse Observations of Compact Sources in the Outer Solar Corona Eclipse Observations of Compact Sources in the Outer Solar Corona.\BBCQ \APACjournalVolNumPagesSolar Phys.18577-85. {APACrefDOI} 10.1023/A:1005149830652 \PrintBackRefs\CurrentBib
- Ramesh \BOthers. (\APACyear1999\APACexlab\BCnt2) \APACinsertmetastarRamesh1999a{APACrefauthors}Ramesh, R., Subramanian, K\BPBIR.\BCBL \BBA Sastry, C\BPBIV. \APACrefYearMonthDay1999\BCnt2. \BBOQ\APACrefatitlePhase calibration scheme for a “T” array Phase calibration scheme for a “T” array.\BBCQ \APACjournalVolNumPagesAstron. Astrophys. Suppl.139179-181. {APACrefDOI} 10.1051/aas:1999387 \PrintBackRefs\CurrentBib
- Ramesh \BOthers. (\APACyear2000) \APACinsertmetastarRamesh2000d{APACrefauthors}Ramesh, R., Subramanian, K\BPBIR.\BCBL \BBA Sastry, C\BPBIV. \APACrefYearMonthDay2000. \BBOQ\APACrefatitleEstimation of the altitude and electron density of a discrete source in the outer solar corona through low frequency radio observations Estimation of the altitude and electron density of a discrete source in the outer solar corona through low frequency radio observations.\BBCQ \APACjournalVolNumPagesAstrophys. Lett. & Comm.4093-102. \PrintBackRefs\CurrentBib
- Ramesh \BOthers. (\APACyear1998) \APACinsertmetastarRamesh1998{APACrefauthors}Ramesh, R., Subramanian, K\BPBIR., Sundara Rajan, M\BPBIS.\BCBL \BBA Sastry, C\BPBIV. \APACrefYearMonthDay1998. \BBOQ\APACrefatitleThe gauribidanur radioheliograph The gauribidanur radioheliograph.\BBCQ \APACjournalVolNumPagesSolar Phys.1812439–453. {APACrefDOI} 10.1023/A:1005075003370 \PrintBackRefs\CurrentBib
- Ramesh, Sundara Rajan\BCBL \BBA Sastry (\APACyear2006) \APACinsertmetastarRamesh2006b{APACrefauthors}Ramesh, R., Sundara Rajan, M\BPBIS.\BCBL \BBA Sastry, C\BPBIV. \APACrefYearMonthDay2006. \BBOQ\APACrefatitleThe 1024 channel digital correlator receiver of the Gauribidanur radioheliograph The 1024 channel digital correlator receiver of the Gauribidanur radioheliograph.\BBCQ \APACjournalVolNumPagesExp. Astron.2131-40. {APACrefDOI} 10.1007/s10686-006-9065-y \PrintBackRefs\CurrentBib
- Sasikumar Raja \BOthers. (\APACyear2016) \APACinsertmetastarSasikumar2016{APACrefauthors}Sasikumar Raja, K., Ingale, M., Ramesh, R., Subramanian, P., Manoharan, P\BPBIK.\BCBL \BBA Janardhan, P. \APACrefYearMonthDay2016\APACmonth12. \BBOQ\APACrefatitleAmplitude of solar wind density turbulence from 10 to 45 R? Amplitude of solar wind density turbulence from 10 to 45 R?.\BBCQ \APACjournalVolNumPagesJ. Geophys. Res.: Space Phys.12111605. {APACrefDOI} 10.1002/2016JA023254 \PrintBackRefs\CurrentBib
- Sasikumar Raja \BOthers. (\APACyear2013) \APACinsertmetastarSasi2013a{APACrefauthors}Sasikumar Raja, K., Kathiravan, C., Ramesh, R., Rajalingam, M.\BCBL \BBA Indrajit V. Barve. \APACrefYearMonthDay2013. \BBOQ\APACrefatitleDesign and Performance of a Low-frequency Cross-polarized Log-periodic Dipole Antenna Design and performance of a low-frequency cross-polarized log-periodic dipole antenna.\BBCQ \APACjournalVolNumPagesAstrophys. J. Suppl.20712. {APACrefDOI} 10.1088/0067-0049/207/1/2 \PrintBackRefs\CurrentBib
- Sasikumar Raja \BBA Ramesh (\APACyear2013) \APACinsertmetastarSasikumar2013b{APACrefauthors}Sasikumar Raja, K.\BCBT \BBA Ramesh, R. \APACrefYearMonthDay2013. \BBOQ\APACrefatitleLow-frequency Observations of Transient Quasi-periodic Radio Emission from the Solar Atmosphere Low-frequency Observations of Transient Quasi-periodic Radio Emission from the Solar Atmosphere.\BBCQ \APACjournalVolNumPagesAstrophys. J.77538. {APACrefDOI} 10.1088/0004-637X/775/1/38 \PrintBackRefs\CurrentBib
- Sastry (\APACyear1994) \APACinsertmetastarSastry1994{APACrefauthors}Sastry, C\BPBIV. \APACrefYearMonthDay1994. \BBOQ\APACrefatitleObservations of the Continuum Radio Emission from the Undisturbed Sun at a Wavelength of 8.7 meters Observations of the Continuum Radio Emission from the Undisturbed Sun at a Wavelength of 8.7 meters.\BBCQ \APACjournalVolNumPagesSolar Phys.150285-294. {APACrefDOI} 10.1007/BF00712890 \PrintBackRefs\CurrentBib
- Schmahl \BOthers. (\APACyear1994) \APACinsertmetastarSchmahl1994{APACrefauthors}Schmahl, E\BPBIJ., Gopalswamy, N.\BCBL \BBA Kundu, M\BPBIR. \APACrefYearMonthDay1994. \BBOQ\APACrefatitleThree Dimensional Coronal Structures Using Clark-Lake Observations Three Dimensional Coronal Structures Using Clark-Lake Observations.\BBCQ \APACjournalVolNumPagesSolar Phys.150325-337. {APACrefDOI} 10.1007/BF00712894 \PrintBackRefs\CurrentBib
- Slee (\APACyear1961) \APACinsertmetastarSlee1961{APACrefauthors}Slee, O\BPBIB. \APACrefYearMonthDay1961. \BBOQ\APACrefatitleObservations of the solar corona out to 100 solar radii Observations of the solar corona out to 100 solar radii.\BBCQ \APACjournalVolNumPagesMon. Not. Roy. Astron. Soc.123223. {APACrefDOI} 10.1093/mnras/123.3.223 \PrintBackRefs\CurrentBib
- Stewart \BBA McLean (\APACyear1982) \APACinsertmetastarStewart1982{APACrefauthors}Stewart, R\BPBIT.\BCBT \BBA McLean, D\BPBIJ. \APACrefYearMonthDay1982. \BBOQ\APACrefatitleCorrecting low-frequency solar radio source positions for ionospheric refraction Correcting low-frequency solar radio source positions for ionospheric refraction.\BBCQ \APACjournalVolNumPagesPubl. Astron. Soc. Aust.4386-389. \PrintBackRefs\CurrentBib
- Subramanian \BBA Sastry (\APACyear1988) \APACinsertmetastarSubramanian1988{APACrefauthors}Subramanian, K\BPBIR.\BCBT \BBA Sastry, C\BPBIV. \APACrefYearMonthDay1988. \BBOQ\APACrefatitleThe low-frequency radio spectrum of the continuum emission from the undisturbed sun The low-frequency radio spectrum of the continuum emission from the undisturbed sun.\BBCQ \APACjournalVolNumPagesJ. Astrophys. Astron.9225-229. {APACrefDOI} 10.1007/BF02715067 \PrintBackRefs\CurrentBib
- Thejappa \BBA Kundu (\APACyear1992) \APACinsertmetastarThejappa1992{APACrefauthors}Thejappa, G.\BCBT \BBA Kundu, M\BPBIR. \APACrefYearMonthDay1992. \BBOQ\APACrefatitleUnusually Low Coronal Radio Emission at the Solar Minimum Unusually Low Coronal Radio Emission at the Solar Minimum.\BBCQ \APACjournalVolNumPagesSolar Phys.14019-39. {APACrefDOI} 10.1086/528835 \PrintBackRefs\CurrentBib
- Thejappa \BBA MacDowall (\APACyear2008) \APACinsertmetastarThejappa2008{APACrefauthors}Thejappa, G.\BCBT \BBA MacDowall, R\BPBIJ. \APACrefYearMonthDay2008. \BBOQ\APACrefatitleEffects of Scattering on Radio Emission from the Quiet Sun at Low Frequencies Effects of Scattering on Radio Emission from the Quiet Sun at Low Frequencies.\BBCQ \APACjournalVolNumPagesAstrophys. J.6761338-1345. {APACrefDOI} 10.1086/528835 \PrintBackRefs\CurrentBib
- Thompson \BOthers. (\APACyear2001) \APACinsertmetastarThompson2001{APACrefauthors}Thompson, A\BPBIR., Moran, J\BPBIM.\BCBL \BBA Swenson Jr., G\BPBIW. \APACrefYearMonthDay2001. \BBOQ\APACrefatitleInterferometry and Synthesis in Radio Astronomy 2nd Edition Interferometry and Synthesis in Radio Astronomy 2nd Edition.\BBCQ \BIn \APACrefbtitleInterferometry and Synthesis in Radio Astronomy 2nd Edition Interferometry and synthesis in radio astronomy 2nd edition (\BPG 116). \APACaddressPublisherNewYork: Wiley-Interscience. \PrintBackRefs\CurrentBib
- Wang \BBA Davila (\APACyear2014) \APACinsertmetastarWang2014{APACrefauthors}Wang, T.\BCBT \BBA Davila, J\BPBIM. \APACrefYearMonthDay2014. \BBOQ\APACrefatitleValidation of Spherically Symmetric Inversion by Use of a Tomographically Reconstructed Three-Dimensional Electron Density of the Solar Corona Validation of Spherically Symmetric Inversion by Use of a Tomographically Reconstructed Three-Dimensional Electron Density of the Solar Corona.\BBCQ \APACjournalVolNumPagesSolar Phys.2893723-3745. {APACrefDOI} 10.1007/s11207-014-0556-0 \PrintBackRefs\CurrentBib
- Wang \BOthers. (\APACyear2017) \APACinsertmetastarWang2017{APACrefauthors}Wang, T., Reginald, N\BPBIL., Davila, J\BPBIM., St. Cyr, O\BPBIC.\BCBL \BBA Thompson, W\BPBIT. \APACrefYearMonthDay2017. \BBOQ\APACrefatitleVariation in Coronal Activity from Solar Cycle 24 Minimum to Maximum Using Three-Dimensional Reconstructions of the Coronal Electron Density from STEREO/COR1 Variation in Coronal Activity from Solar Cycle 24 Minimum to Maximum Using Three-Dimensional Reconstructions of the Coronal Electron Density from STEREO/COR1.\BBCQ \APACjournalVolNumPagesSolar Phys.29297. {APACrefDOI} 10.1007/s11207-017-1130-3 \PrintBackRefs\CurrentBib
- Warmuth \BBA Mann (\APACyear2005) \APACinsertmetastarWarmuth2005{APACrefauthors}Warmuth, A.\BCBT \BBA Mann, G. \APACrefYearMonthDay2005\APACmonth06. \BBOQ\APACrefatitleA model of the Alfvén speed in the solar corona A model of the Alfvén speed in the solar corona.\BBCQ \APACjournalVolNumPagesAstron. Astrophys.4351123-1135. {APACrefDOI} 10.1051/0004-6361:20042169 \PrintBackRefs\CurrentBib