Radiative feedback for supermassive star formation in a massive cloud with H2 molecules in an atomic-cooling halo
Abstract
Recent three-dimensional cosmological simulations of protogalaxy formation have suggested that supermassive stars (SMSs) can form in gas clouds in which H2 cooling is suppressed by dynamical heating prior to the activation of atomic cooling (Wise et al., 2019), but they stopped short of the following growth of a central protostar. Here we examine whether accretion on the protostellar core in this cloud is sufficiently rapid, in the face of the radiation feedback, to produce a SMS. We perform one-dimensional radiation-hydrodynamical simulations of the hot collapsing cloud with non-equilibrium chemical reactions directly adopting the cloud properties from Wise et al. (2019) as an initial condition. We find that the stellar Lyman-Werner (LW) radiation from the SMS dissociates H2 in the inner regions of the gas flow, increasing gas temperature and thermal pressure, and temporarily stopping the accretion. However, this negative feedback ceases when the self-gravity and inward ram pressure force on larger scales push the gas inward. The central protostar is unable to expand an Hii region due to the high density, and grows to a mass of . Our results suggests the successful formation of SMSs, and resulting massive () remnant black holes in the clouds, but need to be confirmed in two- or three-dimensional simulations.
keywords:
galaxies: star formation – stars: evolution – stars: formation – stars: protostars1 Introduction
Observations of distant quasars over the past two decades have shown that supermassive black holes (SMBHs) with masses exist at redshift (e.g., Fan et al., 2001; Mortlock et al., 2011; Wu et al., 2015; Matsuoka et al., 2016; Bañados et al., 2018; Reed et al., 2019; Onoue et al., 2019; Yang et al., 2020). The existence of these SMBHs means that a billion solar mass or more can rapidly accumulate in a small region within . The physical mechanism(s) for when and how this occurs remain unknown.
One of the SMBH formation scenarios is that they grow from low-mass black holes (BHs) with (see e.g. Inayoshi et al., 2019). There are several models for the formation of the small “seed” BHs. Population III (hereafter Pop III) stars with masses of (Hirano et al., 2014, 2015) gravitationally collapse at the end of their lives, leaving remnant BHs with masses of (Heger et al., 2003). More massive stars with can form through runaway stellar collisions in dense primordial star clusters (Sakurai et al., 2017; Boekholt et al., 2018; Reinoso et al., 2018; Sakurai et al., 2019; Tagawa et al., 2020). These stars gravitationally collapse to intermediate-mass BHs (IMBHs) with similar masses.
It has been pointed out that the subsequent growth of seed BHs through gas accretion can be suppressed by radiation feedback (Ciotti & Ostriker 2001; Milosavljević et al. 2009; Novak et al. 2011; Park & Ricotti 2011; but see also Inayoshi et al. 2016 for the possible solution with super-Eddington BH accretion). To alleviate the slow growth caused by this suppression, one possibility is the so-called “direct collapse”, in which larger seed BHs with masses are produced (Loeb & Rasio, 1994; Oh & Haiman, 2002; Bromm & Loeb, 2003; Begelman et al., 2006). In this model, a protostellar core forms in the center of a gas cloud surrounded by a dark matter halo with a virial mass of . These so-called “atomic cooling” haloes are larger than the “minihaloes” () where the first Pop III stars form. The gas in the atomic-cooling halo cools mostly via HI lines, and the central protostar can grow via rapid gas accretion into a supermassive star (SMS) with a mass . The SMS gravitationally collapses to a BH with a similar mass due to general relativistic instability (Umeda et al., 2016; Woods et al., 2017; Haemmerlé et al., 2018).
One of the conditions for SMS formation in atomic-cooling haloes is to avoid –cooling induced fragmentation. This can be achieved by irradiating the halo by an unusually strong external far-ultraviolet Lyman-Werner (LW) radiation emitted from nearby star-forming galaxies (Omukai, 2001; Dijkstra et al., 2008; Regan et al., 2014; Sugimura et al., 2014; Inayoshi et al., 2014; Becerra et al., 2015; Latif et al., 2016; Chon et al., 2016). A sufficiently intense LW radiation fully removes H2 molecules and suppresses H2 cooling in some rare situations: the halo has a nearby neighbouring halo with highly synchronised star-formation (Visbal et al., 2014; Regan et al., 2017), so that the LW radiation flux could exceed a critical flux (Wolcott-Green & Haiman, 2019). To form an atomic-cooling halo the gas in the halo also needs to remain extremely metal-poor. Moreover, the halo needs to be free from tidal force dispersion (e.g. Chon et al., 2016). If the H2 molecules are fully dissociated, the only effective coolant is atomic hydrogen. The gas temperature can not fall below , resulting in elevated sound speeds and higher accretion rates than in cooler gas in minihaloes.
In addition to radiative processes, the dynamical effect of collapsing gas into a massive DM halo as the halo is assembled is expected to play a crucial role on the formation of SMSs, by suppressing –cooling (Fernandez et al., 2014) and heating the halo gas via compression and shocks (Yoshida et al., 2003), especially in haloes with unusually rapid assembly histories. Recently, Wise et al. (2019, hereafter W19) have shown, using three-dimensional cosmological hydrodynamical simulations, that strong dynamical heating helps to keep the gas warm prior to the atomic-cooling stage, and may lead to the formation of SMSs with masses in massive haloes with extremely rapid growth rates, even if strong external LW radiation is absent, and H2 molecules are not fully dissociated. Similarly, unusually large baryonic streaming velocities can delay the collapse of gas into less massive haloes and induces violent mergers of gaseous haloes into more massive DM haloes (Hirano et al., 2017; Schauer et al., 2017; Inayoshi et al., 2018), inducing dynamical heating and helping to produce the conditions required for SMS formation.
Although dynamical heating in unusually rapidly assembling haloes is one of the promising mechanisms for the formation of SMSs, it remains unclear whether SMSs do indeed form in these haloes. In particular, radiation feedback from the growing protostar can stunt its growth, when the accretion rate is lower than a critical value of which is determined by equating the total luminosity of the star to the Eddington luminosity (Omukai & Palla, 2001, 2003; Hosokawa et al., 2013; Schleicher et al., 2013; Sakurai et al., 2015; Haemmerlé et al., 2018). We hereafter adopt the conservatively high for the critical rate, following Hosokawa et al. (2013). Above this critical rate, the rapid gas accumulation, as well as heat input owing to rapid accretion prevent the stellar surface from contracting via thermal emission on the Kelvin-Helmholtz (KH) timescale. The rapidly accreting protostars evolve to ‘super-giants’ which have inflated radii of . Conversely, since the KH timescale at the surface is , if the protostar grows at rates lower than the critical value at the beginning of its evolutionary stage the protostar cannot evolve into the supergiant protostar. The star contracts to a small radius, and develops a correspondingly high effective temperature , emitting copious amounts of ionising photons, which cause the radiation feedback. At their last resolved snapshots of the collapsing gas in the three-dimensional simulations by W19, the accretion rates in the innermost regions fall below this critical value (see the bottom right panel of their Figure 4), leaving the fate of the protostar unclear.
In this study, we explore the evolution of gas inflows around the growing protostar, and past the epoch simulated in W19, using one-dimensional radiation hydrodynamical simulations. We adopt the initial conditions for the cloud properties directly from W19, and employ non-equilibrium chemical reactions. We include the radiation emitted by the growing protostar (as well as a tentative circumstellar disc). The main goal of this study is to assess whether the stellar radiation suppresses the accretion rate below the critical value, or if accretion remains sufficiently rapid to produce a SMS.
The rest of this paper is organised as follows. In § 2, we describe the setup and details of the radiation-hydrodynamical simulations. In § 3, we present the evolution of the gas clouds for cases with and without stellar radiation. In § 4, we discuss our results, including their implications and some caveats. Finally, in § 5, we summarise our main conclusions.
2 Methods
2.1 Hydrodynamical simulations
In order to explore gas inflows around growing protostars, we use the hydrodynamical simulation code ZEUS (Stone & Norman, 1992), including multifrequency radiation transfer, photoionisation and heating, and a primordial chemical network (Inayoshi et al., 2016; Sakurai et al., 2016b). Assuming spherical symmetry, we use ZEUS to solve the continuity equation and the equation of motion in one dimension,
| (1) | ||||
| (2) |
where is time, is the radial coordinate, is the gas density, is the velocity (defined to be negative for inflows), is the gas pressure, is the adiabatic index, is the specific internal energy of the gas, is the gravitational potential (including contributions from both the growing protostar as a point mass, and from the self-gravity of the gas) and is the radiation pressure force. The specific internal energy is determined by the energy equation
| (3) |
where and are the cooling and heating rates. includes line cooling by H, H2, H and He, recombination cooling of H+ and He+, free-free emission, collisional ionisation cooling of H and He and H2 dissociation cooling (Glover & Jappsen, 2007; Glover & Abel, 2008),
| (4) |
We omit the He cooling rate by the 23S metastable excitation state which is proportional to since in our density regime this cooling rate can be invalid (see equation 14.19-20 in Draine 2011). For the heating rate , we include H2 formation heating, photoionisation heating of H, He, He+ and H2, H- photo-detachment heating, and H2 photodissociation heating (Abel et al., 1997; Omukai, 2000).
Our non-equilibrium chemistry incorporates the nine species H, H+, He, He+, He++, e-, H2, H and H-. The chemical reactions are taken mainly from Nos. 1-32 in Table A1 of Glover & Abel (2008). We adopt the case B recombination rates for H+, He+ and He++ because diffusive photons produced by direct recombination to the ground states are immediately absorbed by the surrounding gas. We also consider photoionisation, H- photodetachment and H2 photodissociation, with the rates adopted from references listed in Table 1. The evolution of the number density of each species is governed by
| (5) |
where and are creation and destruction terms of species respectively. The equation is solved using a semi-implicit method updating each species in order (Anninos et al., 1997; Whalen & Norman, 2006). The order of the updates is H, H+, He, He+, He++, H-, H, H2 and e-. We set a calculation timestep as the smallest among the Courant time, the cooling/heating time and the chemical time. The latter two timesteps are defined by
| (6) | ||||
| (7) |
where , , and is the number density of hydrogen nuclei (Whalen & Norman, 2006).
We solve the multi-frequency radiation transfer equation assuming a steady-state radiation field because the photon crossing time () is much shorter than the hydrodynamical timescale of gas inflows. Since ionised gas is optically thin to extreme- and far-ultraviolet (EUV and FUV) radiation, we assume , where and are the specific radiation flux and energy density. Then, if no other radiation sources exist, the radiative transfer equation reduces to
| (8) |
where the subscript marks the radial cell and is the absorption cross section for species (Whalen & Norman, 2006). We do not treat diffuse EUV and FUV photons emerging by recombination and radiative de-excitation in the radiative transfer equation of Eq. (8). Instead of considering photoionisation by diffuse EUV photons, we here adopt the on-the-spot approximation where the case B recombination rate coefficient is used. The flux of diffuse FUV radiation is negligible compared to those from the central protostar and an external LW background flux (see below). We adopt the cross sections from the references shown in Table 1, except for LW radiation.
For LW radiation, we replace the exponential factor in Eq. (8) by a shielding factor that includes both self-shielding of H2, and shielding of H2 by neutral H,
| (9) | |||
| (10) | |||
| (11) |
where , , and (Wolcott-Green et al., 2011). To obtain local estimates of the H2 and HI column densities, we adopt the ‘Sobolev-like’ length defined as and use the relations and . We include the LW radiation from the central protostar, as well as an external LW background with specific intensity (the same value as in W19). Since the background radiation irradiates the cloud from the outside in, whereas the stellar radiation irradiates the cloud from the center, we define the self-shielding factor outside-in for the background radiation, and inside out for the stellar radiation. Specifically, the self-shielding factor for the background radiation is computed as with .
The reaction rates and photo-heating rates for photoionisation, H- photo-detachment and H2 photodissociation (Table 1) are computed using a photon-conserving scheme (Whalen & Norman, 2006) as
| (12) | ||||
| (13) |
where is the threshold frequency for species , is the mean intensity (over solid angles) and . The photon conservation method here means that the absorbed flux contributes to the estimation of ionisation and heating rates, assuming that all the excess energy is thermalized and deposited into the gas. For the two-step H2 dissociation by LW photons (often referred to as the “Solomon process”; Field et al. 1966), we adopt the reaction rate
| (14) |
and the heating rate
| (15) |
(Abel et al., 1997). The radiation pressure force is
| (16) |
where is the Thomson cross section and is the total bound-free photoheating rate.
For the central radiation sources, we consider their contributions from both the growing protostar and from a hypothetical circumstellar disc. We include the disc component, because the gas contracting in the cores of the haloes simulated in W19 has non-negligible angular momenta (see their Extended Data Figure 4), suggesting that a circumstellar disc may form. Both sources are unresolved and located at the origin .
The stellar radiation flux at the innermost cell is
| (17) |
where is the stellar radius, is the effective temperature, is the radius of the innermost cell, and is the Planck function. The stellar radius and effective temperature are calculated from a stellar evolution model described in § 2.2. We adopt a standard disc model and a multicolor blackbody spectrum (e.g. Kato et al., 2008), which is well approximated by a power-law in the UV range of interest, for computing the disc radiation flux
| (18) |
where
| (19) |
Note that the cutoff frequency , which corresponds to the frequency of the maximum flux of the optically thick disc, always remains below the maximum frequency in our simulations. Since is always below , less than the EUV and FUV energies, the disc radiation has only a relatively minor effect on the dynamics of the flow. The total flux is .
We adopt a spherically symmetric, logarithmically spaced grid in the simulations. The cell of the grid is located at , where is the number of cells, is the radius of the outermost cell and () is the ratio between the radii of consecutive cells. The adopted grid parameters are summarised in Table 2 for convenience. The innermost cell radius (i.e. the inner boundary of the simulation) is chosen so that it is comparable to the star’s gravitational radius at the initial time, which is assuming and . The radius of the innermost cell is always larger than the stellar radius of a highly accreting protostar with a bloated envelope with cm for (Hosokawa et al., 2013). We use outflow boundary conditions at both the inner and the outer boundary: gas is allowed to pass from simulation regions to outsides but is not allowed to flow in. With these boundary conditions masses in the simulation domain continuously decrease. In this case the accretion rate is artificially decreased when the stellar masses, on to which most outflowing gas is accreted, become comparable to the domain masses, and the inflowing gas is more prone to radiation feedback. We still adopt these conservative boundary conditions.
| 600 | |
| 1.008 | |
We adopt a frequency grid which allows us to follow the relevant radiative processes (Table 1). The frequency range is or . The number of frequency bins is . We designed the grid layout to decrease the number of frequency bins making computation time shorter: we choose a fine frequency mesh at energies moderately larger than threshold energy of each of the reactions in Table 1 and space the bins more sparsely at other photon energies.
The initial conditions of our simulations are taken from the spherically-averaged gas cloud profiles of the LWH model in W19 (see dashed curves in their Fig. 4). These include the gas density, velocity, temperature, H2 fraction and electron fraction. In their simulations they also show results for the the cloud “MMH” which is their most massive halo. The results for LWH and MMH are qualitatively similar in our simulations so in the following we will focus on the results of the LWH cloud for simplicity. The initial profiles we adopted are shown by the black curves in Fig. 2 below. The initial H+ fraction is set to that of electron because of the charge neutrality (note that helium is neutral at the initial condition). The ratio of the number density of hydrogen nuclei to that of helium nuclei is . Helium is assumed to be initially all neutral.
Although in our simulations we assume a spherically symmetric gas distribution, in the 3-D simulation of W19 the gas distribution is not spherically symmetric. We discuss the possible impact of the spherical assumption on our results in § 4.3.1 below.
| 2 | 10 | 30 | 50 | 100 | 300 | 1000 | |
|---|---|---|---|---|---|---|---|
| -8.93e-4 | 0.139 | 0.323 | 0.451 | 0.627 | 0.959 | 1.20 | |
| 4.14 | 4.65 | 4.87 | 4.93 | 4.98 | 5.05 | 5.07 |
| 2 | 10 | 20 | 27 | 100 | 1.7e4 | |
|---|---|---|---|---|---|---|
| 2.30 | 2.26 | 2.37 | 2.78 | 3.32 | 4.34 | |
| 3.65 | 3.69 | 3.70 | 3.68 | 3.68 | 3.80 |
2.2 Stellar evolution
The growth of the central protostar during each time-step is calculated simply from , using the mass flux at the innermost cell as the accretion rate onto the protostar. The protostellar evolution is computed by fitting stellar evolution data. Depending on the accretion rate, the evolution of a rapidly growing protostar is divided into two phases: if the accretion rate is lower than , the star is in a compact zero-age main sequence (ZAMS) phase, and otherwise it is in a bloating phase (Hosokawa et al., 2013). Even if the accretion rate drops below , the star may be still in the bloating phase for several thousand years (Sakurai et al., 2015). However, we do not model this sustained bloating phase, and instead assume the star is in the ZAMS phase whenever . As seen in §3, this treatment makes our conclusion conservative, because the EUV luminosity from the compact ZAMS model with the same mass is substantially higher than that in the bloating phase with a lower effective temperature of K. Specifically, for we use the data for ZAMS stellar evolution from Marigo et al. (2001) and Bromm et al. (2001), as summarised in Table 3. For , we use the model data of a super-giant protostar growing at a constant mass accretion rate of . The data of the stellar radii and effective temperature are generated by using a stellar evolution code STELLAR that was originally developed in Yorke & Bodenheimer (2008) and used in Sakurai et al. (2015) (see Table 4). We note that the evolution of a highly accreting protostar hardly depends on the detailed time-evolution of the mass inflow rate as long as is satisfied.
We set the initial stellar mass to , which is chosen so that the dynamical timescale at the inner-most cell () is not too short to follow gas dynamics over a wide range of spacial scales. The choice of a smaller initial mass would not make the result qualitatively different because radiative feedback does not affect the mass accretion rate until the star grows to as seen in §3. For stellar radii and temperatures in-between the masses or oustide the mass range in Tables 3 and 4, we interpolate/extrapolate linearly in the logarithmic quantities.
3 Results
3.1 Simulations with and without radiation
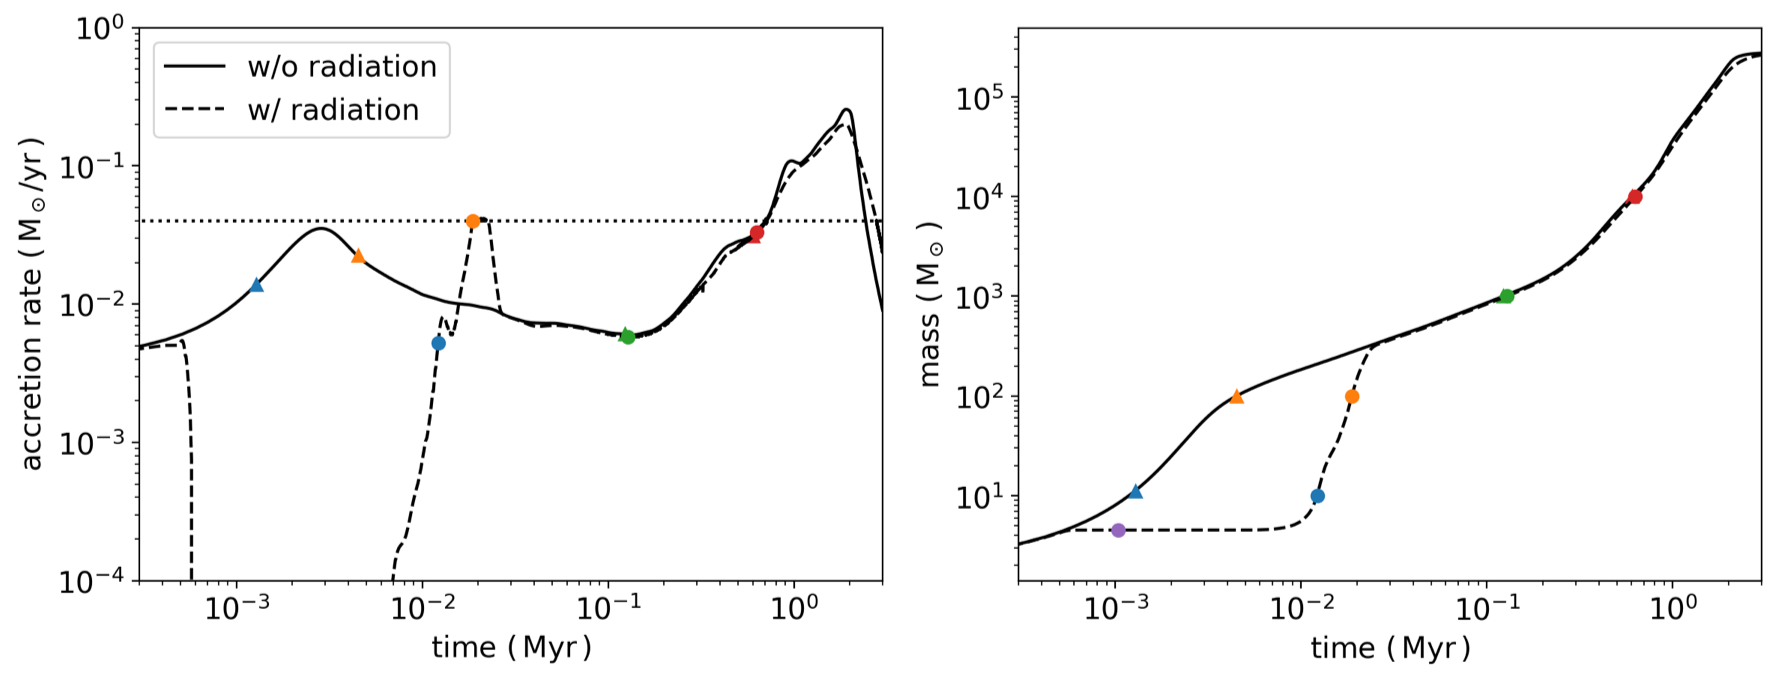
In the left panel of Fig. 1, we show the evolution of the accretion rates at the inner boundary with time. The solid and dashed curves indicate simulations without radiation and with radiation respectively. The horizontal dotted line shows the critical accretion rate (see § 1 and § 2.2). In the right panel, we show the time evolution of the growing proto-stellar masses.
In the no-radiation case, the accretion rate remains above and the stellar mass grows monotonically without interruptions. In contrast, when stellar radiation is included, the radiation stops the accretion onto the protostar temporarily for . The growth of the stellar mass is halted at . At accretion resumes, the rate eventually increases to , and the protostar rapidly increases its mass by orders of magnitude in yrs. During this rapid accretion episode, the accretion rate reaches the critical rate at yr, but decreases after the peak because the density is decreased after gas of a few hundreds of solar masses accretes on to the protostar (the top left panel of Fig. 2). The drop of the accretion rate at are due to the depletion of gas from the simulation domain. The drop is hardly affected by the stellar radiation.
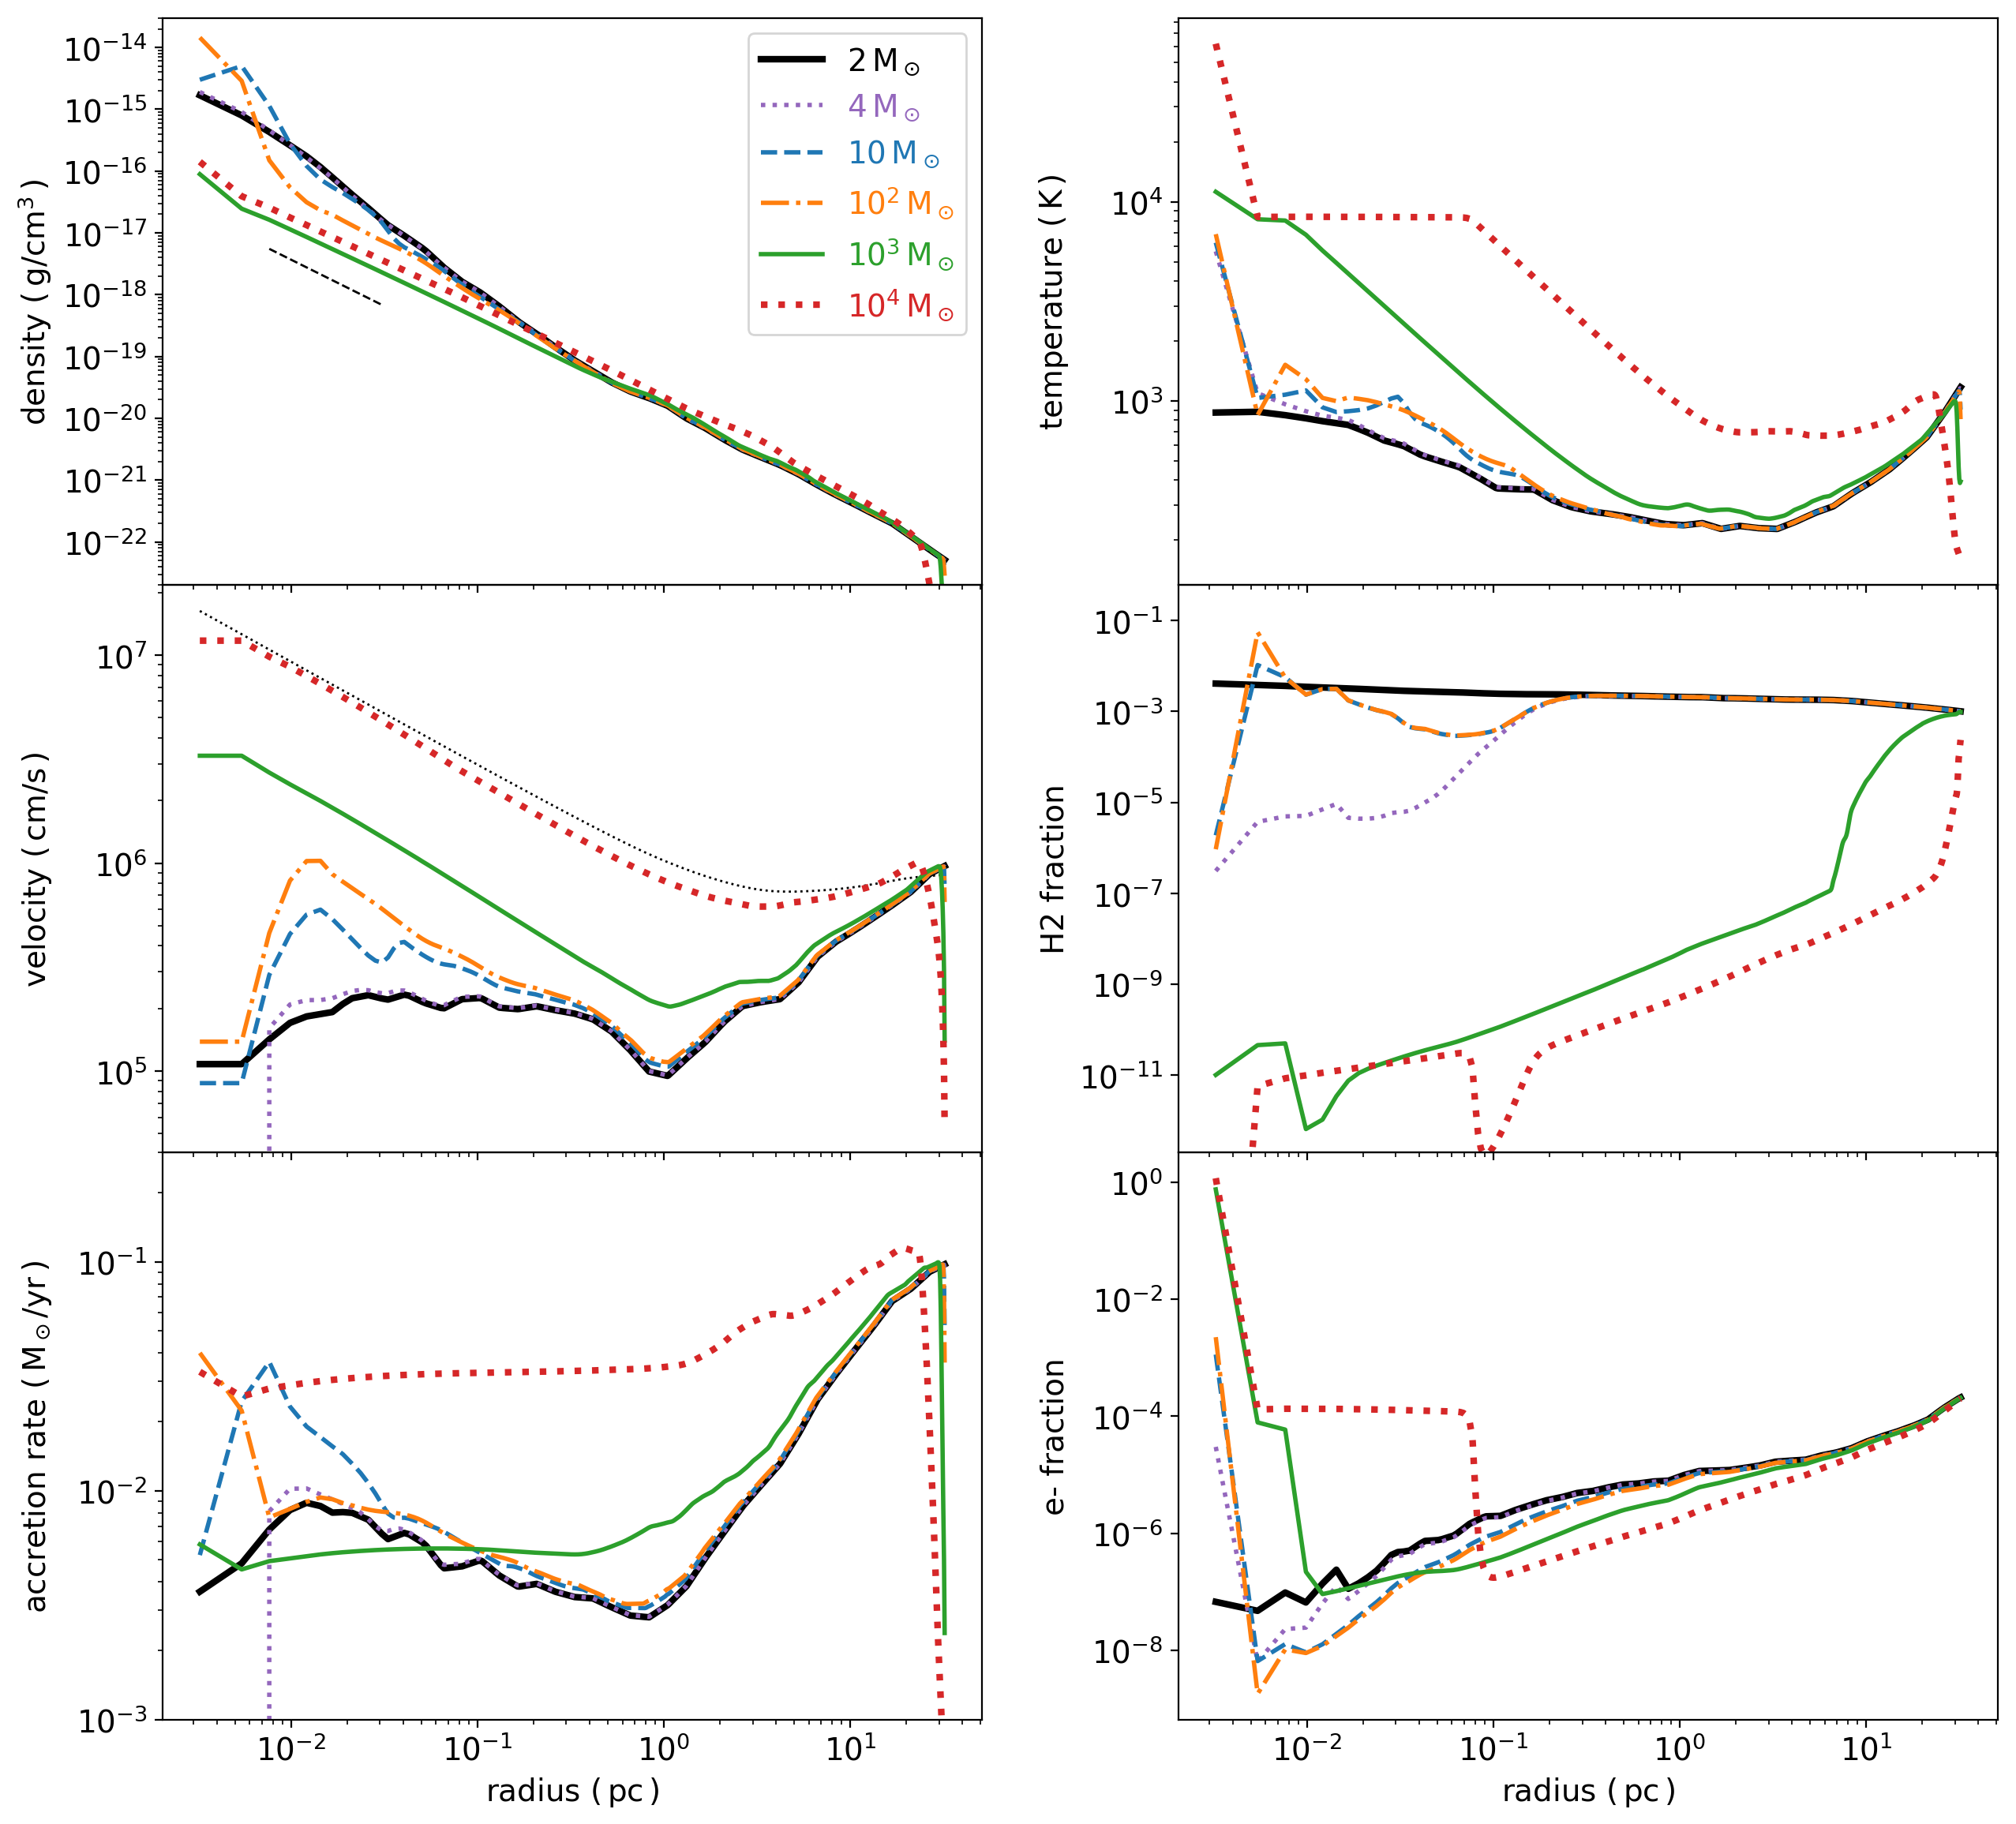
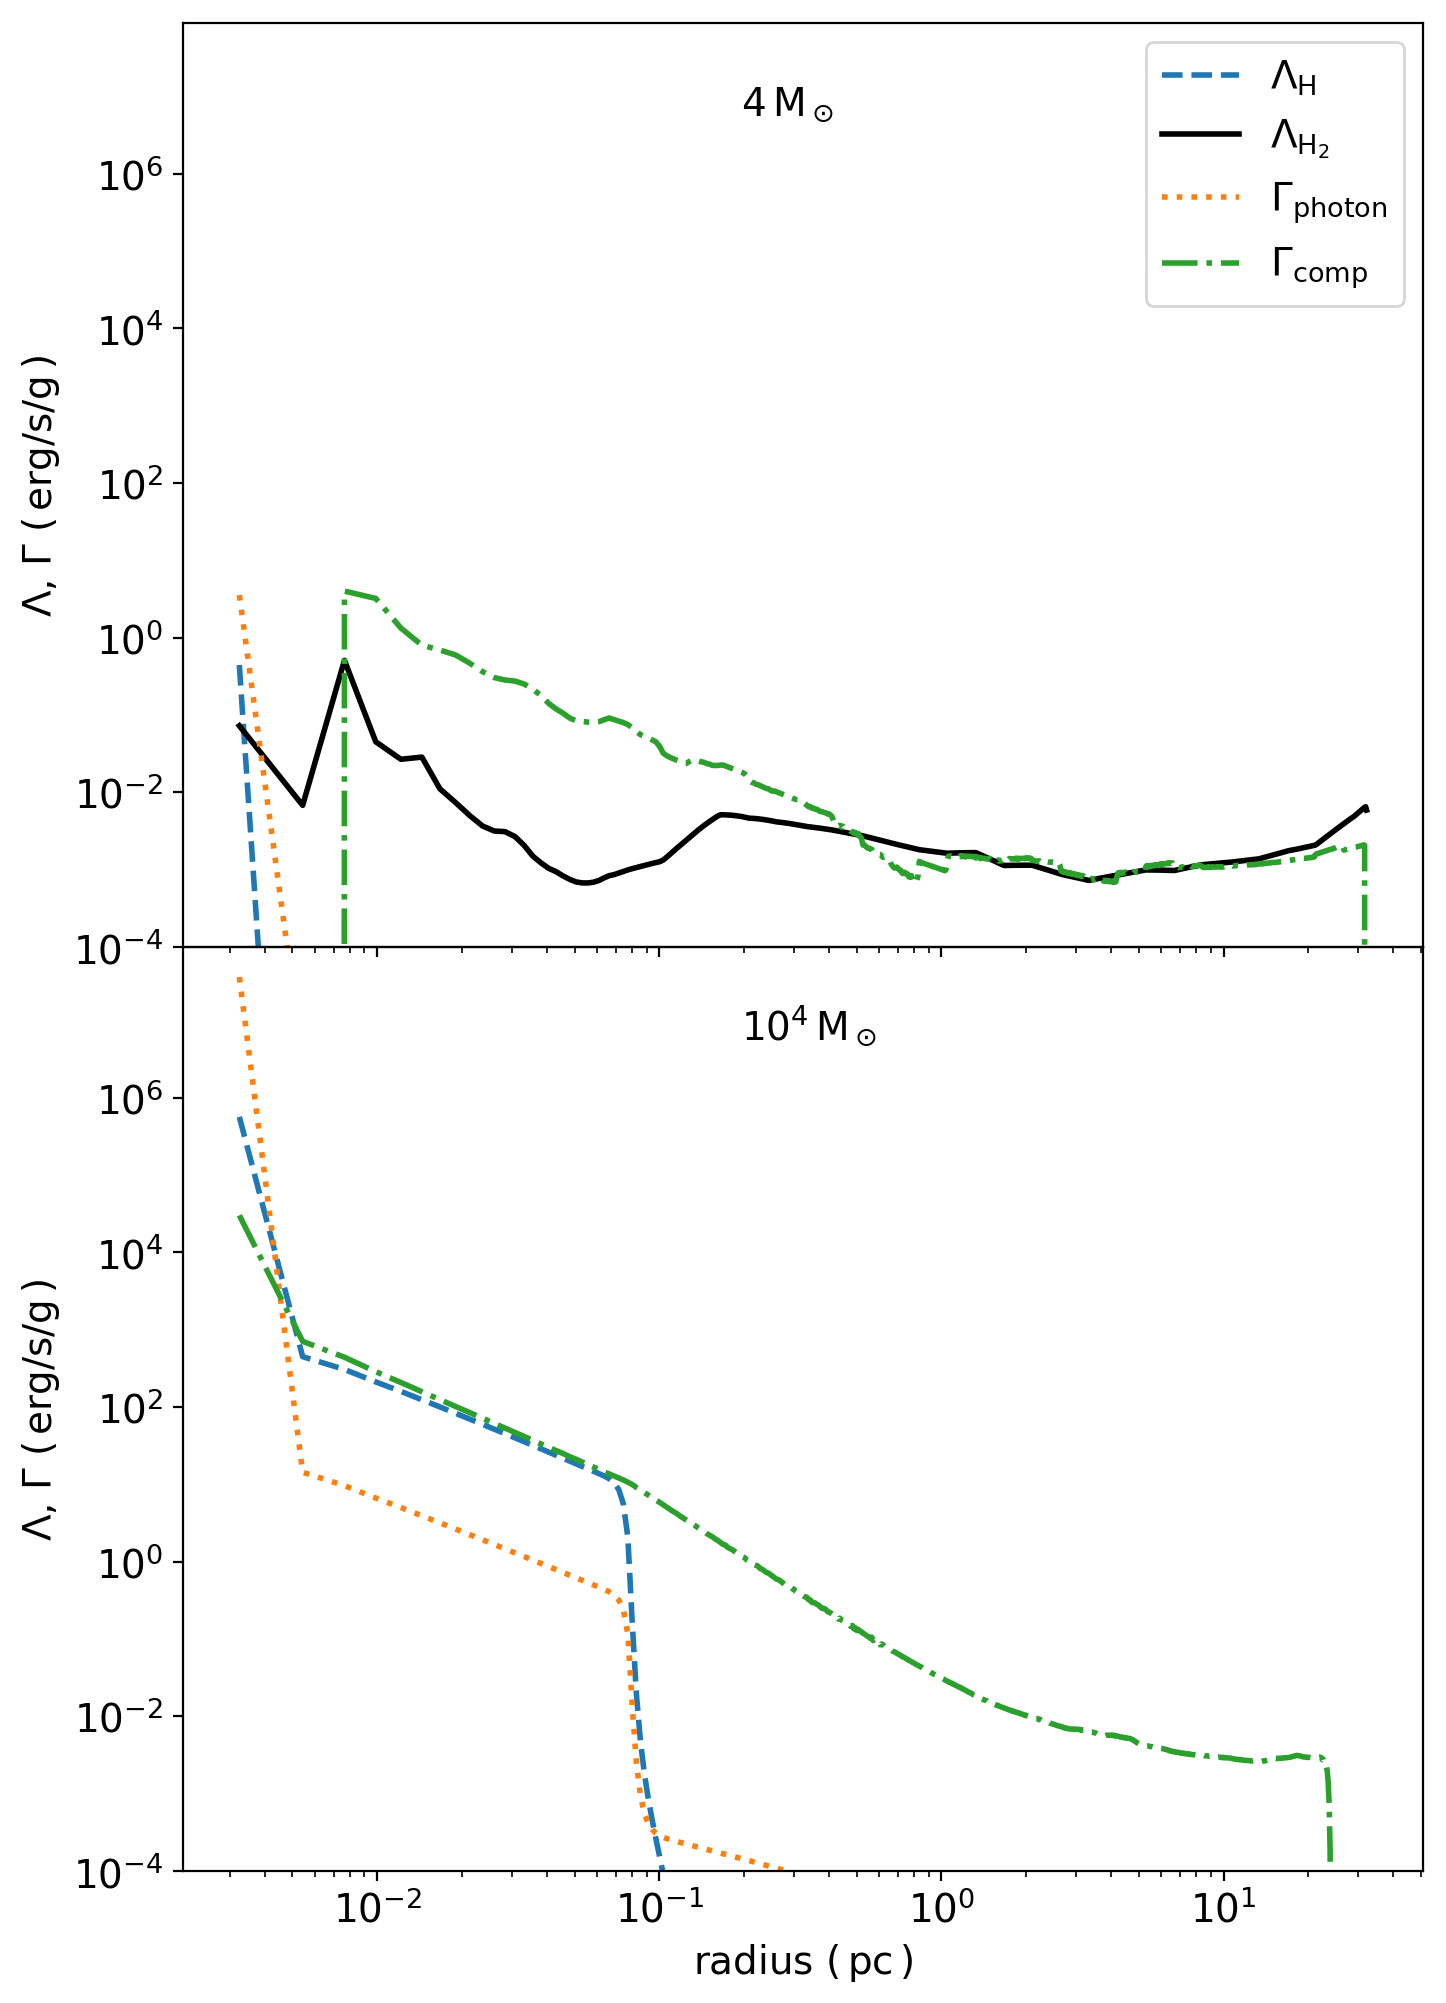
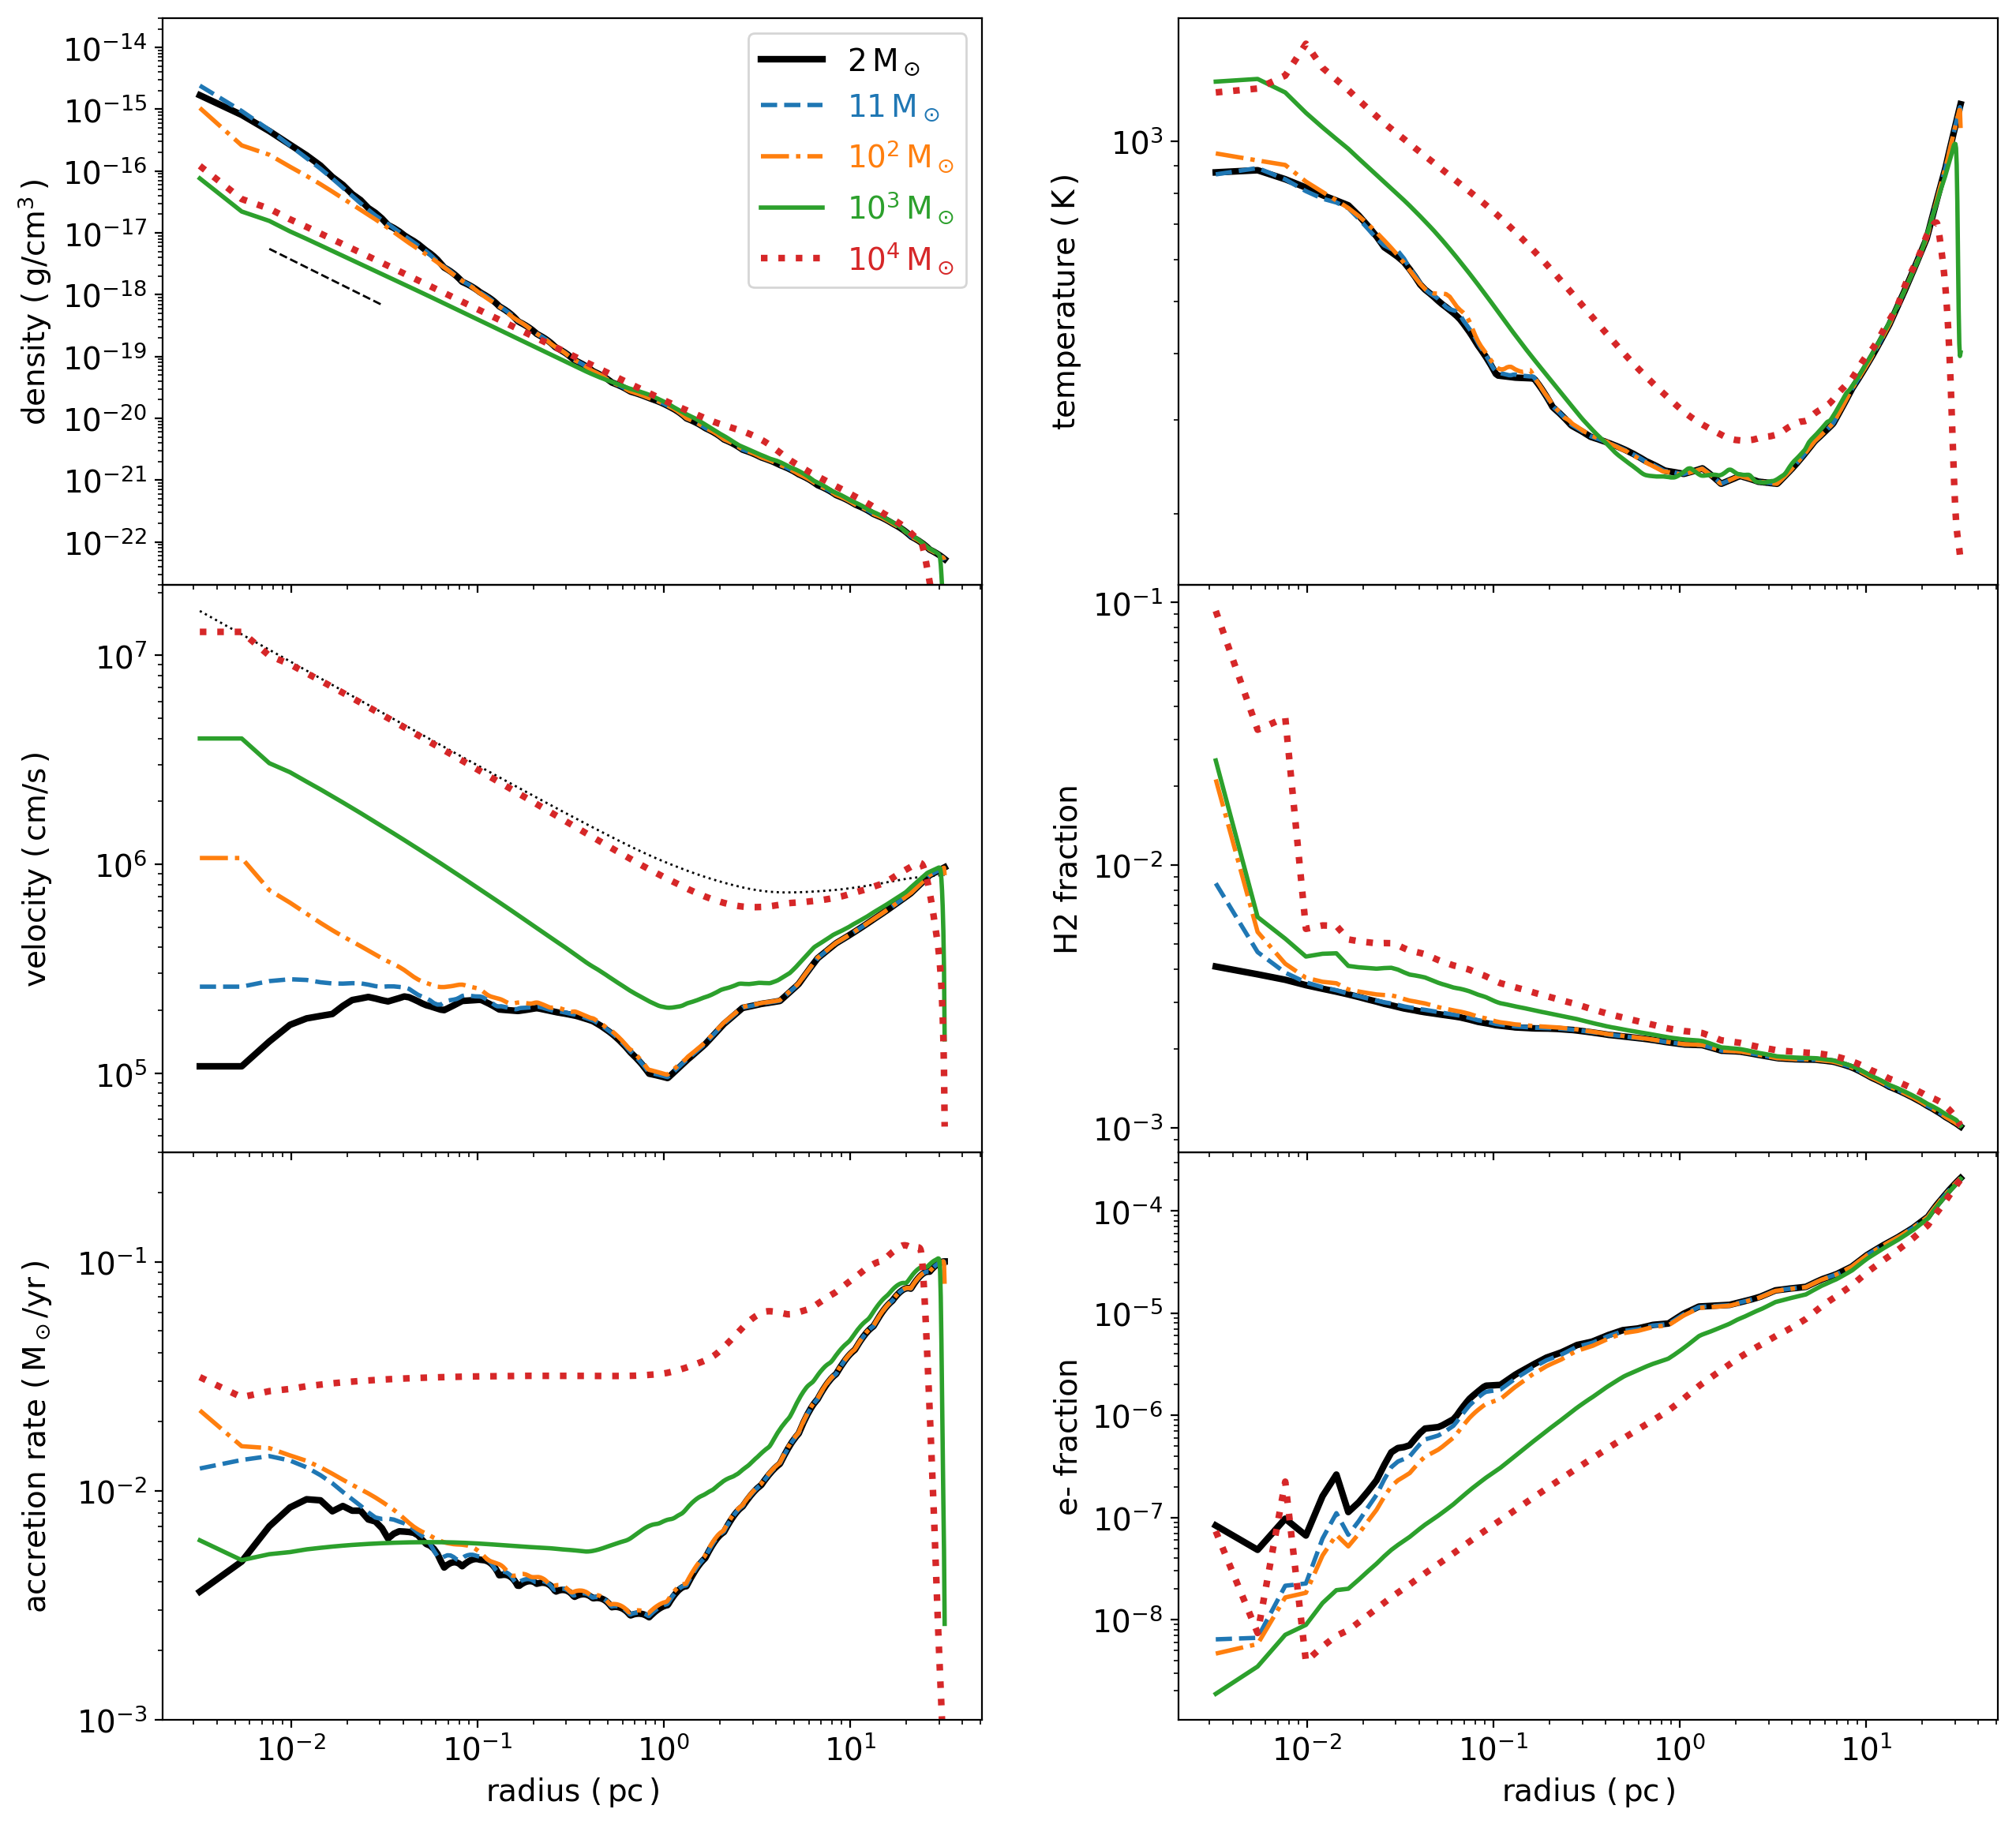
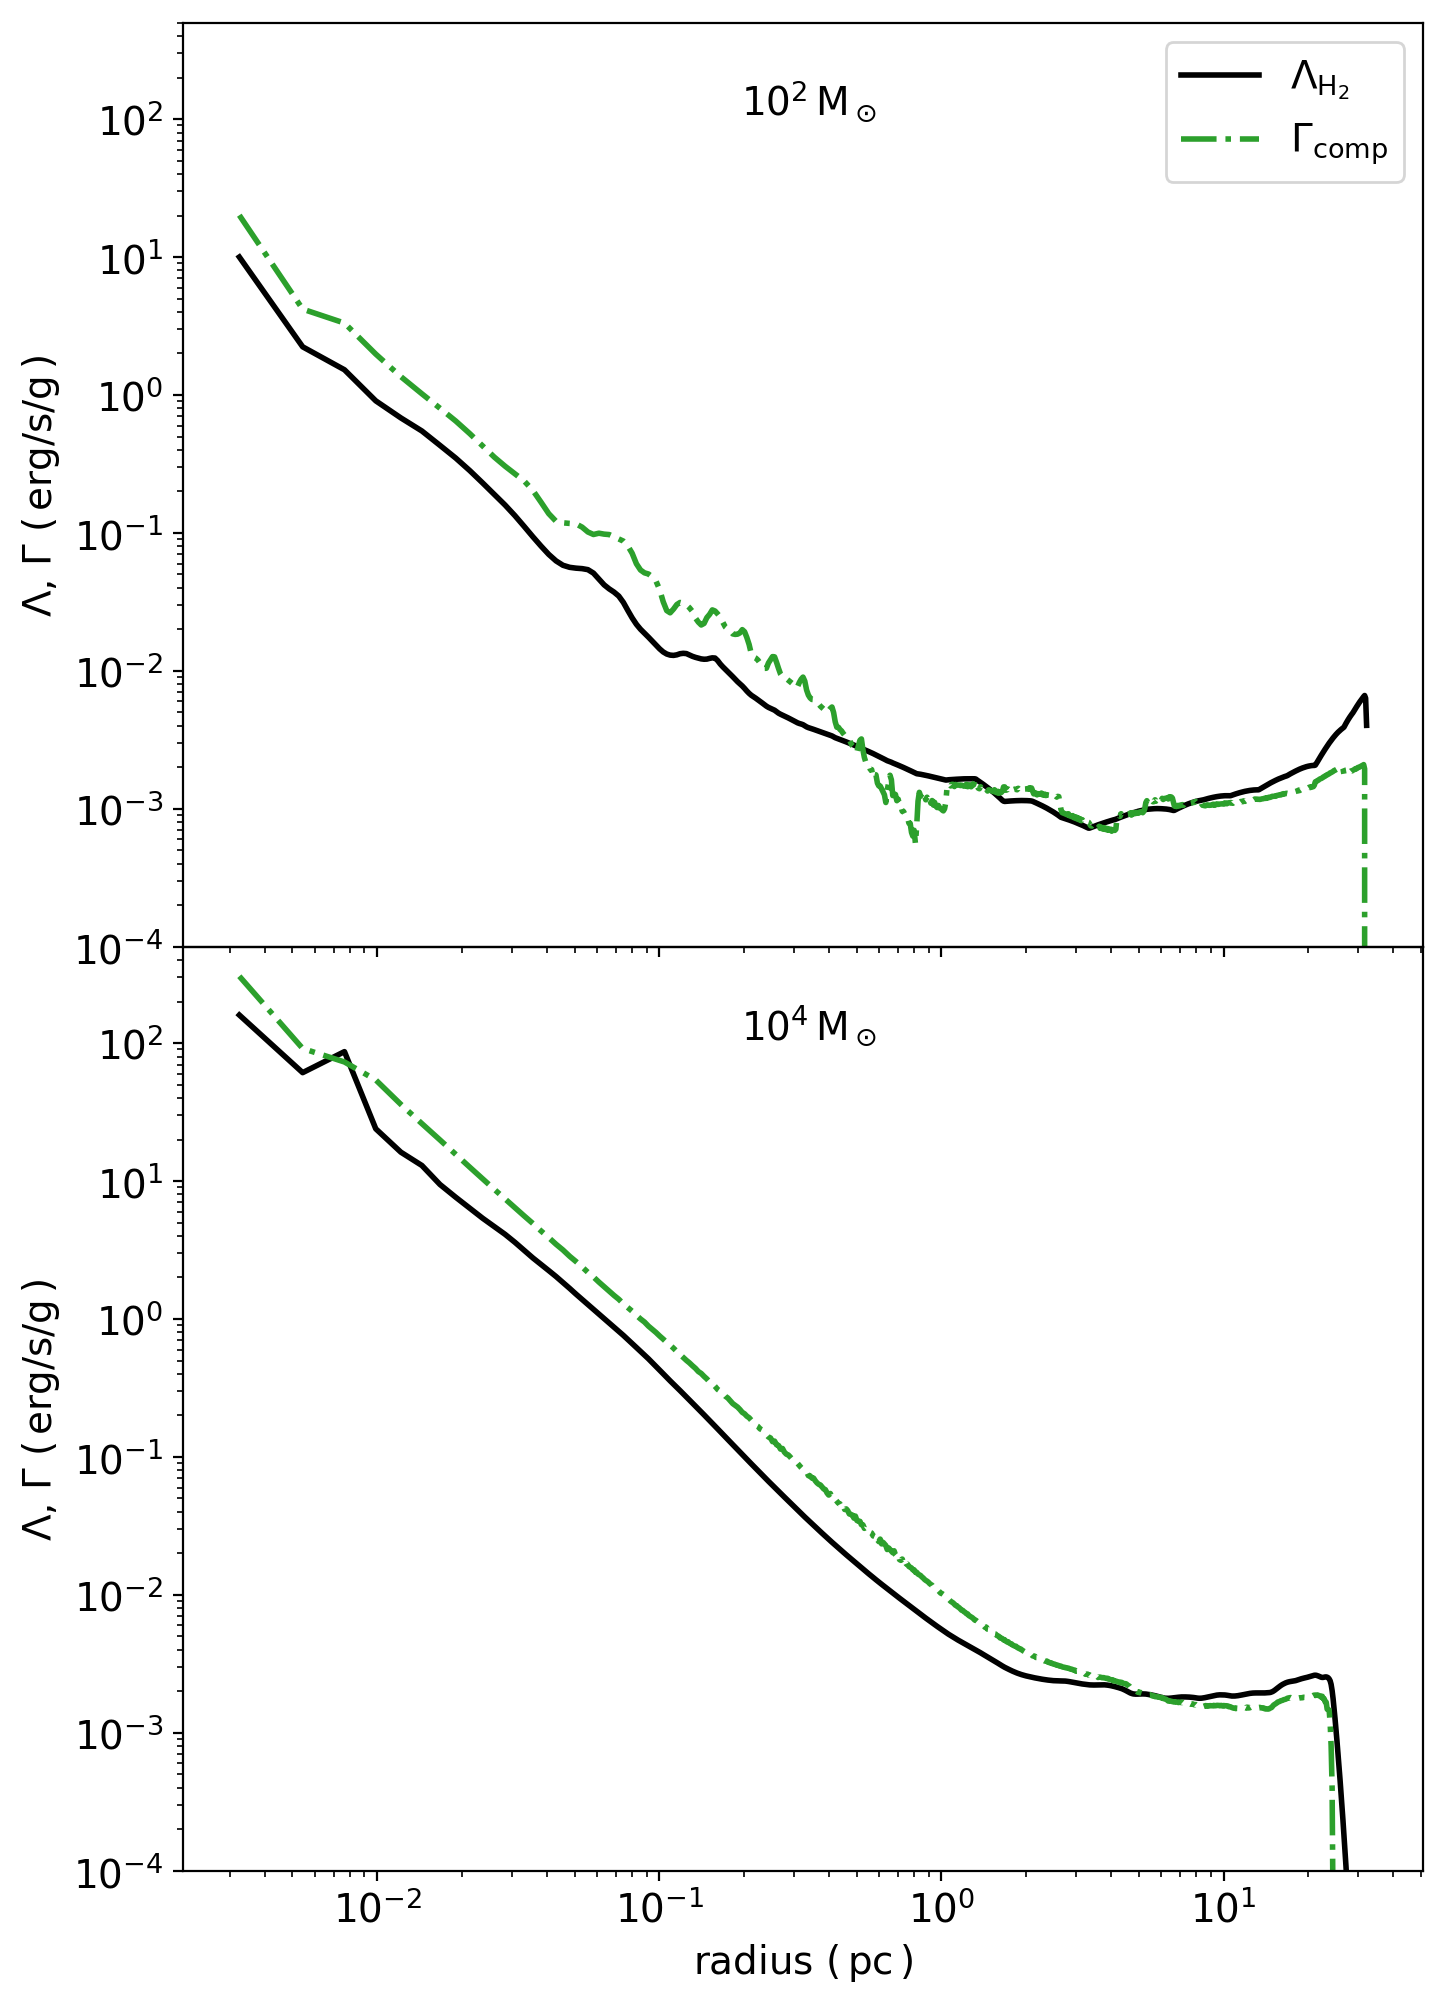
In Fig. 2, for the simulation with the radiation from the central source included, we show snapshots of the radial profiles of the gas density (top left), temperature (top right), velocity (middle left), H2 fraction (middle right), accretion rates (bottom left) and electron fraction (bottom right) when the stellar masses are and . The initial density profile (black line in the top left panel) has a slope at , which is shallower than the power-law for isothermal collapse. The shallower slope is due to sheet-like structures seen in the 3-D simulation of W19. We also show the profiles of the cooling/heating rates at the first and last snapshot in Fig. 3, where the different colors indicate the H2 line cooling rate (black), compressional heating rate (green), atomic hydrogen line cooling rate (blue) and photoheating rate (orange).
The gas inflow is stopped at from to : the infall velocity and the accretion rate become zero at (purple curves in Fig. 2). At , the gas inflow resumes and the stellar mass increases to . In the accretion phase of , the slope of the density profile in the inner regions gradually evolves to . This change in slope occurs because the stellar gravitational radius increases to , making gas free-fall in the star’s point-like gravitational potential (left middle panel). The temperature reaches for in the inner region, where atomic-hydrogen cooling becomes effective (see blue curve in the bottom panel of Fig. 3). Once the core becomes hot enough to collisionally dissociate H2 ( K) and the H2 column density drops within the core, LW radiation produced from the central star propagates out and effectively dissociates H2 in the outer region (). Within the stellar influence radius (), the temperature increases inward due to compressional heating (bottom panel of Fig. 3) from the equilibrium temperature of H2 cooling .
As the stellar mass reaches , where the accretion rate is still below the critical value, a fully-ionised ( K; ) and partially ionised region ( K; ) form. While in the partially ionised region, the electron fraction is determined by the balance between collisional ionisation of neutral hydrogen (by electrons) and radiative recombination of hydrogen, the inner-most hot region is created because of photo-ionising radiation from the star with K. Despite the strong stellar EUV radiation, the gas is not fully ionised to form a large Hii region. This is because the gas density is so high ( at ) that the hydrogen recombination rate is faster than the ionisation rate, and the Hii region is unable to propagate away from the stellar surface. The H2 fraction still remains as low as - because of H2 collisional dissociation at and LW photodissociation at .
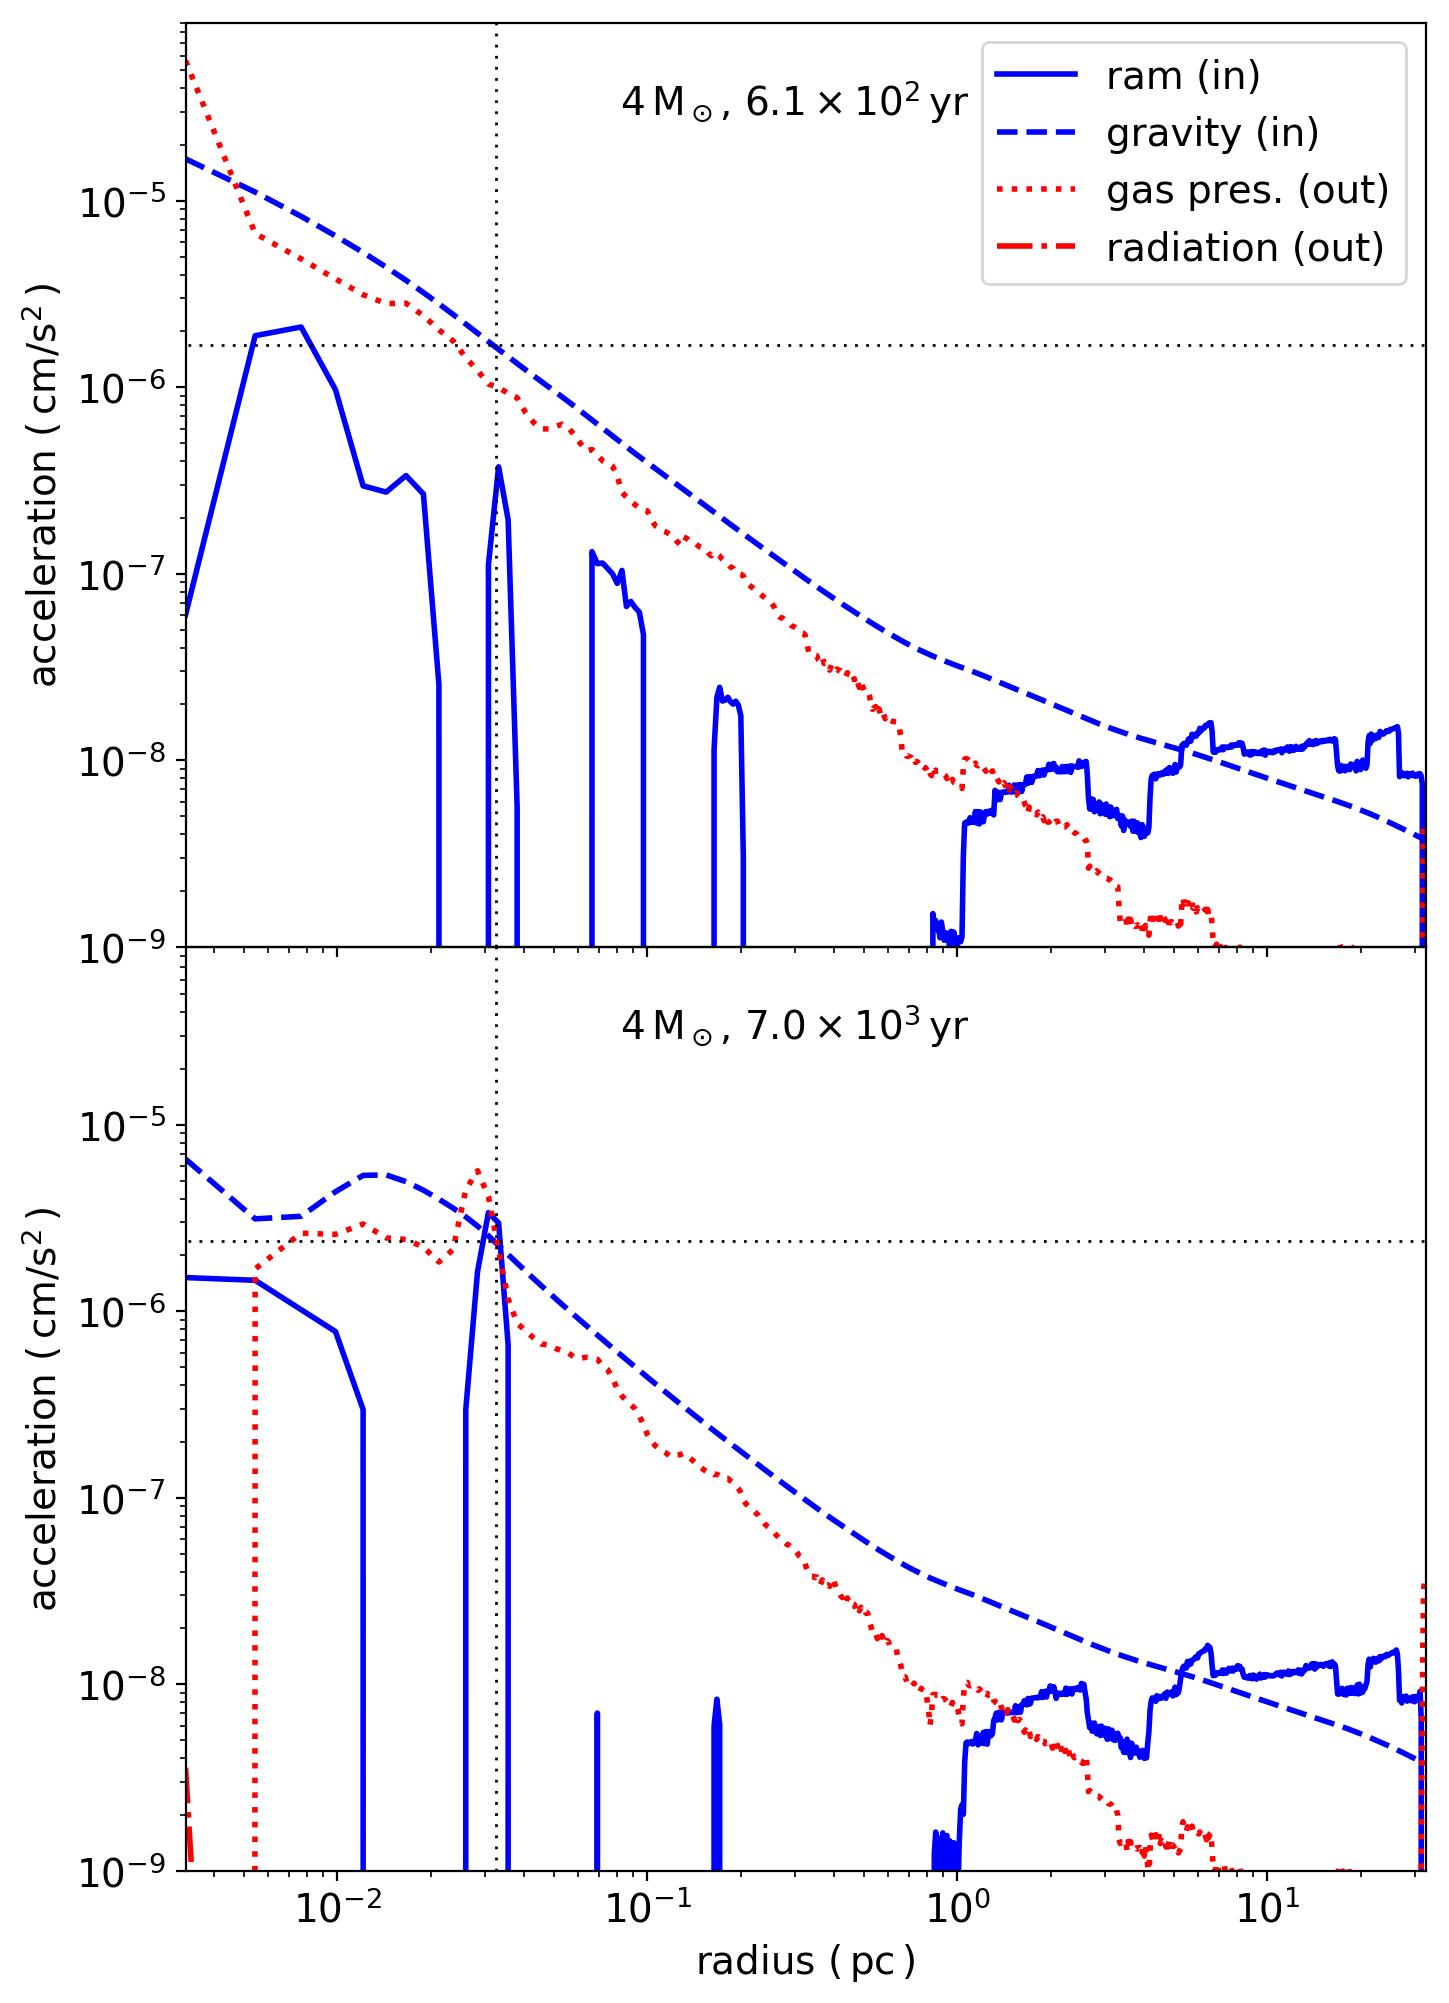
We examine the reason why the gas inflow is temporarily stopped and then resumes. We show the cooling/heating rates at and when the gas inflow stops in the top panel of Fig. 3. The H2 cooling rate is suppressed for where the H2 molecules are dissociated by LW radiation (see the middle right panel of Fig. 2). For photoheating and compressional heating are effective, and HI and H2 coolings are inefficient, the temperature increases inward for . Since the sonic point moves inward with this increase of the temperature, the outward gas pressure gradient force overcomes the inward gravitational force on the gas, and decelerates the infalling gas. This is seen directly in Fig. 4, where the top panel shows the radial profiles of the pressure and gravitational forces at 610 yr, at the time when the accretion first stops, and reveals that the outward pressure gradient force in the inner region becomes dominant.
The accretion rate finally resumes at , because the self-gravity of the gas builds up as the outer shells fall in and accumulate. The over-pressurised region moves steadily outward from the inner core, until it reaches at yr. At the same time, the gas accumulating due to infall from larger radii increases both the inward gravitational and ram pressure forces. For example at the gravity increases from at , just after the accretion stops, to at , just before the accretion recovers (upper vs. lower panel in Fig. 4). At yr (not shown in Fig. 4) the outward pressure force becomes subdominant at all radii, allowing accretion to resume.
For comparison, in Fig. 5 we show radial profiles of the density, temperature, velocity, H2 fraction, accretion rates and electron fraction for the no-radiation case, when the stellar masses are and . Likewise, in Fig. 6, we show profiles of cooling/heating rates when the stellar masses are and . As time elapses and the stellar mass grows to , the slope of the density profile in the inner regions gradually evolves from the isothermal one to the free-fall one as seen in the case with radiation field. Because of the lack of stellar radiation feedback, the inflow velocity is accelerated to the free-fall value monotonically at all radii, and the accretion rate () tracks its evolution without suppression. The gas temperature gradually increases inward but is saturated once it reaches K, because the compressional heating rate is balanced with the H2-line cooling rate in the case without stellar radiation (see Fig. 6). In the central core (), the H2 fraction rises rapidly through the three-body reaction () as seen in pristine star forming clouds (Yoshida et al., 2006; Turk et al., 2011).
4 Discussion
4.1 Impact of the parameters
The main result of our simulations is that formation of SMSs can take place via rapid mass accretion because an Hii region is unable to propagate to large radii and hinder the inflow. We expect that this result may be changed by differences in the simulation setup and the initial conditions. Specifically, if the cloud had a lower initial density, the accretion rate would be smaller and the SMS formation could be inhibited if the Hii region could expand. Also, a stronger LW radiation may help gas heat more, and hinder the gas infall.
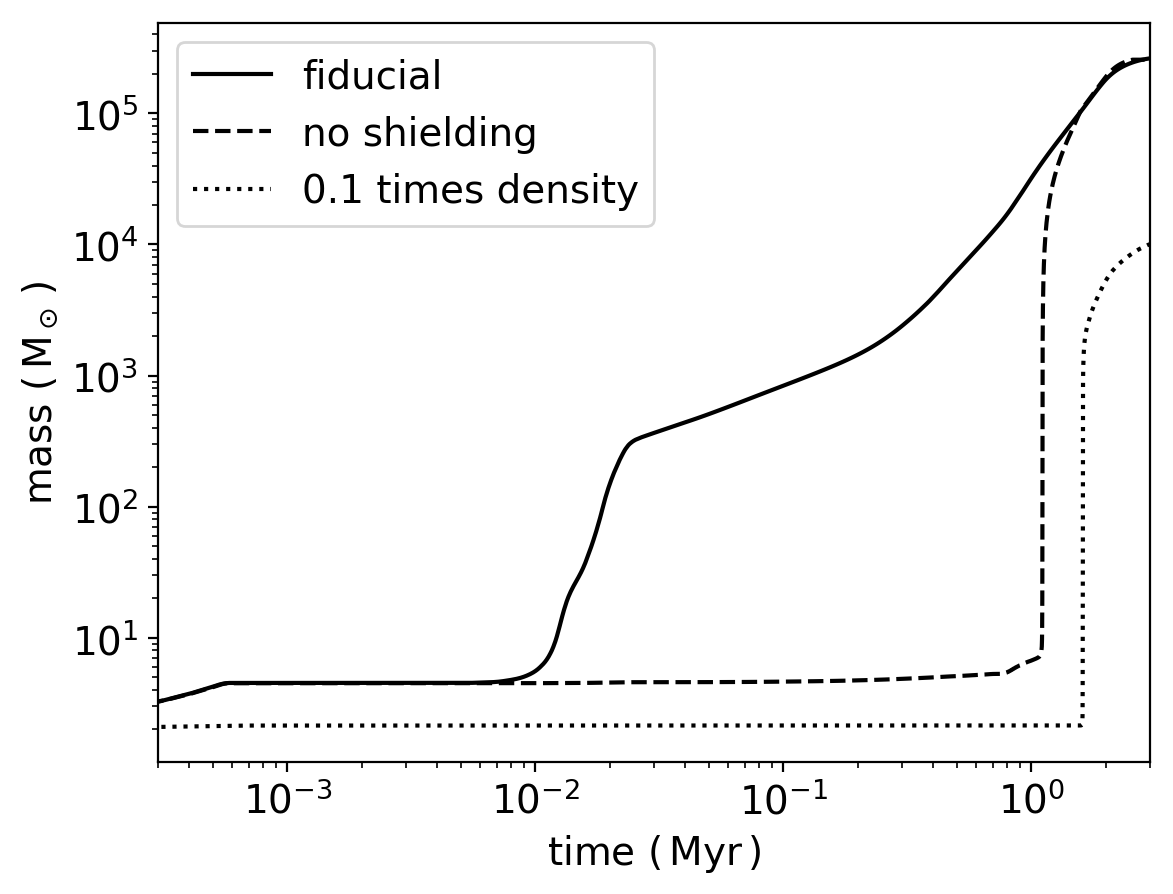
To explore how these effects would impact our conclusions (i.e. whether an SMS finally forms), we performed two variants of our fiducial simulation. First, in Fig. 7, we show the evolution of the stellar mass for a simulation in which radiation is included, but the H2 self-shielding against LW radiation is ignored (dashed curve). In this case, the recovery of the accretion rate is delayed from to . The accretion rate then increases to and the stellar mass rapidly increases from to within . In this no-shielding model, the radiation feedback process is similar to the fiducial model: the LW radiation dissociates H2 molecules, H2 cooling becomes inefficient, the gas temperature increases and the outward gas pressure gradient force overwhelms the inward gravitational force. The longer pause in the stellar growth than in the fiducial model is due to more efficient H2 dissociation by the stronger (unshielded) LW radiation.
We next show the evolution of the stellar mass for a simulation in which the initial density profile was assumed to be 10 times lower than in the fiducial case (dotted curve in Fig. 7). In this case, gas accretion is suppressed for , because the inner region of the cloud is initially gravitationally stable due to the lower density. After , the accretion rate increases and reaches , because gas from large scales falls inward and gravitational instability develops. The stellar mass increases from to until .
We conclude that the SMS formation is viable if the density is larger than 0.1 times the density in the fiducial profile taken from W19, and that the limiting factor is the self-gravity of the gas in the core, rather than the radiative feedback.
4.1.1 Variation of SMS models
We constructed a rapidly accreting super-giant protostellar model (Table 4) based on the stellar evolution calculations in Hosokawa et al. (2013). We here consider other SMS models, discuss their differences, and justify our adoption of the stellar model based on Hosokawa et al. (2013).
A recent study by Bear & Soker (2020) showed that using the code MESA (Modules for Experiments in Stellar Astrophysics; Paxton et al. 2011) non-accreting SMS radii can be an order of magnitude smaller than in Hosokawa et al. (2013) and Haemmerlé et al. (2018). The smaller radii are due to lack of entropy injection to stellar surface by rapid gas accretion, which is not included in the calculations of Bear & Soker (2020). They also point out that if the central object is a fully convective object and represented by a polytrope of , the stellar radii would be also an order of magnitude smaller than in our case (equation 2 in Begelman, 2010). However, a rapidly accreting SMS, as considered in this paper, is not well represented by a polytrope of . Instead it has a compact massive core and an extended dilute envelope (e.g. fig. 2 of Hosokawa et al., 2013). Thus, a stellar model which allows growth by accretion and includes entropy injection at the surface is more appropriate to adopt for the present study.
4.2 Comparison to other works
4.2.1 Comparison to a PopIII formation case
The study presented in this paper is analogous to previous work, which assessed, via radiation-hydrodynamical simulations, the final masses of PopIII stars forming in primoridal gas that has cooled and contracted inside lower-mass minihaloes (Hirano et al., 2015, 2017). The two major differences are that (i) here we consider proto-stellar cores and their surrounding initial density profiles extracted from simulations of more massive atomic-cooling haloes, and (ii) we assume spherical symmetry, and perform 1D simulations, rather than the 2D treatment in Hirano et al. (2015, 2017).
To check how our 1D simulation might give a different result compared to a multidimensional simulation, we perform a 1D simulation as above, but with the initial conditions adopted for a PopIII star forming cloud from Hirano et al. (2015) - specifically their cloud ID=4 and with (see their Table 1). This 1D simulation can be directly compared to the 2D simulation performed in their paper. We find that in our case, the cloud forms a star with a final mass of , whereas in the 2D RHD simulation by Hirano et al. (2015) the final mass is . The difference can be attritubed to the fact that in the 1D case, the cloud is spherical, and radiation feedback is more easily suppressed. In the 2D simulations, radiation can escape along the lower-density polar regions, and subsequently ionise and heat the gas farther away, and more easily suppress the accretion rates at these larger distances (Tan & McKee, 2004; McKee & Tan, 2008). This suggests that our 1D treatment may overestimate the final stellar mass.
4.2.2 Comparison to 3-D simulations
Luo et al. (2018) and Ardaneh et al. (2018) explored the early evolution of the direct collapse of protogalactic clouds with 3-D radiation hydrodynamical simulations. They used the flux-limited diffusion (FLD) approximation for computing the radiation flux assuming a grey opacity. They showed that the radiation luminosity emerging from the photosphere of the central core approaches the Eddington luminosity. The large luminosity affects the evolution of the cloud: anisotropic recurrent outflows are driven by this strong radiation, as well as by thermal pressure, and disrupt the central object. The outflows collide with inflowing gas from larger scales, and are trapped. However, they facilitate the outward transfer of angular momentum. As a result, after formation of the photosphere, a rapidly accreting, quasi-spherical central object emerges, with no significant rotation.
Our work here is complementary, in that we follow the subsequent growth of the emergent protostar, and find that it can continue accreting without significant radiation feedback. The difference of the results may be attributed to the different simulation times, scales, dimensions and treatment of a radiation field: in our simulations, we consider a 1-D geometry, a simulation time up to , scales down to and multi-frequency radiation transfer while in Luo et al. (2018) and Ardaneh et al. (2018) they consider 3-D geometry, a simulation time up to after formation of the photosphere, scales down to , and a grey approximation for radiation transfer.
Specifically, if we resolved smaller scales in our simulations, an Hii region could expand in the early phases and cause feedback (§ 4.3.2) as seen in the 3-D simulations. Even in this case, the Hii region would shrink in the later phase because the expected size of the Hii region is much smaller than a protostar’s Bondi radius. On the other hand, if we relax the spherical assumption, the feedback may also affect the later evolution of the flow. The difference of the grey and multi-frequency radiation transfer might also affects the result.
It is still unclear whether the early feedback as shown in Luo et al. (2018) and Ardaneh et al. (2018) continues to be important during the later stages of evolution and on larger scales in the direct collapse clouds. To self-consistently explore long-term evolution of the clouds in the small and large scales, multidimensional multi-frequency radiation hydrodynamical simulations are awaited.
4.3 Caveats
4.3.1 Spherical assumption
Although we assume a spherically symmetric gas distribution in our simulations, the gas distribution in the halo LWH of W19 has non-negligible angular momentum and an asymmetric morphology. From the Extended Data Figure 4 in W19, the circular velocity of the cloud is comparable to the Keplerian velocity at radii where the enclosed mass is , following a self-similar solution of a gravitationally collapsing cloud as seen in the normal Pop III star formation (Yoshida et al., 2006) and direct-collapse of a massive atomically-cooling gas (Inayoshi et al., 2014). If the subsequent cloud evolution were followed by a multi-dimensional simulation, the protostellar growth and the radiation feedback could be changed for . For example, if an accretion disc forms, and the density in the bipolar regions becomes low, the stellar radiation can more easily break out of the inner regions. While on small scales, this may help accretion in the shielded equatorial plane, the radiation would become isotropic further out, where the densities are lower, and could suppress the accretion at the larger radii - as suggested by the direct comparison presented for one case in § 4.2.1 above.
More generally, protostellar evolution during an accretion phase is more complex when an accretion disc forms. A self-gravitating disc can fragment via gravitational instability. The fragments then fall on to the central protostar and raise the accretion rate, making the star bloat up and suppressing the ionising photon emissivity (Inayoshi & Haiman, 2014; Sakurai et al., 2016a; Hosokawa et al., 2016; Tagawa et al., 2020; Chon & Omukai, 2020).
Furthermore, in a non-spherically symmetric morphology, supersonic flows can form shocks (e.g., accretion shocks at the outer edge of a rotationally supporter disc). Shocks can then heat up the gas, increasing the pressure, and possibly slowing down the infall.
Regan et al. (2020) recently performed high-resolution 3-D hydrodynamical simulations of pristine atomic-cooling haloes to study the formation and evolution of very massive stars. They found that the gas cloud in the core of the halo is highly turbulent, and that the protostars are often in low-density regions, accreting inefficiently. In our simulations we assume that the central protostar is never displaced from the high-density region. In this sense, we may overestimate the growth of the protostar.
In the context of present-day massive star formation, in addition to stellar radiation, collimated outflows and magnetic fields are also known to suppress stellar growth (Cunningham et al., 2011; Kuiper et al., 2015, 2016; Rosen & Krumholz, 2020). Outflows suppress the stellar growth rate by sweeping up interstellar material in polar directions of the star and ejecting the material from the star-forming system, as well as by decreasing the density in the polar directions and making stellar radiation feedback more effective. Strong magnetic fields also decelerate the growth rate since magnetic pressure slows down gravitational collapse of the cloud. Magnetic fields also enhance angular momentum transport by magnetic braking and inhibit the formation of a gravitationally unstable accretion disc which can cause fragmentation. These effects, however, may also suppress the accretion rate, rather than help the stellar growth (Section 3.2 of Rosen & Krumholz, 2020). The effects of outflows and magnetic fields in the SMS formation case need to be investigated to clarify if they could be obstacles for the SMS formation.
In order to more robustly judge whether the protostar emerging in the core of a dynamically heated, atomic-cooling halo, can grow to a SMS, multi-dimensional simulations will need to be performed, incorporating the asymmetric distribution and nonzero angular momentum of the nearby gas.
4.3.2 Resolution of the simulations
We set the innermost cell radius to , which is comparable to the initial protostar’s gravitational radius , assuming and (§ 2.1). We compare this radius to the size of the Hii region estimated from an equilibrium Stömgren sphere,
| (20) |
where is the ionising photon emissivity and is the case-B recombination rate of hydrogen. We find for , and (Schaerer, 2002), which is much smaller than either the gravitational influence radius or the resolution of our simulation. If we estimate assuming a density profile instead of a constant density, is even smaller, and becomes comparable to the initial stellar radius. If we resolved a region as small as in the simulations, an Hii region may begin to drive an outflow and expand in the early phase. However, the Hii region size (computed assuming the profile) is about four orders of magnitude smaller than the growing protostar’s Bondi radius. We conclude that even if the Hii-region is less compact due to an early outflow, it is unlikely to decelerate the inflow of neutral gas in the region and radiation feedback would not be effective to hinder gas accretion (Inayoshi et al., 2016; Sakurai et al., 2016b). Even as the stellar masses grow during the evolution in our simulation, remains below by at least two orders of magnitude. Although numerical limitations preclude us from using a smaller minimum cell radius and resolving the initial ultra-compact Hii-region, we expect that our main result, i.e. that the radiation feedback is ineffective, is not compromised by this limitation.
5 Summary
W19 argued, based on three-dimensional cosmological simulations, that SMSs may form in large atomic-cooling haloes in which H2 molecules are not fully dissociated by external FUV radiation. In this work, we followed the evolution of a protostar identified in one of the haloes (specifically, the halo “LWH” in W19), beyond the point where their simulation stopped. We performed 1-D radiation hydrodynamical simulations to explore if radiation feedback suppresses the growth of this protostar. We solved the non-equilibrium chemical reactions of nine primordial species, and included the radiation of the central source derived from stellar evolution models, as well as radiation from a circumstellar disc.
We found that a SMS with a mass of forms, even though stellar radiation feedback temporarily halts the accretion for . This feedback is caused by LW radiation from the protostar. The LW radiation dissociates H2 in the inner region, increasing the gas temperature and the gas pressure gradient force which opposes gravity. The feedback stops after , because the gas self-gravity and inward ram pressure force of the gas building up on larger scales overcome the outward pressure gradient force. Although the stellar UV radiation is strong, no Hii region forms during the evolution because of the high density and efficient hydrogen recombination. We conclude that the protostar can grow to , as long as the central density is at least 10% of the value found in W19. The main caveat to this conclusion is our assumption of spherical symmetry; radiation may have a stronger effect on an asymmetric collapse. Multi-dimensional simulations will be required to include these effects and to assess the robustness of our results.
Acknowledgements
The authors thank John Wise for fruitful discussions and comments and for providing data of the cloud profiles in W19. The authors also thank Shingo Hirano for providing cloud profile data in Hirano et al. (2015). This work is partially supported by Grant-in-Aid for JSPS Overseas Research Fellowships (YS), NASA grant NNX17AL82G and NSF grant 1715661 (ZH), the National Science Foundation of China (11721303, 11991052, 11950410493; KI), and the National Key R&D Program of China (2016YFA0400702; KI). The numerical simulations were partly performed using services and resources provided by the Partnership for an Advanced Computing Environment (PACE) at the Georgia Institute of Technology, Atlanta, Georgia, USA. The calculations were also carried out in part on Cray XC50 at Center for Computational Astrophysics, National Astronomical Observatory of Japan. The data underlying this article will be shared on reasonable request to the corresponding author.
References
- Abel et al. (1997) Abel T., Anninos P., Zhang Y., Norman M. L., 1997, New Astron., 2, 181
- Anninos et al. (1997) Anninos P., Zhang Y., Abel T., Norman M. L., 1997, New Astron., 2, 209
- Ardaneh et al. (2018) Ardaneh K., Luo Y., Shlosman I., Nagamine K., Wise J. H., Begelman M. C., 2018, MNRAS, 479, 2277
- Bañados et al. (2018) Bañados E., et al., 2018, Nature, 553, 473
- Bear & Soker (2020) Bear E., Soker N., 2020, New Astron., 81, 101438
- Becerra et al. (2015) Becerra F., Greif T. H., Springel V., Hernquist L. E., 2015, MNRAS, 446, 2380
- Begelman (2010) Begelman M. C., 2010, MNRAS, 402, 673
- Begelman et al. (2006) Begelman M. C., Volonteri M., Rees M. J., 2006, MNRAS, 370, 289
- Boekholt et al. (2018) Boekholt T. C. N., Schleicher D. R. G., Fellhauer M., Klessen R. S., Reinoso B., Stutz A. M., Haemmerlé L., 2018, MNRAS, 476, 366
- Bromm & Loeb (2003) Bromm V., Loeb A., 2003, ApJ, 596, 34
- Bromm et al. (2001) Bromm V., Kudritzki R. P., Loeb A., 2001, ApJ, 552, 464
- Chon & Omukai (2020) Chon S., Omukai K., 2020, MNRAS, 494, 2851
- Chon et al. (2016) Chon S., Hirano S., Hosokawa T., Yoshida N., 2016, ApJ, 832, 134
- Ciotti & Ostriker (2001) Ciotti L., Ostriker J. P., 2001, ApJ, 551, 131
- Cunningham et al. (2011) Cunningham A. J., Klein R. I., Krumholz M. R., McKee C. F., 2011, ApJ, 740, 107
- Dijkstra et al. (2008) Dijkstra M., Haiman Z., Mesinger A., Wyithe J. S. B., 2008, MNRAS, 391, 1961
- Draine (2011) Draine B. T., 2011, Physics of the Interstellar and Intergalactic Medium
- Fan et al. (2001) Fan X., et al., 2001, AJ, 122, 2833
- Fernandez et al. (2014) Fernandez R., Bryan G. L., Haiman Z., Li M., 2014, MNRAS, 439, 3798
- Field et al. (1966) Field G. B., Somerville W. B., Dressler K., 1966, ARA&A, 4, 207
- Glover & Abel (2008) Glover S. C. O., Abel T., 2008, MNRAS, 388, 1627
- Glover & Jappsen (2007) Glover S. C. O., Jappsen A. K., 2007, ApJ, 666, 1
- Haemmerlé et al. (2018) Haemmerlé L., Woods T. E., Klessen R. S., Heger A., Whalen D. J., 2018, MNRAS, 474, 2757
- Heger et al. (2003) Heger A., Fryer C. L., Woosley S. E., Langer N., Hartmann D. H., 2003, ApJ, 591, 288
- Hirano et al. (2014) Hirano S., Hosokawa T., Yoshida N., Umeda H., Omukai K., Chiaki G., Yorke H. W., 2014, ApJ, 781, 60
- Hirano et al. (2015) Hirano S., Hosokawa T., Yoshida N., Omukai K., Yorke H. W., 2015, MNRAS, 448, 568
- Hirano et al. (2017) Hirano S., Hosokawa T., Yoshida N., Kuiper R., 2017, Science, 357, 1375
- Hosokawa et al. (2013) Hosokawa T., Yorke H. W., Inayoshi K., Omukai K., Yoshida N., 2013, ApJ, 778, 178
- Hosokawa et al. (2016) Hosokawa T., Hirano S., Kuiper R., Yorke H. W., Omukai K., Yoshida N., 2016, ApJ, 824, 119
- Hui & Gnedin (1997) Hui L., Gnedin N. Y., 1997, MNRAS, 292, 27
- Inayoshi & Haiman (2014) Inayoshi K., Haiman Z., 2014, MNRAS, 445, 1549
- Inayoshi et al. (2014) Inayoshi K., Omukai K., Tasker E., 2014, MNRAS, 445, L109
- Inayoshi et al. (2016) Inayoshi K., Haiman Z., Ostriker J. P., 2016, MNRAS, 459, 3738
- Inayoshi et al. (2018) Inayoshi K., Li M., Haiman Z., 2018, MNRAS, 479, 4017
- Inayoshi et al. (2019) Inayoshi K., Visbal E., Haiman Z., 2019, arXiv e-prints, p. arXiv:1911.05791
- Kato et al. (2008) Kato S., Fukue J., Mineshige S., 2008, Black-Hole Accretion Disks — Towards a New Paradigm —
- Kuiper et al. (2015) Kuiper R., Yorke H. W., Turner N. J., 2015, ApJ, 800, 86
- Kuiper et al. (2016) Kuiper R., Turner N. J., Yorke H. W., 2016, ApJ, 832, 40
- Latif et al. (2016) Latif M. A., Omukai K., Habouzit M., Schleicher D. R. G., Volonteri M., 2016, ApJ, 823, 40
- Loeb & Rasio (1994) Loeb A., Rasio F. A., 1994, ApJ, 432, 52
- Luo et al. (2018) Luo Y., Ardaneh K., Shlosman I., Nagamine K., Wise J. H., Begelman M. C., 2018, MNRAS, 476, 3523
- Marigo et al. (2001) Marigo P., Girardi L., Chiosi C., Wood P. R., 2001, A&A, 371, 152
- Matsuoka et al. (2016) Matsuoka Y., et al., 2016, ApJ, 828, 26
- McKee & Tan (2008) McKee C. F., Tan J. C., 2008, ApJ, 681, 771
- Milosavljević et al. (2009) Milosavljević M., Couch S. M., Bromm V., 2009, ApJ, 696, L146
- Mortlock et al. (2011) Mortlock D. J., et al., 2011, Nature, 474, 616
- Novak et al. (2011) Novak G. S., Ostriker J. P., Ciotti L., 2011, ApJ, 737, 26
- Oh & Haiman (2002) Oh S. P., Haiman Z., 2002, ApJ, 569, 558
- Omukai (2000) Omukai K., 2000, ApJ, 534, 809
- Omukai (2001) Omukai K., 2001, ApJ, 546, 635
- Omukai & Palla (2001) Omukai K., Palla F., 2001, ApJ, 561, L55
- Omukai & Palla (2003) Omukai K., Palla F., 2003, ApJ, 589, 677
- Onoue et al. (2019) Onoue M., et al., 2019, ApJ, 880, 77
- Park & Ricotti (2011) Park K., Ricotti M., 2011, ApJ, 739, 2
- Paxton et al. (2011) Paxton B., Bildsten L., Dotter A., Herwig F., Lesaffre P., Timmes F., 2011, ApJS, 192, 3
- Reed et al. (2019) Reed S. L., et al., 2019, MNRAS, 487, 1874
- Regan et al. (2014) Regan J. A., Johansson P. H., Wise J. H., 2014, ApJ, 795, 137
- Regan et al. (2017) Regan J. A., Visbal E., Wise J. H., Haiman Z., Johansson P. H., Bryan G. L., 2017, Nature Astronomy, 1, 0075
- Regan et al. (2020) Regan J. A., Wise J. H., Woods T. E., Downes T. P., O’Shea B. W., Norman M. L., 2020, arXiv e-prints, p. arXiv:2008.08090
- Reinoso et al. (2018) Reinoso B., Schleicher D. R. G., Fellhauer M., Klessen R. S., Boekholt T. C. N., 2018, A&A, 614, A14
- Rosen & Krumholz (2020) Rosen A. L., Krumholz M. R., 2020, AJ, 160, 78
- Sakurai et al. (2015) Sakurai Y., Hosokawa T., Yoshida N., Yorke H. W., 2015, MNRAS, 452, 755
- Sakurai et al. (2016a) Sakurai Y., Vorobyov E. I., Hosokawa T., Yoshida N., Omukai K., Yorke H. W., 2016a, MNRAS, 459, 1137
- Sakurai et al. (2016b) Sakurai Y., Inayoshi K., Haiman Z., 2016b, MNRAS, 461, 4496
- Sakurai et al. (2017) Sakurai Y., Yoshida N., Fujii M. S., Hirano S., 2017, MNRAS, 472, 1677
- Sakurai et al. (2019) Sakurai Y., Yoshida N., Fujii M. S., 2019, MNRAS, 484, 4665
- Schaerer (2002) Schaerer D., 2002, A&A, 382, 28
- Schauer et al. (2017) Schauer A. T. P., Regan J., Glover S. C. O., Klessen R. S., 2017, MNRAS, 471, 4878
- Schleicher et al. (2013) Schleicher D. R. G., Palla F., Ferrara A., Galli D., Latif M., 2013, A&A, 558, A59
- Stone & Norman (1992) Stone J. M., Norman M. L., 1992, ApJS, 80, 753
- Sugimura et al. (2014) Sugimura K., Omukai K., Inoue A. K., 2014, MNRAS, 445, 544
- Tagawa et al. (2020) Tagawa H., Haiman Z., Kocsis B., 2020, ApJ, 892, 36
- Tan & McKee (2004) Tan J. C., McKee C. F., 2004, ApJ, 603, 383
- Tegmark et al. (1997) Tegmark M., Silk J., Rees M. J., Blanchard A., Abel T., Palla F., 1997, ApJ, 474, 1
- Turk et al. (2011) Turk M. J., Clark P., Glover S. C. O., Greif T. H., Abel T., Klessen R., Bromm V., 2011, ApJ, 726, 55
- Umeda et al. (2016) Umeda H., Hosokawa T., Omukai K., Yoshida N., 2016, ApJ, 830, L34
- Verner et al. (1996) Verner D. A., Ferland G. J., Korista K. T., Yakovlev D. G., 1996, ApJ, 465, 487
- Visbal et al. (2014) Visbal E., Haiman Z., Bryan G. L., 2014, MNRAS, 445, 1056
- Whalen & Norman (2006) Whalen D., Norman M. L., 2006, ApJS, 162, 281
- Wise et al. (2019) Wise J. H., Regan J. A., O’Shea B. W., Norman M. L., Downes T. P., Xu H., 2019, Nature, 566, 85 [W19]
- Wolcott-Green & Haiman (2019) Wolcott-Green J., Haiman Z., 2019, MNRAS, 484, 2467
- Wolcott-Green et al. (2011) Wolcott-Green J., Haiman Z., Bryan G. L., 2011, MNRAS, 418, 838
- Woods et al. (2017) Woods T. E., Heger A., Whalen D. J., Haemmerlé L., Klessen R. S., 2017, ApJ, 842, L6
- Wu et al. (2015) Wu X.-B., et al., 2015, Nature, 518, 512
- Yan et al. (1998) Yan M., Sadeghpour H. R., Dalgarno A., 1998, ApJ, 496, 1044
- Yang et al. (2020) Yang J., et al., 2020, ApJ, 897, L14
- Yorke & Bodenheimer (2008) Yorke H. W., Bodenheimer P., 2008, Theoretical Developments in Understanding Massive Star Formation. p. 189
- Yoshida et al. (2003) Yoshida N., Abel T., Hernquist L., Sugiyama N., 2003, ApJ, 592, 645
- Yoshida et al. (2006) Yoshida N., Omukai K., Hernquist L., Abel T., 2006, ApJ, 652, 6