Effect of receptor clustering on chemotactic performance of Escherichia coli: sensing versus adaptation
Abstract
We show how the competition between sensing and adaptation can result in a performance peak in E.coli chemotaxis using extensive numerical simulations in a detailed theoretical model. Receptor clustering amplifies the input signal coming from ligand binding which enhances chemotactic efficiency. But large clusters also induce large fluctuations in total activity since the number of clusters go down. The activity and hence the run-tumble motility now gets controlled by methylation levels which are part of adaptation module, rather than ligand binding. This reduces chemotactic efficiency.
With the advent of sophisticated techniques to measure single-cell response in experiments sourjik2002receptor ; turner2000real , an important question has emerged: how behavior of a cell is affected by the fluctuations present in the intracellular biochemical reaction network elowitz2002stochastic ; raj2008nature ; rao2002control ; lan2016information . In this paper we address this question for Escherichia coli chemotaxis, one of the best characterized systems in biology berg2008coli .
The chemotaxis describes the migration tendency of the Escherichia coli cell towards the region of higher nutrient concentration. The underlying biochemical network has two main modules, sensing and adaptation, which are coupled to each other through the activity of the transmembrane chemoreceptors. The receptor activity changes with binding of the receptor to the nutrient ligand molecules, and with methylation. There are a few thousand receptors in a cell and they show strong cooperativity where the neighboring receptors form clusters or ‘teams’ and switch between active and inactive states in unison. This helps in amplification of the input signal coming from ligand binding and allows the cell to respond to even weak gradient of nutrient concentration frank2016networked ; duke1999heightened ; bray1998receptor .
In recent experiments involving single cell FRET measurements it was observed that receptor clustering results in surprisingly large activity fluctuations inside a cell colin2017multiple ; keegstra2017phenotypic even in the absence of methylation noise. This observation was striking since methylation was long believed to be the most important source of noise in a chemotaxis network korobkova2004molecular ; matthaus2011origin ; flores2012signaling ; dev2018optimal ; tu2005white . The experiments in Refs. colin2017multiple ; keegstra2017phenotypic showed that receptor clustering is an independent and equally important noise source in the pathway. The immediate and important question here is, how this newly found noise source is related to the chemotactic performance of the cell.
In this work, we address this question within a detailed theoretical model and find that there is an optimum size of the receptor cluster at which the chemotactic performance is at its best. Since receptor clustering amplifies the input signal coming from ligand binding, it is expected to enhance the cell performance frank2016networked ; duke1999heightened ; bray1998receptor . However, when clusters become significantly large, the total number of clusters goes down proportionately. The total activity of the cell, which is the sum of activity of all the clusters, starts showing large fluctuations since the sum is now performed over a small number of signaling teams (also see Sec. of Ref. sup_mat ). When the activity gets too high or too low, the adaptation comes into play and the receptor methylation level undergoes large change to restore the activity to its mean value. Our data show that the total activity which controls the run-and-tumble motility of the cell is guided by methylation, rather than ligand binding for large receptor clusters. This reduces the chemotactic efficiency of the cell and its performance goes down.
Our study brings out a fundamentally important point: how competition between sensing and adaptation may result in a performance peak. We demonstrate this by monitoring several different quantities as measures of performance. In the presence of a spatially varying nutrient concentration profile we define a good chemotactic performance by measuring how fast the cell is able to climb up the gradient, or how strongly it is able to localize itself in the nutrient-rich regions dev2015optimal ; dev2018optimal . A good performance implies a strong ability of the cell to distinguish between regions with high and low nutrient concentration. We find that for an optimal size of the receptor cluster this ability is most pronounced. Interestingly, our conclusion remains valid even when the cell is tethered and is not moving around using run-tumble motility. In this case we define the performance by the differential response of the cell when the nutrient level at its location is increased or decreased. The rotational bias of the flagellar motors shows maximum difference between the ramped up and ramped down inputs at a specific size of the receptor cluster.
Model: In an E. coli cell the chemoreceptors pair up to form homodimers and three such homodimers form a trimer of dimers (TD) liu2012molecular ; briegel2012bacterial . In our description, a signaling team of size contains number of TDs. The free energy difference (in units of ) between the active and inactive states of a dimer is calculated according to Monod-Wyman-Changeux model mello2005allosteric ; keymer2006chemosensing ; monod1965nature :
| (1) |
where is the nutrient concentration at the cell location and is the methylation level of the dimer which can take integer values between and . The constants and set the range within which a chemical concentration can be sensed by the cell. The total free energy of the cluster is the sum of free energy of the individual dimers. All dimers in a cluster change their activity states simultaneously and the transition probability depends on the cluster free energy sup_mat .
The methylation level of a dimer is controlled by methylating enzyme CheR and demethylating enzyme CheB-P. A dimer can bind to one enzyme molecule at a time. An inactive dimer gets methylated by CheR and the probability to find it in active state increases. On the other hand, an active dimer gets demethylated by CheB-P and its activity decreases. Unphosphorylated CheB receives its phosphate group from autophosphorylation of active receptors. This constitutes a negative feedback in the reaction network and is responsible for adaptation. Autophosphorylation of active receptors also supplies phosphate group to another protein CheY and the resulting CheY-P binds to the flagellar motors and induces tumbling in the cell motion. A high value of total activity implies large tumbling probability.
However, the number of enzyme molecules is far too low compared to the number of dimers in a cell li2004cellular and it takes a long time for a dimer to bind to an unbound enzyme molecule in cell cytoplasm schulmeister2008protein . To reconcile the low abundance of enzyme molecules with near-perfect adaptation of the cell berg1975transient ; goy1977sensory , few mechanisms like ‘brachiation’ or ‘assistance neighborhood’ have been proposed levin2002binding ; endres2006precise ; hansen2008chemotaxis and experimentally verified kim2002dynamic ; li2005adaptational which allow a single bound enzyme to modify the methylation level of more than one dimers before it unbinds and returns to the cell cytoplasm keymer2006chemosensing ; le1997methylation ; hansen2008chemotaxis . We include a flavor of this mechanism in our model. A complete description of our model and other simulation details can be found in Ref sup_mat . We perform Monte Carlo simulations on this model in one and two spatial dimensions. We present the data for two dimensions below and include those for one dimension in sup_mat .
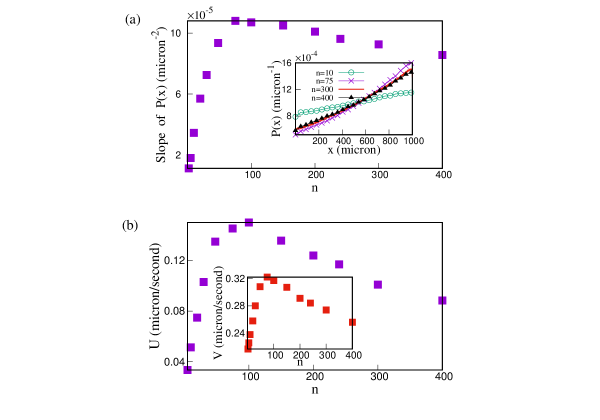
Performance peak at an optimal size of receptor cluster: For a swimming cell with a linearly varying , the steady state position distribution of the cell also assumes an almost linear form (see inset of Fig. 1a). Clearly, a good performance implies a steep slope of . In Fig. 1a (main plot) we plot this slope as a function of receptor cluster size and find a peak. A related quantity which gives the average nutrient amount experienced by the cell, is often used to characterize performance when or is not linear dev2018optimal ; flores2012signaling ; celani2010bacterial . We find a similar peak in also (data not shown here). Chemotactic drift velocity measures how fast the cell climbs up the concentration gradient and a large implies a good performance. To extract from the run-and-tumble trajectory of the cell we measure the mean value of net displacement of the cell in a run and divide it by the mean run duration de2004chemotaxis ; chatterjee2011chemotaxis ; pankratova2018chemotactic ; samanta2017predicting ; dev2018optimal . We present our data in Fig. 1b inset which shows a pronounced peak. Another possible way to measure the drift velocity is from the net displacement in a fixed time interval and divide that by . In the main plot of Fig. 1b we show the plot for this quantity, denoted as and find a similar peak.
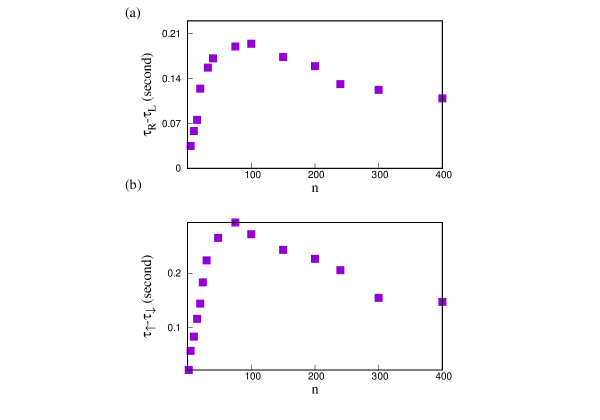
At the core of chemotactic sensing lies the differential behavior of the cell when the nutrient level in its environment goes up or down. This difference should be large for a good performance. When a cell is running in the direction of increasing nutrient concentration, its tumbling rate decreases and the run is extended. Similarly, for a run towards lower nutrient level, the tumbling rate increases and the run is shortened. We measure the time till the first tumble during an uphill run and a downhill run and plot their difference in Fig. 2a. This difference shows a peak at a specific size of the receptor cluster. Interestingly, we can use a similar measure to quantify performance for a tethered cell as well, which is more commonly used in experiments. In this case we apply a nutrient concentration that is increasing (decreasing) linearly with time while the flagellar motors are rotating in the counter clockwise (CCW) direction. We measure the average time till the transition to clockwise (CW) rotation mode. In order to compare with the swimming cell, we change the nutrient level at the same rate as that experienced by a swimming cell during a run. We plot the difference between ramped up and ramped down cases in Fig 2b and find a peak at the optimal cluster size.
From our data in Figs. 1 and 2 it follows that for various different performance criteria, the single cell chemotaxis shows optimality. The position of the performance peak may slightly vary depending on the specific measure we use to quantify performance, as seen in the above plots. But the most striking feature here is the existence of a peak at some value of . Below we explain the origin behind this effect.
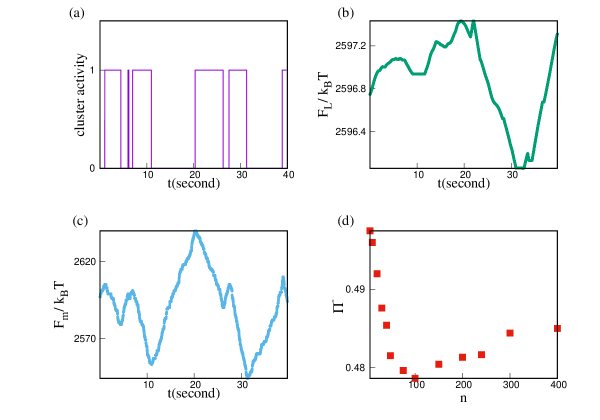
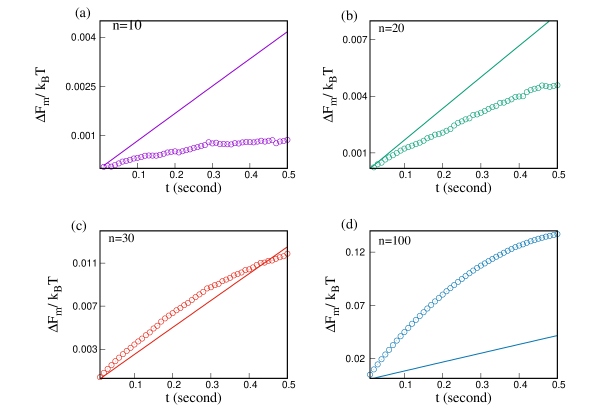
Competition between sensing and adaptation: The probability to find a receptor cluster in the active state is , where is the sum of ligand binding energy of all dimers in the cluster and is the total methylation of all those dimers. Since the contribution due to ligand binding is the same for all dimers, is proportional to . As the cell swims up (down) the ligand concentration gradient, increases (decreases) with time [see Eq. (1)] and this change is proportionately larger with . This means as increases, the activity of a receptor cluster decreases (increases) quickly during an uphill (downhill) run, thereby elongating (shortening) the run, since activity controls the tumbling rate (see model details in Ref. sup_mat ). This is why the chemotactic performance gets better with . For large , however, the number of clusters is less and the activity which is calculated by averaging over all clusters, now shows large fluctuations. Switching the activity state of one large cluster brings about large change in the total activity of the cell. For example, when the activity gets too low, all the inactive dimers in a cluster tend to get methylated. This increases significantly and the change in overrides the change in . See Fig. 3 for a typical time-series of cluster activity, and for a large value. In Fig. 4 we plot the average change in methylation free energy as a function of time during an uphill run of the cell for various different . The change in has been shown with a continuous line for reference. These plots clearly show for large the change in overtakes the change in . The variation in cluster free energy is then controlled by . The cell is now less sensitive to the ligand concentration profile. A shorter uphill run and a longer downhill run now become increasingly likely. In Fig. 3d we plot the probability to find a negative net displacement of the cell during a time interval and indeed after reaching a minimum this probability increases again for large . This reduces the value of the chemotactic drift velocity and brings down the performance when is large.
Throughout this work, we have considered weak spatial gradient of the nutrient (see Table S1 in Ref. sup_mat ). Even in the presence of a strong gradient our main conclusions remain valid and we find the optimal cluster size is somewhat larger when the gradient is stronger (data shown in Fig. S5 in Ref. sup_mat ). Although rapid spatial variation of nutrient has been shown to induce large activity fluctuations in the cell long2017feedback ; sun2017macroscopic ; micali2017drift ; xue2016moment which is expected to trigger a stronger methylation response, the ligand free energy changes by a larger amount when the cell is running through a rapidly varying nutrient profile which shifts the trade-off point towards a larger cluster size.
Conclusions: In this work we have investigated the role of receptor clustering on the chemotactic efficiency of a cell. Although receptor cooperativity amplifies the cell sensitivity towards small variation in nutrient level, the activity fluctuations inside the cell also increase since the number of clusters go down. Large deviation of activity from its mean value triggers large change in methylation levels to ensure adaptation in the biochemical network. The ligand binding energy cannot keep up with such large change in methylation energy and the free energy difference between the active and inactive states gets controlled by methylation now. The above interplay gives rise to a performance peak at an intermediate value of the receptor cluster size.
For a noisy nutrient environment, an optimal size of the receptor signaling team was reported in earlier studies endres2008variable ; aquino2011optimal . It was argued that receptor cooperativity amplifies not only the ligand signal, but also the noise present in it. For optimal performance, therefore, a trade-off is required where the signaling team size should be large enough for sensitive detection of small changes in ligand concentration, but small enough such that the amplified noise does not insensitize the cell response endres2008variable . Moreover, when both ligand noise and intracellular biochemical noise are considered, the receptor clustering is beneficial as long as the amplified ligand noise stays below the biochemical noise aquino2011optimal . On the other hand, we find an optimal team size even when the ligand concentration profile does not fluctuate with time, and the origin of this optimality to our best knowledge has not been reported previously.
It should be possible to test our results qualitatively in experiment. Both for a swimming cell and tethered cell we have observed the best chemotactic performance at a specific size of the receptor cluster. In our model the best performance is observed for clusters which contain TDs. However, it may not be possible to find accurate quantitative agreement between our model and experiments. To keep our model simple and tractable, we have not considered a few aspects of the intracellular reaction network, like hexagonal geometry of the spatial arrangement of the receptor array briegel2012bacterial ; liu2012molecular , or more importantly, the energy cost due to curvature of the cell membrane induced by the receptor clusters endres2009polar ; haselwandter2014role ; draper2017origins . But our main conclusions should not get affected by these assumptions and the interplay between ligand free energy and methylation free energy can be experimentally investigated as the cooperative interaction among the receptors is varied colin2017multiple ; keegstra2017phenotypic . A stronger interaction among the receptors which is responsible for formation of larger clusters, has been experimentally shown to induce larger activity fluctuations in a tethered cell colin2017multiple ; keegstra2017phenotypic . Whether the variation of methylation free energy increases for stronger receptor interaction and its effect on the chemotactic efficiency, (Fig. 2b) can be investigated in experiments. Finally, our study opens up the important question of competition between sensing and adaptation, which is relevant in a wide variety of biological systems gepshtein2013sensory ; solomon2014moving ; wark2007sensory . It would be interesting to see if this competition gives rise to similar performance peaks in this broad class of systems as well.
Acknowledgements
SDM acknowledges a research fellowship [Grant No. 09/575(0122)/2019-EMR -I] from the Council of Scientific and Industrial Research (CSIR), India. SC acknowledges financial support from the Science and Engineering Research Board, India (Grant No: MTR/2019/000946).
References
- (1) Victor Sourjik and Howard C Berg. Receptor sensitivity in bacterial chemotaxis. Proceedings of the National Academy of Sciences, 99(1):123–127, 2002.
- (2) Linda Turner, William S Ryu, and Howard C Berg. Real-time imaging of fluorescent flagellar filaments. Journal of bacteriology, 182(10):2793–2801, 2000.
- (3) Michael B Elowitz, Arnold J Levine, Eric D Siggia, and Peter S Swain. Stochastic gene expression in a single cell. Science, 297(5584):1183–1186, 2002.
- (4) Arjun Raj and Alexander Van Oudenaarden. Nature, nurture, or chance: stochastic gene expression and its consequences. Cell, 135(2):216–226, 2008.
- (5) Christopher V Rao, Denise M Wolf, and Adam P Arkin. Control, exploitation and tolerance of intracellular noise. Nature, 420(6912):231–237, 2002.
- (6) Ganhui Lan and Yuhai Tu. Information processing in bacteria: memory, computation, and statistical physics: a key issues review. Reports on Progress in Physics, 79(5):052601, 2016.
- (7) Howard C Berg. E. coli in Motion. Springer Science & Business Media, Heidelberg, 2008.
- (8) Vered Frank, Germán E Piñas, Harel Cohen, John S Parkinson, and Ady Vaknin. Networked chemoreceptors benefit bacterial chemotaxis performance. MBio, 7(6):e01824, 2016.
- (9) TAJ Duke and Dennis Bray. Heightened sensitivity of a lattice of membrane receptors. Proceedings of the National Academy of Sciences, 96(18):10104–10108, 1999.
- (10) Dennis Bray, Matthew D Levin, and Carl J Morton-Firth. Receptor clustering as a cellular mechanism to control sensitivity. Nature, 393(6680):85–88, 1998.
- (11) Remy Colin, Christelle Rosazza, Ady Vaknin, and Victor Sourjik. Multiple sources of slow activity fluctuations in a bacterial chemosensory network. Elife, 6:e26796, 2017.
- (12) Johannes M Keegstra, Keita Kamino, François Anquez, Milena D Lazova, Thierry Emonet, and Thomas S Shimizu. Phenotypic diversity and temporal variability in a bacterial signaling network revealed by single-cell fret. Elife, 6:e27455, 2017.
- (13) Ekaterina Korobkova, Thierry Emonet, Jose MG Vilar, Thomas S Shimizu, and Philippe Cluzel. From molecular noise to behavioural variability in a single bacterium. Nature, 428(6982):574–578, 2004.
- (14) Franziska Matthäus, Mario S Mommer, Tine Curk, and Jure Dobnikar. On the origin and characteristics of noise-induced lévy walks of e. coli. PloS one, 6(4):e18623, 2011.
- (15) Marlo Flores, Thomas S Shimizu, Pieter Rein ten Wolde, and Filipe Tostevin. Signaling noise enhances chemotactic drift of e. coli. Physical review letters, 109(14):148101, 2012.
- (16) Subrata Dev and Sakuntala Chatterjee. Optimal methylation noise for best chemotactic performance of e. coli. Physical Review E, 97(3):032420, 2018.
- (17) Yuhai Tu and G Grinstein. How white noise generates power-law switching in bacterial flagellar motors. Physical review letters, 94(20):208101, 2005.
- (18) See supplementary materials here for details of the model, simulation technique, list of paramter values and additional data.
- (19) Subrata Dev and Sakuntala Chatterjee. Optimal search in e. coli chemotaxis. Physical Review E, 91(4):042714, 2015.
- (20) Jun Liu, Bo Hu, Dustin R Morado, Sneha Jani, Michael D Manson, and William Margolin. Molecular architecture of chemoreceptor arrays revealed by cryoelectron tomography of escherichia coli minicells. Proceedings of National Academy of Sciences, 109(23):E1481–E1488, 2012.
- (21) Ariane Briegel, Xiaoxiao Li, Alexandrine M Bilwes, Kelly T Hughes, Grant J Jensen, and Brian R Crane. Bacterial chemoreceptor arrays are hexagonally packed trimers of receptor dimers networked by rings of kinase and coupling proteins. Proceedings of the National Academy of Sciences, 109(10):3766–3771, 2012.
- (22) Bernardo A Mello and Yuhai Tu. An allosteric model for heterogeneous receptor complexes: understanding bacterial chemotaxis responses to multiple stimuli. Proceedings of the National Academy of Sciences, 102(48):17354–17359, 2005.
- (23) Juan E Keymer, Robert G Endres, Monica Skoge, Yigal Meir, and Ned S Wingreen. Chemosensing in escherichia coli: two regimes of two-state receptors. Proceedings of the National Academy of Sciences, 103(6):1786–1791, 2006.
- (24) Jacque Monod, Jeffries Wyman, and Jean-Pierre Changeux. On the nature of allosteric transitions: a plausible model. J Mol Biol, 12(1):88–118, 1965.
- (25) Mingshan Li and Gerald L Hazelbauer. Cellular stoichiometry of the components of the chemotaxis signaling complex. Journal of bacteriology, 186(12):3687–3694, 2004.
- (26) Sonja Schulmeister, Michaela Ruttorf, Sebastian Thiem, David Kentner, Dirk Lebiedz, and Victor Sourjik. Protein exchange dynamics at chemoreceptor clusters in escherichia coli. Proceedings of the National Academy of Sciences, 105(17):6403–6408, 2008.
- (27) Howard C Berg and PM Tedesco. Transient response to chemotactic stimuli in escherichia coli. Proceedings of the National Academy of Sciences, 72(8):3235–3239, 1975.
- (28) Michael F Goy, Martin S Springer, and Julius Adler. Sensory transduction in escherichia coli: role of a protein methylation reaction in sensory adaptation. Proceedings of the National Academy of Sciences, 74(11):4964–4968, 1977.
- (29) Matthew D Levin, Thomas S Shimizu, and Dennis Bray. Binding and diffusion of cher molecules within a cluster of membrane receptors. Biophysical journal, 82(4):1809–1817, 2002.
- (30) Robert G Endres and Ned S Wingreen. Precise adaptation in bacterial chemotaxis through “assistance neighborhoods”. Proceedings of the National Academy of Sciences, 103(35):13040–13044, 2006.
- (31) Clinton H Hansen, Robert G Endres, and Ned S Wingreen. Chemotaxis in escherichia coli: a molecular model for robust precise adaptation. PLoS Comput Biol, 4(1):e1, 2008.
- (32) Sung-Hou Kim, Weiru Wang, and Kyeong Kyu Kim. Dynamic and clustering model of bacterial chemotaxis receptors: structural basis for signaling and high sensitivity. Proceedings of the National Academy of Sciences, 99(18):11611–11615, 2002.
- (33) Mingshan Li and Gerald L Hazelbauer. Adaptational assistance in clusters of bacterial chemoreceptors. Molecular microbiology, 56(6):1617–1626, 2005.
- (34) Hervé Le Moual, Tony Quang, and Daniel E Koshland. Methylation of the escherichia coli chemotaxis receptors: intra-and interdimer mechanisms. Biochemistry, 36(43):13441–13448, 1997.
- (35) Antonio Celani and Massimo Vergassola. Bacterial strategies for chemotaxis response. Proceedings of the National Academy of Sciences, 107(4):1391–1396, 2010.
- (36) P-G De Gennes. Chemotaxis: the role of internal delays. European Biophysics Journal, 33(8):691–693, 2004.
- (37) Sakuntala Chatterjee, Rava Azeredo da Silveira, and Yariv Kafri. Chemotaxis when bacteria remember: drift versus diffusion. PLoS computational biology, 7(12), 2011.
- (38) Evgeniya V Pankratova, Alena I Kalyakulina, Mikhail I Krivonosov, Sergei V Denisov, Katja M Taute, and Vasily Yu Zaburdaev. Chemotactic drift speed for bacterial motility pattern with two alternating turning events. PloS one, 13(1):e0190434, 2018.
- (39) Sibendu Samanta, Ritwik Layek, Shantimoy Kar, M Kiran Raj, Sudipta Mukhopadhyay, and Suman Chakraborty. Predicting escherichia coli’s chemotactic drift under exponential gradient. Physical Review E, 96(3):032409, 2017.
- (40) Junjiajia Long, Steven W Zucker, and Thierry Emonet. Feedback between motion and sensation provides nonlinear boost in run-and-tumble navigation. PLoS computational biology, 13(3):e1005429, 2017.
- (41) Weiran Sun and Min Tang. Macroscopic limits of pathway-based kinetic models for e. coli chemotaxis in large gradient environments. Multiscale Modeling & Simulation, 15(2):797–826, 2017. DOI: 10.1137/16M1074011
- (42) Gabriele Micali, Rémy Colin, Victor Sourjik, and Robert G Endres. Drift and behavior of e. coli cells. Biophysical journal, 113(11):2321–2325, 2017.
- (43) Chuan Xue and Xige Yang. Moment-flux models for bacterial chemotaxis in large signal gradients. Journal of mathematical biology, 73(4):977–1000, 2016.
- (44) Robert G Endres, Olga Oleksiuk, Clinton H Hansen, Yigal Meir, Victor Sourjik, and Ned S Wingreen. Variable sizes of escherichia coli chemoreceptor signaling teams. Molecular systems biology, 4(1):211, 2008.
- (45) Gerardo Aquino, Diana Clausznitzer, Sylvain Tollis, and Robert G Endres. Optimal receptor-cluster size determined by intrinsic and extrinsic noise. Physical Review E, 83(2):021914, 2011.
- (46) Robert G Endres. Polar chemoreceptor clustering by coupled trimers of dimers. Biophysical journal, 96(2):453–463, 2009.
- (47) Christoph A Haselwandter and Ned S Wingreen. The role of membrane-mediated interactions in the assembly and architecture of chemoreceptor lattices. PLoS computational biology, 10(12):e1003932, 2014.
- (48) Will Draper and Jan Liphardt. Origins of chemoreceptor curvature sorting in escherichia coli. Nature communications, 8(1):1–9, 2017.
- (49) Sergei Gepshtein, Luis A Lesmes, and Thomas D Albright. Sensory adaptation as optimal resource allocation. Proceedings of the National Academy of Sciences, 110(11):4368–4373, 2013.
- (50) Samuel G Solomon and Adam Kohn. Moving sensory adaptation beyond suppressive effects in single neurons. Current Biology, 24(20):R1012–R1022, 2014.
- (51) Barry Wark, Brian Nils Lundstrom, and Adrienne Fairhall. Sensory adaptation. Current opinion in neurobiology, 17(4):423–429, 2007.