Are the Milky Way and Andromeda unusual? A comparison with Milky Way and Andromeda Analogs
Abstract
Our Milky Way provides a unique test case for galaxy evolution models, thanks to our privileged position within the Milky Way’s disc. This position also complicates comparisons between the Milky Way and external galaxies, due to our inability to observe the Milky Way from an external point of view. Milky Way analog galaxies offer us a chance to bridge this divide by providing the external perspective that we otherwise lack. However, over-precise definitions of “analog” yield little-to-no galaxies, so it is vital to understand which selection criteria produce the most meaningful analog samples. To address this, we compare the properties of complementary samples of Milky Way analogs selected using different criteria. We find the Milky Way to be within 1 of its analogs in terms of star-formation rate and bulge-to-total ratio in most cases, but we find larger offsets between the Milky Way and its analogs in terms of disc scale length; this suggests that scale length must be included in analog selections in addition to other criteria if the most accurate analogs are to be selected. We also apply our methodology to the neighbouring Andromeda galaxy. We find analogs selected on the basis of strong morphological features to display much higher star-formation rates than Andromeda, and we also find analogs selected on Andromeda’s star-formation rate to over-predict Andromeda’s bulge extent. This suggests both structure and star-formation rate should be considered when selecting the most stringent Andromeda analogs.
keywords:
galaxies: spiral – galaxies: ISM – ISM: general galaxies: structure – galaxies: stellar content – galaxies: general – galaxies: statistics1 Introduction
The question of how galaxies form and evolve remains a problem of significant interest in extragalactic astrophysics. The last two decades have seen major progress on this topic, thanks in particular to the census of local Universe galaxies undertaken by the Sloan Digital Sky Survey (SDSS; York et al., 2000). SDSS data conclusively demonstrated a bimodality in terms of both galaxies’ integrated colors (Strateva et al., 2001) and integrated magnitudes (Baldry et al., 2004), with the majority of galaxies being either star-forming “blue cloud" galaxies or quiescent “red sequence" galaxies. At the same time, a minority of galaxies can be seen to occupy the intermediate “green valley" when plotted on color-magnitude diagrams. It is commonly accepted that the green valley is occupied by galaxies in the process of transitioning from star-forming to quiescent. However, a large number of precise evolution pathways are needed to fully explain the range of observed galaxy properties such as integrated color, star-formation rate and morphology (e.g. Bell et al., 2004; Faber et al., 2007; Schawinski et al., 2014; Smethurst et al., 2015).
Our own Milky Way (MW) remains a key source of insight into both the structures of galaxies and the physics of galaxy evolution on small scales. Traditionally, the MW has been understood to contain both a younger “thin disc" and an older alpha-enhanced “thick disc" (Yoshii, 1982; Gilmore & Reid, 1983; Chiappini et al., 1997; Bensby et al., 2003; Haywood et al., 2013; Xiang et al., 2017; Wu et al., 2019), which produces an observed bimodality in alpha abundance ratios at intermediate MW stellar metallicities (e.g. Fuhrmann, 1998, 2011; Anders et al., 2014; Nidever et al., 2014; Mikolaitis et al., 2014; Recio-Blanco et al., 2014; Hayden et al., 2015); such a bimodality is observed in both the MW’s disc (e.g. Hayden et al., 2015) and bulge (Rojas-Arriagada et al., 2019; Queiroz et al., 2019). The MW’s inner region is dominated by a cylindrical-rotating boxy-peanut “pseudobulge" (e.g. Dwek et al., 1995; McWilliam & Zoccali, 2010) along with a stellar bar (e.g. Hammersley et al., 1994; Weiland et al., 1994; Wegg & Gerhard, 2013). In addition, the MW may also contain a small “classical" bulge component made up of old stars (e.g. Dékány et al., 2013; Barbuy et al., 2018).
The last decade has proven particularly fruitful in regards to our understanding of the MW, with a number of spectroscopic surveys observing stars over large regions of the MW’s stellar disc. These surveys include RAVE (Steinmetz et al., 2006), LEGUE (Deng et al., 2012), LAMOST (Cui et al., 2012), the Gaia-ESO survey (Gilmore et al., 2012), GALAH (De Silva et al., 2015), and APOGEE (Majewski et al., 2017). Such data sets have challenged the traditional two-population view of the MW’s stars, with the MW instead appearing to consist of a broad continuum of chemo-dynamical stellar subpopulations (e.g. Bovy et al., 2012; Mackereth et al., 2017; Buder et al., 2019). Furthermore, it has become clear that the geometrical thin and thick discs of the MW are not the same structures as the chemical thin and thick discs (e.g. Minchev et al., 2015; Martig et al., 2016).
However, the MW’s position within the galactic population remains poorly understood, which complicates the interpretation of MW results in the wider extragalactic context. This situation results from our position within the MW’s disc, from which large regions of the MW remain difficult to observe. Dust extinction preferentially reddens stars away from the solar region, limiting the number of stars that can be observed particularly at UV and optical wavelengths (e.g. Schlegel et al., 1998; Schlafly & Finkbeiner, 2011; Queiroz et al., 2019); this especially complicates the analysis of stars beyond the central stellar bulge and bar. It is therefore difficult to determine integrated quantities for the MW such as optical color (e.g. Mutch et al., 2011), which can be straightforwardly calculated for nearby galaxies.
It thus remains unclear how common the MW’s properties are within the wider galaxy population. A particular open question concerns the size of the MW’s disc component, which has repeatedly been argued to be comparatively low (e.g. Bland-Hawthorn & Gerhard, 2016; Licquia et al., 2016). The MW disc appears to be more compact than the majority of galaxies of MW-like mass (e.g. Bovy & Rix, 2013; Licquia & Newman, 2016, hereafter LN16) and appears to be deficient by around 1 with respect to the MW’s circular velocity (Hammer et al., 2007), whereas the scale length of M31 appears far more usual (Hammer et al., 2007). The MW displays properties in good consistency with other galaxies once its disc’s compactness is taken into account, meanwhile (Bovy & Rix, 2013; Boardman et al., 2020).
Milky Way Analogs (MWAs) provide an ideal opportunity to bridge the gap between Galactic and extragalactic observations. MWAs allow one to estimate global properties of the MW that cannot be easily or directly estimated for the MW, and have enabled tight estimates of the MW’s magnitude and color (Licquia et al., 2015). MWAs also allow comparison of the MW to its immediate peers (e.g. Fraser-McKelvie et al., 2019; Boardman et al., 2020; Krishnarao et al., 2020). Thus, MWAs are a powerful tool for better understanding the Milky Way in the extragalactic context.
However, there is no one definition for what makes a galaxy a MWA, and overly-strict definitions of “analog" can produce negligible or even flat-out nonexistent samples of MWA galaxies. Fraser-McKelvie et al. (2019), for instance, find just 176 MWAs from selecting on stelar mass, bulge-to-total ratio (B/T) and morphology. Boardman et al. (2020), meanwhile, find not a single MWA in the SDSS-IV (Blanton et al., 2017) MaNGA survey (Bundy et al., 2015) when attempting to select on a combination of stellar mass (), star-formation rate (SFR), B/T and disc scale length (). It is thus critical to assess the impacts of different selection criteria, in order to understand how to best select constraining samples of MWAs.
M31 Analogs, hereafter M31As, can provide us with additional insight. M31As allow us to assess Andromeda’s position amongst its peers in a similar manner to what MWAs enable for the MW. The MW and M31 are the two nearest massive disc galaxies to us, and can both be studied in much greater depth than other such galaxies; thus, it is crucial to understand how both the MW and M31 relate to the wider extragalactic population.
We experiment here with a number of complementary selection criteria, aimed at selecting various samples of “analogs" and then comparing their ranges of properties to our knowledge of the MW. We perform an equivalent analysis on M31A galaxies, selecting M31 analogs through multiple means and then comparing with M31.
2 Sample and Data
| Analog Sample | SFR ( yr-1) | B/T | (kpc) | Galaxy Zoo vote fraction |
|---|---|---|---|---|
| MW star-formation analogs | — | — | — | |
| MW bulge analogs | — | — | — | |
| MW scale analogs | — | — | — | |
| MW morphological analogs | — | — | — | spiral , bar , |
| smooth , edgeon |
In § 2.1 we discuss the acquisition of all parameters being considered in our selections as well as in our analysis. We discuss our MWA selections in § 2.2 and our M31A selections in § 2.3
2.1 Source catalogs
We obtain stellar masses, SFRs, B/T ratios, disc scale lengths, multi-band magnitudes, redshifts, and quantitative galaxy morphologies by cross-referencing a number of published catalogs. We consider in our subsequent analysis only galaxies that are present in all catalogs.
We obtain total stellar masses and current global star-formation rates from the GALEX-SDSS-WISE Legacy catalog (GSWLC; Salim et al., 2016), employing the GSWLC-2X catalog (Salim et al., 2018). GSWLC-2X contains stellar masses and SFRs for 659229 galaxies, selected by cross-referencing the spectroscopic SDSS Data Release 10 (DR10; Ahn et al., 2014) sample with the ultraviolet Galaxy Evolution Explorer (GALEX; Martin et al., 2005) sample. Masses and SFRs are derived through spectral energy distribution (SED) fits performed using the Code Investigating GALaxy Emission (CIGALE; Noll et al., 2009; Boquien et al., 2019), which uses WISE (Wright et al., 2010) IR luminosity as a constraint on UV-optical fits to combined GALEX-SDSS photometry. The GSWLC masses and SFRs assume a Chabrier (2003) initial mass function (IMF); we converted these to a Kroupa (2001) IMF by multiplying by a factor of 1.06 (Elbaz et al., 2007; Salim et al., 2007; Zahid et al., 2012).
We obtain light-weighted r-band B/T and values from the catalog of Simard et al. (2011), who perform bulge-disc decompositions of 1,123,718 galaxies from the SDSS Data Release 7 (DR7; Abazajian et al., 2009). Specifically, we employed the two-component bulge+disc fits from that paper in which the bulge Sérsic index was treated as a free parameter. Simard et al. (2011) perform their fits simultaneously to g-band and r-band SDSS galaxy photometry; structural parameters including and are fixed to be identical in both bands, whereas the amplitude of individual components (and hence B/T) are allowed to vary between bands. We also obtain from this catalog the (“probability of pure Sérsic") parameter for each galaxy. denotes the F-test probability of a bulge+disc model not being required to fit a given galaxy, as opposed to a pure Sérsic model, and parametrises the goodness-of-fit improvement achieved by fitting a bulge+disc component over a single Sérsic component.
We obtain redshifts and absolute magnitudes from version 1.0.1 of the NASA-Sloan Atlas111 http://www.nsatlas.com (NSA) catalog (Blanton et al., 2011), which re-reduces the data in SDSS Data Release 8 (DR8; Aihara et al., 2011). The NSA absolute magnitudes are drawn from a combination of GALEX and SDSS photometry, and are provided over seven bands (FNugriz) overall; we use the elliptical Petrosian set of values throughout our analysis. For redshifts, we use values obtained from the distance estimates of Willick et al. (1997)
Finally, we obtain measurements of galaxy morphologies from the Galaxy Zoo 2 catalog (GZ2; Willett et al., 2013), employing user-weighted vote fractions along with the redshift-debiased fractions described in Hart et al. (2016). We obtained information on the presence of bar and spiral features along with information concerning the galaxies’ inclinations. The Galaxy Zoo vote-based method allows quantitative measures of morphology as well as providing quantitative confidence levels in those morphologies, and has repeatedly been shown to be an excellent means of detecting spiral arms and bars (e.g. Hart et al., 2017; Kruk et al., 2018). The specific parameters we extracted from the catalog were “t01_smooth_or_features_a01_smooth_weighted_fraction", “t02_edgeon_a04_yes_weighted_fraction", “t03_bar_a06_bar_debiased", “t04_spiral_a08_spiral_debiased", “t03_bar_a06_bar_count" and “t04_spiral_a08_spiral_count"; for the remainder of this paper, we will refer to these parameters respectively as smooth, edgeon, bar, spiral, and . We will also refer to a parameter , describing the lower value out of and for a given galaxy.
We obtain a total of 149585 galaxies from this cross-referencing procedure. Following Simard et al. (2011), we discount all galaxies for which , as such galaxies are less likely to be true bulge+disc systems and so are more likely to yield spurious bulge-disc decompositions; this yields 82724 galaxies. We then remove all galaxies with elliptical Petrosian axis ratios (b/a) below 0.6, to avoid considering discy galaxies with edge-on viewing angles and so strong internal dust extinction (e.g. Licquia et al., 2015), leaving 62735 galaxies; we discuss this cut further in the following subsection. We further remove 1337 galaxies for which and , in order to eliminate galaxies with unreliable bulge+disc fits that were not eliminated by the previous cut. This produces a final parent sample of 61398 galaxies, from which we select MWA and M31A samples as described in the following subsections.
We employ volume-limited analog samples throughout our analysis. Essentially, we wish to ensure that we do not miss fainter MWAs/M31As due to the magnitude limits of employed galaxy catalogs, allowing unbiased comparisons with the MW and M31. We achieve this by restricting analog samples to a given maximum redshift, as described in the next two subsections for MWAs and M31As respectively.
2.2 Milky Way analog sample selections
We select a series of MWA samples based on our knowledge of the MW. Each sample is based on a different definition of “analog", as described in the remainder of this section and summarised in Table 1.
Our MWA selections are largely based on the MW parameter values reported in Licquia & Newman (2015) (hereafter LN15) and LN16. These two works combine a wide variety of literature measurements in order to obtain constraints on the MW’s , SFR, B/T and values. LN15 determine the MW SFR by performing a Heiarchical Bayesian analysis on a range of previous SFR measurements retrieved from Table 1 of Chomiuk & Povich (2011). LN16 similarly obtain a MW value by combining numerous individual measurements (e.g. Kent et al., 1991; Ruelas-Mayorga, 1991; Chen et al., 1999; Benjamin et al., 2005; Chang et al., 2011; Mao et al., 2015), with the value effectively being an estimate for the MW’s thin disc. and values are determined by combining stellar bulge and/or bar mass values from the literature (e.g. Kent, 1992; Dwek et al., 1995; Widrow et al., 2008) and then using these in conjuction with Monte Carlo simulations of an exponential disc model based on Bovy & Rix (2013). LN15 employ an value of for this process, from Bovy & Rix (2013), whereas LN16 employ their own estimate.
The galactic parameters we consider are likely to vary over a variety of different timescales. In particular, the SFR is expected to fluctuate relatively rapidly over a galaxy’s lifetime, whereas a galaxy’s mass and stucture will change far more gradually. In general, the key assumption behind MWA selections is that the MW should not be unusual amongst a sample of its chosen analogs (e.g. Licquia et al., 2015; Boardman et al., 2020), regardless of the specific parameters employed in selections. Thus, it is worthwhile to consider both long-lived and shorter-lived parameters when selecting MWA samples.
We select “star-formation MWAs" (hereafter “SF MWAs") based on stellar masses and star-formation rates. This is a natural MWA definition, as both parameters are known to be strongly correlated with galaxies’ global photometric properties (Licquia et al., 2015). We select galaxies with stellar masses between and , based on the 1- confidence intervals reported in LN15. We then further limit the sample to those galaxies with SFR values between 1.46 and 1.84 , based on the 1- interval found in LN16.
We select “bulge MWAs" by cutting on stellar masses and bulge-to-total ratios. This is another natural choice for performing MWA selections, due to the known connection between the growth of a galaxy’s bulge with a galaxy’s particular evolution history (e.g. Cappellari, 2016; Belfiore et al., 2017; Saha & Cortesi, 2018). We perform the same mass cut as before, and we select galaxies with B/T values between 0.13 and 0.19 based on the LN16 1- intervals.
Measured bulge MWA properties are relatively sensitive to viewing angle, given the status of bulge MWAs as disc dominated systems. In Figure 2, we the SFR and values of bulge MWAs in bins of b/a, in the case where no b/a cut is applied to the parent sample. We find a small but non-negligible drop in SFR at b/a along with a significant increase in at b/a values below 0.4. Thus, a b/a cut is necessary to avoid biases in the properties of sample galaxies.

We select “scale MWAs" based on stellar mass and on exponential disc scale length. The MW scale length has repeatedly been suggested to be atypically short for the MW’s stellar mass; thus, scale length is potentially important for understanding the MW’s place in the wider extragalactic context (Boardman et al., 2020). We use the same mass cut as before, and we further cut the sample to include only galaxies with values between 2.51 kpc and 2.93 kpc; this is based on the 1- intervals reported in LN16 from optical data only, as opposed to the intervals from IR or optical+IR data.
Licquia et al. (2016) discuss at length the applicability of the MW scale length for comparing with external galaxy measurements in their Section 5.2.1; we provide a brief summary here, and direct the interested reader to that paper for a more complete discussion. MW disc scale length calculations are typically carried out via star-count analyses, which differs significantly from the photometric methods employed for other galaxies. On the other hand, the ratio between the MW’s IR and visible scale lengths appears similar to that measured for external galaxies, and MW dynamical scale length measurements are consistent with measurements made through other means (LN16); thus, the MW scale lengths reported in the literature appear robust for our purposes.
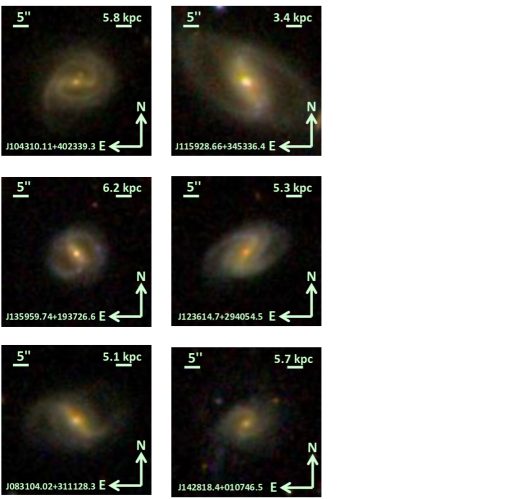
Lastly, we select a sample of “morphological MWAs", defined as those galaxies with masses in the 1 MW range that also possess bar and spiral features. The presence of a bar in particular is likely important in understanding a given galaxy’s properties (e.g. Krishnarao et al., 2020), making it worthwhile to explore barred spiral analogs separately from the previously-defined samples. We largely follow Table 3 of Willett et al. (2013) in performing this selection: we restrict to galaxies satisfying smooth , edgeon , and . For conservative sample selections, Willett et al. (2013) further suggest using minimum vote thresholds of for selecting on morphological features, and we employ those thresholds on the bar and spiral vote fractions. We show some examples morphological MWAs in Figure 1.
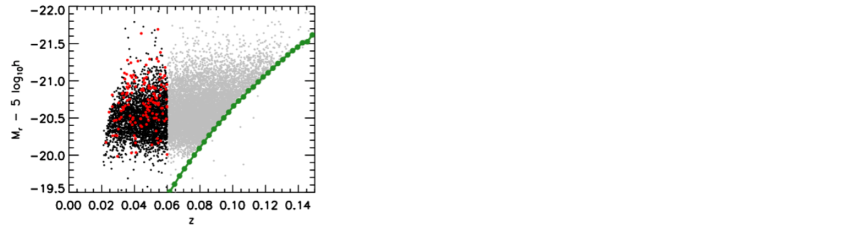
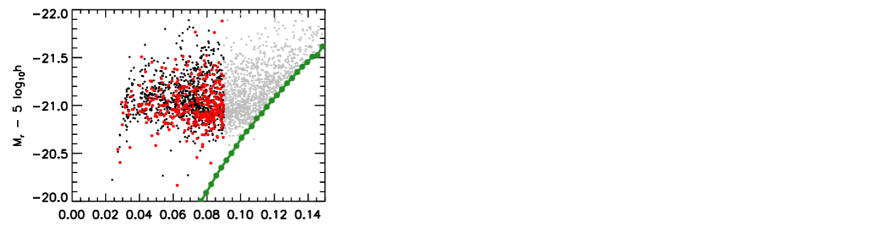
We restrict all four MWA samples to galaxies of redshifts , in order to ensure that the samples are volume-limited. In Figure 3, we show the magnitudes and redshifts of the bulge MWA sample along with all galaxies that satisfy the MW mass cut. By limiting to , we obtain volume-limited samples as desired; the same situation occurs for the other three MWA samples.
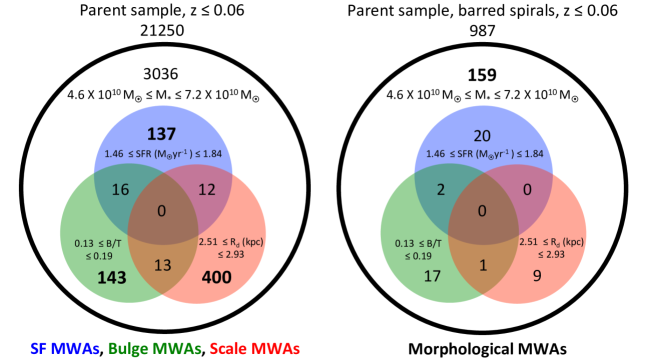
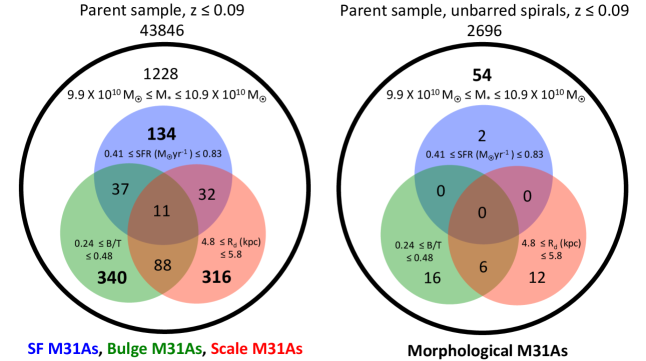
In Figure 4, we show the size of the selected MWA samples in the form of a Venn diagram, along with the numbers of galaxies satisfying different combinations of parameter cuts. We find that the number of identified MWAs becomes vanishingly small as the number of criteria is increased, with not one MWA satisfying all of the cuts. This problem of dimensionality was previously highlighted in Fraser-McKelvie et al. (2019), and demonstrates the need to employ just a few selection criteria when large MWA samples are required.
Many additional possible "analog" definitions exist beyond the ones we consider here. The nearby NGC 891, for instance, is often considered an MWA on the basis of morphology and rotational velocity (e.g. Mouhcine et al., 2010; Hughes et al., 2014). Kormendy & Bender (2019) argue NGC 4565 and NGC 5746 to be analogs on the basis of their morphology, and in particular on the presence of boxy pseudobulges. A search for boxy bulge structures is possible with SDSS imaging (yoshino2015) but would require edge-on samples, and so conflicts with the requirements of the other analog samples in this work. An analog sample based on rotational velocities is more feasible but of questionable additional value, particularly in light of the stellar mass Tully-Fisher relation (TFR; Tully & Fisher, 1977; Mocz et al., 2012; Licquia et al., 2016). It should also be noted that in Licquia et al. (2016), the quoted uncertainty in the MW rotational velocity is larger than the uncertainty in the stellar mass, relative to the scatter in the stellar mass TFR itself.
2.3 M31 analog sample selections
As with the MW, a range of calculations of key M31 properties have been performed over the years. M31 is known to be more massive than the MW, and has consistently been measured to possess a significantly larger disc scale length (e.g. Hammer et al., 2007). In addition, M31 is generally agreed to possess a lower current star-formation rate than the MW (e.g. Yin et al., 2009, and references therein). Our M31 sample selections are designed to capture this behaviour, while allowing for the spread in reported M31 measurements. We summarise our M31A selections in Table 2, and we explain our selections over the remainder of this subsection.
| Analog Sample | SFR ( yr-1) | B/T | (kpc) | Galaxy Zoo vote fraction |
|---|---|---|---|---|
| M31 star-formation analogs | — | — | — | |
| M31 bulge analogs | — | — | — | |
| M31 scale analogs | — | — | — | |
| M31 morphological analogs | — | — | — | spiral , bar , |
| smooth , edgeon |
Firstly, we restrict all M31A selections to galaxies with masses between and . We obtained this range from Mutch et al. (2011), who computed it from from the semi-analytic mass modelling of Geehan et al. (2006) and other compiled literature values (e.g. Barmby et al., 2006; Hammer et al., 2007).
We select a sample of “star-forming M31As" (hereafter “SF M31As") using the M31 SFRs calculated over 10 Myr by Kang et al. (2009) , as presented in their Table 3 based on combined UV and IR photometry. Taking for boundaries the values calculated with stellar model grids with subsolar () and supersolar () metallicities respectively, we obtain an SFR range of 0.41-0.83 . This is broadly consistent with the range of values reported in past literature (see for instance Table 1 of Yin et al., 2009). Where necessary, we assume a midpoint M31 SFR of 0.46 , calculated with solar-metallicity () model grids.
We select “bulge M31As" by considering all results contained within Table 5 of Tamm et al. (2012), along with the results of Barmby et al. (2006) and Courteau et al. (2011). We take the mean and standard deviation of the resulting B/T values, obtaining a value of ; we use this value to define our M31 structural analog sample, employing a cut of
We select a sample of “scale M31As" using the kpc M31 disc scale length reported by Courteau et al. (2011) from infra-red Spitzer/IRAC imaging. This is slightly lower than the majority of photometric measurements, as can be seen in Hammer et al. (2007) and Yin et al. (2009) along with references therein; Hammer et al. (2007) use a value of kpc to represent the range of reported photometric values, for instance. However, the Courteau et al. (2011) value is more analogous to the (effectively mass-weighted) value we employ for the MW and less sensitive to dust extinction effects than measurements made in bluer bands. In addition, the choice between the M31 values of Courteau et al. (2011) and Hammer et al. (2007) matters little in practice, as they are both consistent with M31 having a scale length that is reasonably standard for a galaxy of its mass (e.g. Fathi et al., 2010; Wu, 2018).
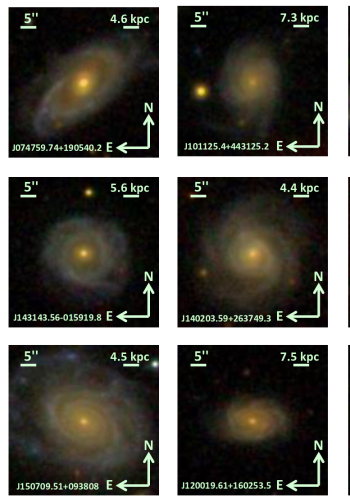
Finally, we select a sample of “morphological M31As" based on Galaxy Zoo 2 vote fractions. M31 is known to contain a stellar bar (e.g. Beaton et al., 2007), but visually appears as an unbarred spiral galaxy (e.g. Sandage & Tammann, 1981); thus, we select for the presence of spiral features along with the apparent absence of bar features. As for the MWAs, we restrict to galaxies satisfying smooth , edgeon . We then use selection thresholds of spiral and bar, along with requiring ; we impose no requirement on in this case, as low bar values typically correspond to low numbers. We present some example morphological M31As in Figure 5.
We restrict all M31A samples to galaxies with redshifts to ensure volume-limiting; we are able to use a higher maximum redshift in this case due to the brighter magnitudes displayed by the M31As. We present the ranges of redshifts and magnitudes of the bulge M31A samples in Figure 6, wherein we show that our adopted redshift cut leads to a volume-limited sample as desired; the same situation is seen in all M31A samples. We present Venn diagrams detailing the M31A sample sizes in Figure 7.
3 Results
3.1 MWA results
In the left panel of Figure 8, we show the B/T and distributions of the SF MWAs as a 2D histogram, along with the MW value and contours of properties for all galaxies that satisfy the MW mass cut. We find the MW to lie within 1 of the B/T values calculated for SF analogs, though we note that the range of B/T values amongst SF MWAs is wide. The MW is somewhat of an outlier in terms of scale length, but remains within the 2 region.
We plot the SFR and values of the bulge MWAs in the middle panel of Figure 8, in which we find the adopted MW SFR to lie well within of the bulge MWAs. We find the MW disc scale length to again be low compared to the majority of bulge MWAs, though still within 2 of this sample.
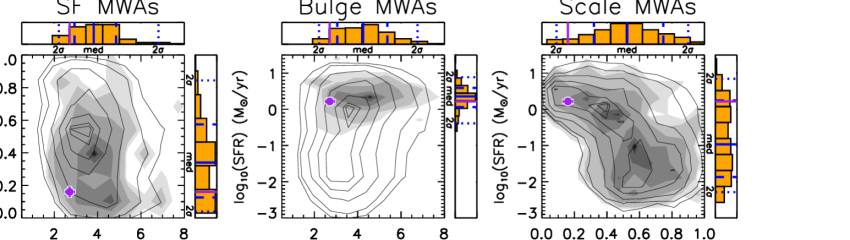
The right panel of Figure 8 presents the properties of the scale MWAs in terms of SFR and B/T, following the same format as the preceding two panels. We see the expected star-forming/quiescent galaxy dichotomy in the mass-selected sample, with a discy star-forming component along with a quiescent and more bulgey component; we find this dichotomy to be maintained amongst the scale analogs, albeit weighted more heavily towards the quiescent component. We also find amongst the discy scale analogs, the MW does not appear to be unusual, with both an SFR and B/T in good consistency with the behaviour of the discy scale analogs.
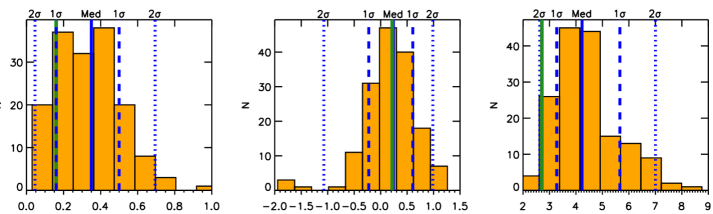
We present in Figure 9 1D histograms of properties of the morphological MWAs in terms of SFR, B/T and in turn. We caution though that the B/T and values are specifically calculated from two-component photometric fits, which will not fully capture the photometry of barred galaxies and can significantly overestimate barred galaxies’ bulge-to-total ratios (Laurikainen et al., 2005, 2006; Kruk et al., 2018); thus, we include B/T and values purely for completeness in this case. In terms of SFR, we find the MW to well within of the morphological MWA sample.
Overall, the SF, bulge and morphological MWAs are broadly consistent in their range of properties, with all three favouring the selection of disc-dominated star-forming galaxies. It is apparent that MWA samples do not accurately predict the MW’s short scale length unless the scale length is specifically selected on, and it is also apparent that the scale MWA sample is not particularly constraining in itself. At the same time, the MW appears to not be the least bit unusual amongst the star-forming galaxies within the scale MWA sample. From these findings, we argue that scale length should be considered in addition to other parameters in order to select the most stringent MWA galaxies.
3.2 M31A results
We plot the SF M31A sample in terms of B/T and in the left panel of Figure 10, with our adopted M31 values shown on the same figure along with contours of all galaxies satisfying our M31 mass cut. We find M31’s scale length to be in excellent agreement with the SF M31As. However, we find the SF M31As to over-predict the B/T to an extent, with M31’s B/T offset low by approximately .
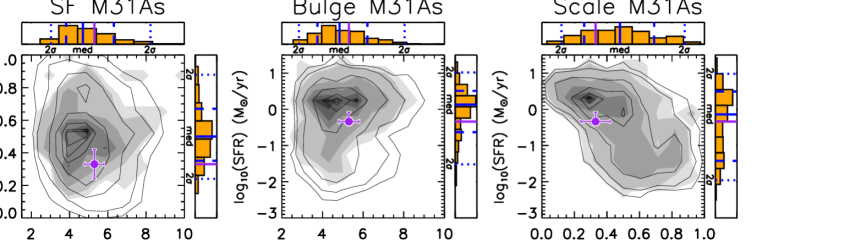
We present in the middle panel of Figure 10 the bulge M31A sample in terms of SFR and . We find the M31 SFR to be slightly low amongst the bulge M31As, though still well within 1 of this sample’s range. We also find the scale lengths of the bulge M31As to agree excellently with that of M31.=
We present the SFR and B/T distributions of the scale M31A sample in the right panel of Figure 10. We find M31 to within in terms of both properties when the properties are considered individually, but it is clear that M31’s SFR is somewhat lower than is typical for scale M31As in M31’s likely B/T range.
Lastly, we present the properties of the morphological M31As in Figure 11. We find our adopted central M31 SFR to be offset low by more than 2 in this case, while finding M31’s B/T and to both not be the least bit unusual amongst the morphological M31As.
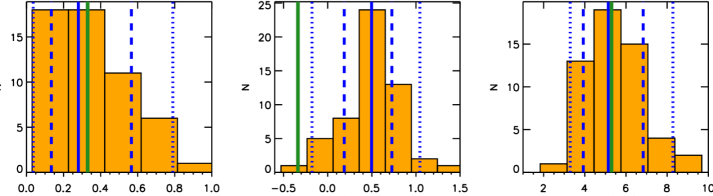
To summarise, we find the scale length of M31 to agree excellently with those of the M31A samples, but we find the SFR of M31 to be somewhat low. Although M31’s SFR is in reasonable consistency with the bulge and scale M31A samples, it is significantly offset from the morphological M31As. In addition, M31’s low SFR leads the SF M31A sample to over-predict M31’s B/T by around . From this, we advocate including mass and B/T in selection criteria for targeting the closest M31As, with M31’s low SFR also important to keep in mind.
4 Discussion and conclusion
In this paper, we have explored the properties of various galaxy samples selected as “Milky Way Analogs" or “Andromeda Analogs" using various selection criteria. We compared the properties of both the MW and M31 to their respective analogs, with the aim of understanding how to best select constraining “analog" samples.
Critically, the MWA samples do not accurately predict the short disc scale length of the MW unless the scale length is included in the selection criteria. Although a few reported MW values are highly consistent with our non-scale MWA samples (e.g. Yamagata & Yoshii, 1992; Benjamin et al., 2005; Chang et al., 2011; Grady et al., 2020), the vast majority of measurements are less so (e.g. Kent et al., 1991; Ruelas-Mayorga, 1991; Chen et al., 1999; Bovy & Rix, 2013; Mao et al., 2015; Li et al., 2018b). The scale length of the MW disc is therefore important to consider if one wishes to select the most similar MWA galaxies.
It should be noted that the MW’s scale length is not unduly unusual amongst those of the MW’s direct peers, with the MW scale length remaining within 2 of the SF and bulge MWAs. In turn, the MW appears not the least bit unusual amongst star-forming scale MWAs, with the MW’s SFR and B/T values both well within the scale MWA sample’s range. Thus, while the MW is indeed an outlier in terms of , it is not an outlier to the extent of requiring a unique explanation.
Aside from the MW’s short scale length, the MW is likewise not unusual amongst the other MWA samples considered. In terms of B/T, the MW falls within the 1 range displayed by the SF MWAs; likewise, the SFR of the MW falls well within 1 of the SFR range of the bulge MWAs. We also find the MW SFR to be well within of the morphological MWAs. Overall, we find the MW to be a relatively typical galaxy aside from its short disc scale length, consistent with previous work (e.g. Hammer et al., 2007; Bovy & Rix, 2013; Licquia et al., 2016).
In contrast to the MW, we find M31’s SFR to be over-predicted to various extents in all non-SF M31A samples. In turn, the SF M31As over-predict M31’s B/T. Thus, we argue that the combination of a low SFR and relatively low B/T are important in selecting the closest M31A galaxies. Our results here are in good consistency with the work of Mutch et al. (2011), who argue M31’s properties to be consistent with galaxies on the green valley region of the color-magnitude diagram. Compared to the MW, we also find M31’s disc scale length to be in much greater consistency with its respective analog samples, which is likewise consistent with previous work (e.g. Hammer et al., 2007).
Similar results can be expected if one parametrises galaxy mass with instead of stellar mass, due to the existence of the stellar mass TFR. We confirmed this by cross-matching our parent sample with the ALFALFA extragalactic H i source catalog (Haynes et al., 2018), converting velocity widths to using inclinations obtained from Simard et al. (2011). We adopted MW and M31 values of 220 22 km s-1 (Kerr & Lynden-Bell, 1986) and 226 29 km s-1 (Carignan et al., 2006), respectively, where we have adopted 10% errors for the MW in line with previous work (e.g. Licquia et al., 2016); this leads to 1 windows of 198-242 km s-1 and 197-255 km s-1 for the MW and M31 in turn. Due to the resulting overlap in the MW and M31 values, we selected a single analog sample to cover values between 197 and 255 km s-1; we restricted this selection to galaxies with inclinations no lower than and with velocity width errors no greater than 15 km s-1. The resulting sample was found to be essentially complete, so we made no explicit redshift cut. We found the MW scale length to be offset low by over in this case, with our adopted central M31 SFR also low by roughly ; both galaxies are otherwise in good consistency with this analog sample. Our results from this sample are therefore similar to what we find with the other MWA and M31A samples. However, the use of H i data strongly biases the cross-matched parent sample towards disc-dominated star-forming galaxies, and we prefer our other analog selections for this reason.
The difference in MWA and M31A results - particularly in terms of scale lengths - likely relate to the respective evolution histories of the MW and M31. Mackereth et al. (2018) report that bimodal alpha abundance ratios only appear in EAGLE galaxies when those galaxies have had a particularly violent early merging history, though other simulation works (e.g. Grand et al., 2018; Buck, 2020) provide counterpoints. That the MW experienced an early merging history is supported by the age-metallicity distribution of MW globular clusters (Kruijssen et al., 2019) and by substructures apparent in Gaia data (Helmi et al., 2018; Belokurov et al., 2018; Elias et al., 2020), and the apparent short scale length of the MW can also be understood on this basis (Mo et al., 1998). M31 likely had a more extended merging history, meanwhile, that is more typical of spiral galaxies (Hammer et al., 2007). Such a notion is consistent with the apparent burst in star-formation that occurred in M31 roughly 2-4 Gyr ago (Williams et al., 2015). This, along with the comparatively large amount of disc heating evident in M31 (Hammer et al., 2018) and the multiple substructures around M31 with similar stellar populations (Bernard et al., 2015), supports the idea of major merger occurring at around that time, with M32 being a possible remnant of the merging galaxy (D’Souza & Bell, 2018).
Looking to larger galaxy samples, it has been reported that smaller galaxies display stellar populations that are on average older and more metal-rich at a given galaxy mass (e.g. Scott et al., 2017; Li et al., 2018a). This is likewise consistent with the scenario of the MW having an atypical formation history amongst spiral galaxies, and further highlights the importance of considering disc scale length when setting out to select the most similar MWAs.
Given the apparent importance of scale length in understanding the MW, we further argue that scale length should be specifically considered when attempting to reproduce the MW in models and simulations, along with properties such as B/T and SFR. Simulation studies often focus on galaxies of MW-like mass (halo, stellar or total), with environment also frequently taken into account (e.g. Scannapieco et al., 2015; Nuza et al., 2019; Carlesi et al., 2020; Santistevan et al., 2020). Additional selections can be imposed to ensure disc-domination in simulated galaxies identified as being MW-like, as for instance done in Mackereth et al. (2018), but such selections can still be expected to yield galaxies that are much more extended than the MW on average. By considering in simulations galaxies that match the MW in terms of a wider range of properties - in particular, by considering galaxies that are star-forming and disc-dominated while also possessing compact discs - the opportunity exists to further understand how our own galaxy came to be.
To summarise, we find the MW’s properties to mostly be in good consistency with its analogs, irrespective of the particular selection strategy employed. We do however find the MW disc to be atypically compact compared to the MWA samples, meaning that MWA samples do not accurately predict the MW’s disc scale length unless the scale length is included in the selection criteria. We therefore argue that scale length should be considered in addition to other parameters when selecting the most stringent MWAs. We find M31’s scale length to be in excellent agreement with its analogs, though its SFR is evidently lower than the majority of its structural peers. Thus, we advocate selecting on a combination of mass, SFR and bulge fraction to choose the closest M31As.
Data Availability
The data underlying this article are available in its online supplementary material. We include as online supplementary material two tables detailing all MWAs and M31As, with no redshift cut applied. We show the first five rows of each of these tables in Table 3 and Table 4.
| Objid (SDSS DR8) | RA | DEC | z | B/T | (kpc) | spiral | bar | Flag | ||
|---|---|---|---|---|---|---|---|---|---|---|
| (deg) | (deg) | |||||||||
| 1237663917872054658 | 111.586 | 43.533 | 0.057 | 10.75 | -2.21 | 0.40 | 2.75 | 0.00 | 0.00 | 0 |
| 1237663547431518682 | 111.638 | 37.914 | 0.082 | 10.79 | -1.48 | 0.49 | 2.88 | 1.00 | 0.98 | 0 |
| 1237663916797723168 | 111.981 | 41.959 | 0.058 | 10.81 | 0.18 | 0.41 | 4.36 | 0.61 | 0.93 | 0 |
| 1237663917335052608 | 112.048 | 42.981 | 0.066 | 10.76 | 0.41 | 0.81 | 4.02 | 0.97 | 1.00 | 1 |
| 1237663547432108541 | 112.500 | 39.100 | 0.089 | 10.84 | 0.23 | 0.17 | 6.05 | 0.09 | 0.98 | 0 |
| Objid (SDSS DR8) | RA | DEC | z | B/T | (kpc) | spiral | bar | Flag | ||
|---|---|---|---|---|---|---|---|---|---|---|
| (deg) | (deg) | |||||||||
| 1237663917872185769 | 111.824 | 43.785 | 0.057 | 11.00 | 0.40 | 0.45 | 5.28 | 0.17 | 0.65 | 0 |
| 1237663916797985250 | 112.351 | 42.429 | 0.133 | 11.02 | 1.11 | 0.18 | 5.75 | 0.72 | 1.00 | 0 |
| 1237663530252238968 | 112.639 | 39.049 | 0.088 | 11.01 | 0.39 | 0.27 | 5.77 | 0.89 | 1.00 | 0 |
| 1237663787414782244 | 114.002 | 44.470 | 0.079 | 11.01 | -0.88 | 0.62 | 5.77 | 0.00 | 1.00 | 0 |
| 1237657594607501971 | 114.303 | 27.235 | 0.093 | 11.01 | 0.27 | 0.42 | 5.49 | 0.00 | 0.97 | 0 |
Acknowledgements
We thank the anonymous referee for their comments, which served to greatly improve the clarity of this paper. We thank Cristina Chiappini for her useful and insightful comments on this manuscript.
The support and resources from the Center for High Performance Computing at the University of Utah are gratefully acknowledged.
References
- Abazajian et al. (2009) Abazajian K. N., et al., 2009, ApJS, 182, 543
- Ahn et al. (2014) Ahn C. P., et al., 2014, ApJS, 211, 17
- Aihara et al. (2011) Aihara H., et al., 2011, ApJS, 193, 29
- Anders et al. (2014) Anders F., et al., 2014, A&A, 564, A115
- Baldry et al. (2004) Baldry I. K., Glazebrook K., Brinkmann J., Ivezić Ž., Lupton R. H., Nichol R. C., Szalay A. S., 2004, ApJ, 600, 681
- Barbuy et al. (2018) Barbuy B., Chiappini C., Gerhard O., 2018, ARA&A, 56, 223
- Barmby et al. (2006) Barmby P., et al., 2006, ApJ, 650, L45
- Beaton et al. (2007) Beaton R. L., et al., 2007, ApJ, 658, L91
- Belfiore et al. (2017) Belfiore F., et al., 2017, MNRAS, 466, 2570
- Bell et al. (2004) Bell E. F., et al., 2004, ApJ, 608, 752
- Belokurov et al. (2018) Belokurov V., Erkal D., Evans N. W., Koposov S. E., Deason A. J., 2018, MNRAS, 478, 611
- Benjamin et al. (2005) Benjamin R. A., et al., 2005, ApJ, 630, L149
- Bensby et al. (2003) Bensby T., Feltzing S., Lundström I., 2003, A&A, 410, 527
- Bernard et al. (2015) Bernard E. J., et al., 2015, MNRAS, 446, 2789
- Bland-Hawthorn & Gerhard (2016) Bland-Hawthorn J., Gerhard O., 2016, ARA&A, 54, 529
- Blanton et al. (2011) Blanton M. R., Kazin E., Muna D., Weaver B. A., Price-Whelan A., 2011, AJ, 142, 31
- Blanton et al. (2017) Blanton M. R., et al., 2017, AJ, 154, 28
- Boardman et al. (2020) Boardman N., et al., 2020, MNRAS, 491, 3672
- Boquien et al. (2019) Boquien M., Burgarella D., Roehlly Y., Buat V., Ciesla L., Corre D., Inoue A. K., Salas H., 2019, A&A, 622, A103
- Bovy & Rix (2013) Bovy J., Rix H.-W., 2013, ApJ, 779, 115
- Bovy et al. (2012) Bovy J., Rix H.-W., Hogg D. W., 2012, ApJ, 751, 131
- Buck (2020) Buck T., 2020, MNRAS, 491, 5435
- Buder et al. (2019) Buder S., et al., 2019, A&A, 624, A19
- Bundy et al. (2015) Bundy K., et al., 2015, ApJ, 798, 7
- Cappellari (2016) Cappellari M., 2016, Annual Review of Astronomy and Astrophysics, 54, 597
- Carignan et al. (2006) Carignan C., Chemin L., Huchtmeier W. K., Lockman F. J., 2006, ApJ, 641, L109
- Carlesi et al. (2020) Carlesi E., Hoffman Y., Gottlöber S., Libeskind N. I., Knebe A., Yepes G., Pilipenko S. V., 2020, MNRAS, 491, 1531
- Chabrier (2003) Chabrier G., 2003, PASP, 115, 763
- Chang et al. (2011) Chang C.-K., Ko C.-M., Peng T.-H., 2011, ApJ, 740, 34
- Chen et al. (1999) Chen B., Figueras F., Torra J., Jordi C., Luri X., Galadí-Enríquez D., 1999, A&A, 352, 459
- Chiappini et al. (1997) Chiappini C., Matteucci F., Gratton R., 1997, ApJ, 477, 765
- Chomiuk & Povich (2011) Chomiuk L., Povich M. S., 2011, AJ, 142, 197
- Courteau et al. (2011) Courteau S., Widrow L. M., McDonald M., Guhathakurta P., Gilbert K. M., Zhu Y., Beaton R. L., Majewski S. R., 2011, ApJ, 739, 20
- Cui et al. (2012) Cui X.-Q., et al., 2012, Research in Astronomy and Astrophysics, 12, 1197
- D’Souza & Bell (2018) D’Souza R., Bell E. F., 2018, Nature Astronomy, 2, 737
- De Silva et al. (2015) De Silva G. M., et al., 2015, MNRAS, 449, 2604
- Dékány et al. (2013) Dékány I., Minniti D., Catelan M., Zoccali M., Saito R. K., Hempel M., Gonzalez O. A., 2013, ApJ, 776, L19
- Deng et al. (2012) Deng L.-C., et al., 2012, Research in Astronomy and Astrophysics, 12, 735
- Dwek et al. (1995) Dwek E., et al., 1995, ApJ, 445, 716
- Elbaz et al. (2007) Elbaz D., et al., 2007, A&A, 468, 33
- Elias et al. (2020) Elias L. M., Sales L. V., Helmi A., Hernquist L., 2020, MNRAS,
- Faber et al. (2007) Faber S. M., et al., 2007, ApJ, 665, 265
- Fathi et al. (2010) Fathi K., Allen M., Boch T., Hatziminaoglou E., Peletier R. F., 2010, MNRAS, 406, 1595
- Fraser-McKelvie et al. (2019) Fraser-McKelvie A., Merrifield M., Aragón-Salamanca A., 2019, arXiv e-prints, p. arXiv:1909.01654
- Fuhrmann (1998) Fuhrmann K., 1998, A&A, 338, 161
- Fuhrmann (2011) Fuhrmann K., 2011, MNRAS, 414, 2893
- Geehan et al. (2006) Geehan J. J., Fardal M. A., Babul A., Guhathakurta P., 2006, MNRAS, 366, 996
- Gilmore & Reid (1983) Gilmore G., Reid N., 1983, MNRAS, 202, 1025
- Gilmore et al. (2012) Gilmore G., et al., 2012, The Messenger, 147, 25
- Grady et al. (2020) Grady J., Belokurov V., Evans N. W., 2020, MNRAS, 492, 3128
- Grand et al. (2018) Grand R. J. J., et al., 2018, MNRAS, 474, 3629
- Hammer et al. (2007) Hammer F., Puech M., Chemin L., Flores H., Lehnert M. D., 2007, ApJ, 662, 322
- Hammer et al. (2018) Hammer F., Yang Y. B., Wang J. L., Ibata R., Flores H., Puech M., 2018, MNRAS, 475, 2754
- Hammersley et al. (1994) Hammersley P. L., Garzon F., Mahoney T., Calbet X., 1994, MNRAS, 269, 753
- Hart et al. (2016) Hart R. E., et al., 2016, MNRAS, 461, 3663
- Hart et al. (2017) Hart R. E., Bamford S. P., Casteels K. R. V., Kruk S. J., Lintott C. J., Masters K. L., 2017, MNRAS, 468, 1850
- Hayden et al. (2015) Hayden M. R., et al., 2015, ApJ, 808, 132
- Haynes et al. (2018) Haynes M. P., et al., 2018, ApJ, 861, 49
- Haywood et al. (2013) Haywood M., Di Matteo P., Lehnert M. D., Katz D., Gómez A., 2013, A&A, 560, A109
- Helmi et al. (2018) Helmi A., Babusiaux C., Koppelman H. H., Massari D., Veljanoski J., Brown A. G. A., 2018, Nature, 563, 85
- Hughes et al. (2014) Hughes T. M., et al., 2014, A&A, 565, A4
- Kang et al. (2009) Kang Y., Bianchi L., Rey S.-C., 2009, ApJ, 703, 614
- Kent (1992) Kent S. M., 1992, ApJ, 387, 181
- Kent et al. (1991) Kent S. M., Dame T. M., Fazio G., 1991, ApJ, 378, 131
- Kerr & Lynden-Bell (1986) Kerr F. J., Lynden-Bell D., 1986, MNRAS, 221, 1023
- Kormendy & Bender (2019) Kormendy J., Bender R., 2019, ApJ, 872, 106
- Krishnarao et al. (2020) Krishnarao D., et al., 2020, arXiv e-prints, p. arXiv:2007.01874
- Kroupa (2001) Kroupa P., 2001, MNRAS, 322, 231
- Kruijssen et al. (2019) Kruijssen J. M. D., Pfeffer J. L., Reina-Campos M., Crain R. A., Bastian N., 2019, MNRAS, 486, 3180
- Kruk et al. (2018) Kruk S. J., et al., 2018, MNRAS, 473, 4731
- Laurikainen et al. (2005) Laurikainen E., Salo H., Buta R., 2005, MNRAS, 362, 1319
- Laurikainen et al. (2006) Laurikainen E., Salo H., Buta R., Knapen J., Speltincx T., Block D., 2006, AJ, 132, 2634
- Li et al. (2018a) Li H., et al., 2018a, MNRAS, 476, 1765
- Li et al. (2018b) Li C., Zhao G., Zhai M., Jia Y., 2018b, ApJ, 860, 53
- Licquia & Newman (2015) Licquia T. C., Newman J. A., 2015, ApJ, 806, 96
- Licquia & Newman (2016) Licquia T. C., Newman J. A., 2016, ApJ, 831, 71
- Licquia et al. (2015) Licquia T. C., Newman J. A., Brinchmann J., 2015, ApJ, 809, 96
- Licquia et al. (2016) Licquia T. C., Newman J. A., Bershady M. A., 2016, ApJ, 833, 220
- Mackereth et al. (2017) Mackereth J. T., et al., 2017, MNRAS, 471, 3057
- Mackereth et al. (2018) Mackereth J. T., Crain R. A., Schiavon R. P., Schaye J., Theuns T., Schaller M., 2018, MNRAS, 477, 5072
- Majewski et al. (2017) Majewski S. R., et al., 2017, AJ, 154, 94
- Mao et al. (2015) Mao Q., et al., 2015, arXiv e-prints, p. arXiv:1507.01593
- Martig et al. (2016) Martig M., Minchev I., Ness M., Fouesneau M., Rix H.-W., 2016, ApJ, 831, 139
- Martin et al. (2005) Martin D. C., et al., 2005, ApJ, 619, L1
- McWilliam & Zoccali (2010) McWilliam A., Zoccali M., 2010, ApJ, 724, 1491
- Mikolaitis et al. (2014) Mikolaitis Š., et al., 2014, A&A, 572, A33
- Minchev et al. (2015) Minchev I., Martig M., Streich D., Scannapieco C., de Jong R. S., Steinmetz M., 2015, ApJ, 804, L9
- Mo et al. (1998) Mo H. J., Mao S., White S. D. M., 1998, MNRAS, 295, 319
- Mocz et al. (2012) Mocz P., Green A., Malacari M., Glazebrook K., 2012, MNRAS, 425, 296
- Mouhcine et al. (2010) Mouhcine M., Ibata R., Rejkuba M., 2010, ApJ, 714, L12
- Mutch et al. (2011) Mutch S. J., Croton D. J., Poole G. B., 2011, ApJ, 736, 84
- Nidever et al. (2014) Nidever D. L., et al., 2014, ApJ, 796, 38
- Noll et al. (2009) Noll S., Burgarella D., Giovannoli E., Buat V., Marcillac D., Muñoz-Mateos J. C., 2009, A&A, 507, 1793
- Nuza et al. (2019) Nuza S. E., Scannapieco C., Chiappini C., Junqueira T. C., Minchev I., Martig M., 2019, MNRAS, 482, 3089
- Queiroz et al. (2019) Queiroz A. B. A., et al., 2019, arXiv e-prints, p. arXiv:1912.09778
- Recio-Blanco et al. (2014) Recio-Blanco A., et al., 2014, A&A, 567, A5
- Rojas-Arriagada et al. (2019) Rojas-Arriagada A., Zoccali M., Schultheis M., Recio-Blanco A., Zasowski G., Minniti D., Jönsson H., Cohen R. E., 2019, A&A, 626, A16
- Ruelas-Mayorga (1991) Ruelas-Mayorga R. A., 1991, Rev. Mex. Astron. Astrofis., 22, 27
- Saha & Cortesi (2018) Saha K., Cortesi A., 2018, ApJ, 862, L12
- Salim et al. (2007) Salim S., et al., 2007, ApJS, 173, 267
- Salim et al. (2016) Salim S., et al., 2016, ApJS, 227, 2
- Salim et al. (2018) Salim S., Boquien M., Lee J. C., 2018, ApJ, 859, 11
- Sandage & Tammann (1981) Sandage A., Tammann G. A., 1981, A Revised Shapley-Ames Catalog of Bright Galaxies
- Santistevan et al. (2020) Santistevan I. B., Wetzel A., El-Badry K., Bland-Hawthorn J., Boylan-Kolchin M., Bailin J., Faucher-Giguere C.-A., Benincasa S., 2020, arXiv e-prints, p. arXiv:2001.03178
- Scannapieco et al. (2015) Scannapieco C., Creasey P., Nuza S. E., Yepes G., Gottlöber S., Steinmetz M., 2015, A&A, 577, A3
- Schawinski et al. (2014) Schawinski K., et al., 2014, MNRAS, 440, 889
- Schlafly & Finkbeiner (2011) Schlafly E. F., Finkbeiner D. P., 2011, ApJ, 737, 103
- Schlegel et al. (1998) Schlegel D. J., Finkbeiner D. P., Davis M., 1998, ApJ, 500, 525
- Scott et al. (2017) Scott N., et al., 2017, MNRAS, 472, 2833
- Simard et al. (2011) Simard L., Mendel J. T., Patton D. R., Ellison S. L., McConnachie A. W., 2011, ApJS, 196, 11
- Smethurst et al. (2015) Smethurst R. J., et al., 2015, MNRAS, 450, 435
- Steinmetz et al. (2006) Steinmetz M., et al., 2006, AJ, 132, 1645
- Strateva et al. (2001) Strateva I., et al., 2001, AJ, 122, 1861
- Tamm et al. (2012) Tamm A., Tempel E., Tenjes P., Tihhonova O., Tuvikene T., 2012, A&A, 546, A4
- Tully & Fisher (1977) Tully R. B., Fisher J. R., 1977, A&A, 54, 661
- Wegg & Gerhard (2013) Wegg C., Gerhard O., 2013, MNRAS, 435, 1874
- Weiland et al. (1994) Weiland J. L., et al., 1994, ApJ, 425, L81
- Widrow et al. (2008) Widrow L. M., Pym B., Dubinski J., 2008, ApJ, 679, 1239
- Willett et al. (2013) Willett K. W., et al., 2013, MNRAS, 435, 2835
- Williams et al. (2015) Williams B. F., et al., 2015, ApJ, 806, 48
- Willick et al. (1997) Willick J. A., Courteau S., Faber S. M., Burstein D., Dekel A., Strauss M. A., 1997, ApJS, 109, 333
- Wright et al. (2010) Wright E. L., et al., 2010, AJ, 140, 1868
- Wu (2018) Wu P.-F., 2018, MNRAS, 473, 5468
- Wu et al. (2019) Wu Y., et al., 2019, MNRAS, 484, 5315
- Xiang et al. (2017) Xiang M., et al., 2017, ApJS, 232, 2
- Yamagata & Yoshii (1992) Yamagata T., Yoshii Y., 1992, AJ, 103, 117
- Yin et al. (2009) Yin J., Hou J. L., Prantzos N., Boissier S., Chang R. X., Shen S. Y., Zhang B., 2009, A&A, 505, 497
- York et al. (2000) York D. G., et al., 2000, AJ, 120, 1579
- Yoshii (1982) Yoshii Y., 1982, PASJ, 34, 365
- Zahid et al. (2012) Zahid H. J., Dima G. I., Kewley L. J., Erb D. K., Davé R., 2012, ApJ, 757, 54