Spectroscopic Detection of the Pre-White Dwarf Companion of Regulus
Abstract
Mass transfer in an interacting binary will often strip the mass donor of its entire envelope and spin up the mass gainer to near critical rotation. The nearby B-type star Regulus represents a binary in the post-mass transfer stage: it is a rapid rotator with a very faint companion in a 40 d orbit. Here we present the results of a search for the spectral features of the stripped-down star in an extensive set of high S/N and high resolution spectra obtained with the CFHT/ESPaDOnS and TBL/NARVAL spectrographs. We first determine revised orbital elements in order to set accurate estimates of the orbital Doppler shifts at the times of observation. We then calculate cross-correlation functions of the observed and model spectra, and we search for evidence of the companion signal in the residuals after removal of the strong primary component. We detect a weak peak in the co-added residuals that has the properties expected for a faint pre-white dwarf. We use the dependence of the peak height and width on assumed secondary velocity semiamplitude to derive the semiamplitude, which yields masses of and (assuming orbital inclination equals the spin inclination of Regulus). We estimate the pre-white dwarf temperature kK through tests with differing temperature model spectra, and we find the radius from the component temperatures and the flux ratio associated with the amplitude of the signal in the cross-correlation residuals.
1 Introduction
Stars born with close by neighbors are destined to interact in ways that will dramatically change their future paths (De Marco & Izzard, 2017). The more massive component will be the first to grow to dimensions comparable to the separation, and subsequent Roche lobe overflow will lead to the transfer of mass and angular momentum to the mass gainer star. This process often leads to orbital shrinkage until the mass ratio is reversed, at which point continuing mass transfer causes the orbit to re-expand (if the stars avoid a common envelope stage or a merger). The result will be a system composed of a rapidly rotating, main sequence star and a stripped-down, stellar core (Willems & Kolb, 2004). Detailed evolutionary sequences with the MESA code show that the remnants of massive systems may produce stripped cores massive enough to create H-free supernovae (Götberg et al., 2018) or very low mass, white dwarf progenitors for intermediate mass binaries (Chen et al., 2017). This post-mass transfer stage can be relatively long-lasting, so many such systems should exist, but they are hard to detect because the faint stripped core is lost in the glare of the main sequence star.
Detailed observational work is now beginning to uncover this hidden population of post-mass transfer binaries. Pols et al. (1991) suggested that the rapidly rotating, B-emission line stars (i.e., classical Be stars) were spun up through mass transfer, and investigations of their ultraviolet spectra have revealed the spectral signatures of hot, stripped companions in a growing number of cases (Wang et al., 2018). High precision photometric surveys from ground- and space-based observations have detected the eclipses of hot cores by intermediate mass stars that form the EL CVn class of binaries (Maxted et al., 2014; Rappaport et al., 2015; van Roestel et al., 2018; Wang et al., 2020). The main sequence components are boosted in mass and luminosity through mass transfer, and they may appear as “blue straggler” stars lying above the turn-off point in the color-magnitude diagrams of clusters. Gosnell et al. (2019) found that the hot cores of the mass donors can often be detected through ultraviolet spectroscopy of cluster blue stragglers because the white dwarf flux dominates over that of the cooler companion at short wavelength.
Stars with very rapid rotation are good candidates for components spun up by prior mass transfer in a binary. One of the brightest of the rapid rotators is the star Regulus ( Leo; HD 87901; HR 3982; HIP 49699), which is a nearby ( pc; van Leeuwen 2007), intermediate mass star with a spectral classification B8 IVn (Gray et al., 2003). Images of Regulus from interferometry with the CHARA Array show that it has a rotationally distorted figure that we view towards its equator (McAlister et al., 2005; Che et al., 2011). Gies et al. (2008) presented a large number of radial velocity measurements from archival spectra of Regulus, and they found that the star is the brighter member of a binary with a 40 d orbital period. The low value of the orbital mass function and the lack of any evidence of spectral features from the companion suggested that the companion is a low mass and faint pre-white dwarf, the remnant core of the former mass donor in the binary. Rappaport et al. (2009) showed that the orbital period and probable mass of the suspected white dwarf match the expected relation for stars that lose their envelopes during the red giant phase, and they developed a detailed model of the past and future evolutionary paths of the binary system.
The hunt to find the flux of the white dwarf companion led to a possible detection on 2016 October 13 in Papua New Guinea when David and Joan Dunham observed an occultation of Regulus by the asteroid Adorea (Dunham & Dunham, 2017)111http://www.occultations.org/meetings/NA/2017Meeting/Dunham_RegulusAdorea.ppt. They recorded the event with a 10-inch “suitcase telescope” and video camera, and their results detected the presence of a faint ( mag) star at the precise location of Regulus during the 3 s occultation of Regulus itself. The chance is remote that a field star this bright would be found exactly at the position of Regulus, so they suggested that the faint star is the binary companion that escaped occultation by Adorea.
A spectroscopic detection of the companion of Regulus would certainly advance our knowledge of the system parameters and evolutionary state. Identifying the spectral features of the faint companion would yield new information on the orbital Doppler shifts and masses as well as the pre-white dwarf temperature and flux contribution. Here we present an analysis of additional archival spectroscopy of Regulus with the goal of detecting the spectral signature of the pre-white dwarf. Section 2 describes the additional spectroscopy data that we measured to derive radial velocities and improved orbital elements. We then focus in Section 3 on an homogeneous set of high resolution and high S/N echelle spectra that is ideal for extracting the faint signal of the pre-white dwarf spectrum. We conclude in Section 4 with a discussion of the observational results and their implications for our understanding of the evolutionary state of both components.
2 Radial Velocities and Revised Orbital Elements
The first step in a search for the companion is to verify the orbital elements
in order to estimate the companion’s velocity at the time of the observations.
In our earlier paper on Regulus (Gies et al., 2008), we presented radial velocity
measurements based upon 15 sets of spectroscopic data as listed in Table 1
of that paper. Here we present new measurements from five additional sets
of spectra that supplement the original sets. Table 1 lists the
observational dates and characteristics of the spectrograph for each of these
with an incremental number assigned to each source that continues from the
original work. The data sources include the following:
#16. Echelle spectra obtained with the Okayama Astrophysical Observatory
1.88 m telescope (Japan) and fiber-fed HIDES spectrograph (Kambe et al., 2013).
The radial velocities were measured for the H line with the cross-correlation
technique using the rv.fxcor task in IRAF (Alpaslan, 2009).
This set is based upon 139 spectra, and the results obtained close in time
were combined to form 17 nightly averages and their standard deviations.
#17. Spectra made with the Bochum Échelle Spectroscopic Observer (BESO)
fiber-fed, high-resolution spectrograph on the 1.5-m Hexapod Telescope at the
Cerro Armazones Observatory (Chile) (Fuhrmann et al., 2011). These measurements were
summarized by Chini et al. (2012) and include five spectra for three nightly averages.
#18. Spectra from the California Planet Survey made with the HIRES echelle
spectrograph on the Keck I telescope. The measurements were presented by
Becker et al. (2015) and are based upon 21 spectra yielding four nightly averages.
#19. Ultraviolet spectra obtained as part of the HST STIS Advanced Spectral
Library (ASTRAL) Project (Ayres, 2014). This set includes six E140H and eight
E230H echelle spectra that were obtained in three contiguous time groups spread
over four days. These were re-binned to a resolving power of on a
grid, and then each spectrum was cross-correlated with a model spectrum for
Regulus from the UVBLUE grid (Rodríguez-Merino et al., 2005). Radial velocities from the
cross-correlation maxima positions were averaged and standard deviations determined
for each of the three groups obtained close in time.
#20. This is a remarkable set of spectra hosted at the PolarBase
web site222http://polarbase.irap.omp.eu/
(Petit et al., 2014) that is an archive of data from the ESPaDOnS and NARVAL high-resolution
spectropolarimeters on the Canada-France-Hawaii Telescope (CFHT)
and the Télescope Bernard Lyot (TBL, Pic du Midi Observatory), respectively.
Most of these were obtained as part of
the MiMeS (Magnetism in Massive Stars) survey (Wade et al., 2016) and
the BritePol survey (Neiner et al., 2017). We collected 786 spectra that were
re-binned onto a standard wavelength grid with a lower resolving power
of in order to increase the spectral S/N, and then
nightly average spectra were formed for 25 dates. These spectra were cross-correlated
with a model spectrum for Regulus from the BLUERED grid (Bertone et al., 2008) over the range from
3941 to 4936 Å, where the signal-to-noise ratio (S/N) was high, the deepest H and He I lines are present,
and the spectrum is free of Earth’s atmospheric lines. Radial velocities were measured from
the cross-correlation maxima with uncertainties estimated from the maximum
likelihood method of Zucker (2003). The mean spectrum of Regulus and the model
spectrum used as the cross-correlation template are shown in Figure 1.

| Run | Dates | Range | Resolving Power | Observatory/Telescope/ | |
|---|---|---|---|---|---|
| Number | (BY) | (Å) | () | Spectrograph | |
| 16 | 2009.9 – 2013.9 | 4400 – 7500 | 50000 | 17 | Okayama/1.8 m/HIDES |
| 17 | 2010.3 – 2013.9 | 3620 – 8530 | 50000 | 3 | Cerro Amazones/1.5 m/BESO |
| 18 | 2006.2 – 2008.0 | 3643 – 7990 | 55000 | 4 | Keck I/10 m/HIRES |
| 19 | 2014.3 | 1160 – 3046 | 114000 | 3 | HST/2.4 m/STIS |
| 20 | 2005.4 – 2016.3 | 3700 – 10000 | 65000 | 25 | CFHT/3.6 m/ESPaDOnS and TBL/2.0 m/NARVAL |
These 52 new radial velocity measurements are collected in Table 2 that lists the heliocentric Julian date of mid-observation, the orbital phase (see below), the radial velocity and its uncertainty, the observed minus calculated residual (see below), and the run number corresponding the observational journal in Table 1. The velocities given in Table 2 for the ESPaDOnS/NARVAL set (run #20) are offset by km s-1 in order to match the systemic velocity found from other measurements (see below). We found that some of the uncertainties based on the standard deviation of a small set of nightly averages were unrealistically small, so we set a lower limit of 1 km s-1 in such cases. On the other hand, the uncertainties for the ESPaDOnS/NARVAL set were slightly too large and led to a reduced in the fit, so these were rescaled to obtain a final reduced equal to one.
| Date | Orbital | Run | |||
|---|---|---|---|---|---|
| (HJD2,400,000) | Phase | (km s-1) | (km s-1) | (km s-1) | Number |
| 53509.741 | 0.967 | 0.8 | 20 | ||
| 53511.763 | 0.018 | 0.8 | 20 | ||
| 53806.881 | 0.377 | 1.2 | 18 | ||
| 53903.755 | 0.792 | 0.8 | 20 | ||
| 53904.750 | 0.817 | 0.8 | 20 | ||
| 53905.748 | 0.842 | 0.8 | 20 | ||
| 54086.035 | 0.338 | 2.7 | 18 | ||
| 54110.576 | 0.950 | 0.9 | 20 | ||
| 54250.868 | 0.448 | 1.0 | 18 | ||
| 54461.132 | 0.691 | 3.2 | 18 | ||
| 55191.627 | 0.907 | 1.0 | 16 | ||
| 55193.627 | 0.957 | 1.0 | 16 | ||
| 55199.518 | 0.104 | 1.0 | 16 | ||
| 55231.164 | 0.893 | 1.0 | 16 | ||
| 55275.009 | 0.986 | 1.0 | 16 | ||
| 55304.614 | 0.725 | 1.0 | 17 | ||
| 55338.040 | 0.558 | 1.0 | 16 | ||
| 55343.486 | 0.694 | 1.9 | 17 | ||
| 55519.381 | 0.080 | 1.0 | 16 | ||
| 55520.359 | 0.105 | 1.0 | 16 | ||
| 55521.370 | 0.130 | 1.0 | 16 | ||
| 55597.085 | 0.018 | 1.0 | 16 | ||
| 55640.406 | 0.098 | 0.9 | 20 | ||
| 55656.375 | 0.496 | 1.0 | 20 | ||
| 55658.431 | 0.548 | 0.9 | 20 | ||
| 55694.955 | 0.458 | 1.0 | 16 | ||
| 55751.777 | 0.875 | 0.8 | 20 | ||
| 55755.759 | 0.975 | 0.8 | 20 | ||
| 55757.755 | 0.024 | 0.8 | 20 | ||
| 55842.366 | 0.134 | 1.0 | 16 | ||
| 55906.287 | 0.728 | 1.0 | 16 | ||
| 55906.673 | 0.738 | 1.0 | 20 | ||
| 55932.158 | 0.373 | 0.8 | 20 | ||
| 55935.119 | 0.447 | 0.8 | 20 | ||
| 55935.652 | 0.460 | 1.0 | 20 | ||
| 55936.583 | 0.484 | 1.0 | 20 | ||
| 55960.115 | 0.071 | 0.8 | 20 | ||
| 56055.069 | 0.438 | 1.0 | 16 | ||
| 56104.787 | 0.678 | 0.7 | 20 | ||
| 56105.794 | 0.703 | 0.8 | 20 | ||
| 56106.798 | 0.728 | 0.8 | 20 | ||
| 56107.797 | 0.753 | 0.8 | 20 | ||
| 56274.249 | 0.904 | 1.0 | 16 | ||
| 56615.296 | 0.408 | 1.0 | 16 | ||
| 56623.875 | 0.622 | 1.5 | 17 | ||
| 56625.250 | 0.657 | 1.0 | 16 | ||
| 56752.788 | 0.837 | 4.0 | 19 | ||
| 56754.680 | 0.884 | 5.6 | 19 | ||
| 56756.703 | 0.935 | 2.2 | 19 | ||
| 57460.468 | 0.484 | 0.9 | 20 | ||
| 57468.597 | 0.687 | 0.8 | 20 | ||
| 57485.509 | 0.108 | 0.9 | 20 |
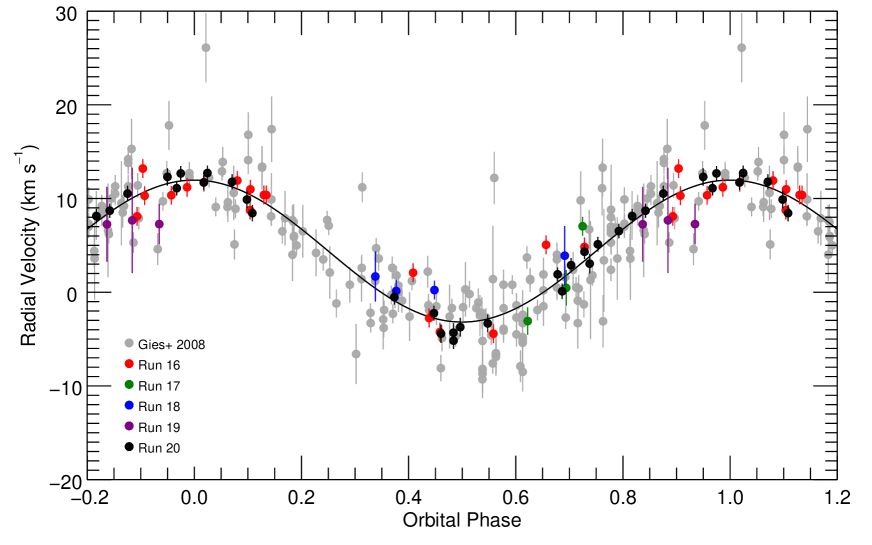
We solved for the orbital elements using the rvfit code333http://www.cefca.es/people/∼riglesias/rvfit.html written by Iglesias-Marzoa et al. (2015). Initial fits yielded zero eccentricity within errors, so we adopted a circular orbital solution. The ESPaDOnS/NARVAL set of measurements is particularly useful because they are numerous, cover a time span of 11 y, and the spectra were made with essentially identical instruments. Thus, we began with a fit of the ESPaDOnS/NARVAL set alone that is given in column 3 of Table 3, which lists the orbital period , epoch of maximum radial velocity , semiamplitude , and systemic velocity , along with the derived projected semimajor axis , mass function , and root-mean-square (r.m.s.) of the residuals from the fit. These elements agree within uncertainties with those derived earlier (Table 3, column 2; Gies et al. 2008) with the exception of the systemic velocity. This difference may result from the properties of the ESPaDOnS/NARVAL wavelength calibration, the adopted spectral normalization of the echelle blaze function in the vicinity of the strong Balmer lines, and/or asymmetries in the cross-correlation functions related to mismatch of the model and observed spectra. In any case, we decided to apply a constant offset of km s-1 to the ESPaDOnS/NARVAL velocities that was based upon a comparison with from a preliminary solution that used all the other velocities. The final column of Table 3 gives the elements from the complete merged set of radial velocities from Gies et al. (2008) and Table 2, and the associated radial velocity curve is shown in Figure 2. The revised elements from all the data agree with the earlier results, and the enlarged data set achieves lower uncertainties for the orbital elements.
| Element | Gies et al. (2008) | ESPaDOnS/NARVAL | All data |
|---|---|---|---|
| (d) | |||
| (HJD – 2,400,000) | |||
| (km s-1) | |||
| (km s-1) | |||
| () | |||
| () | |||
| r.m.s. (km s-1) | 2.8 | 0.8 | 3.3 |
3 Detection of the Pre-White Dwarf Spectrum
3.1 Detection Method
The companion of Regulus is very faint, so it is extremely difficult to identify its spectral lines directly even in very high S/N spectra. The best approach is to find ways to average the spectral signal of the companion using many spectral features and including all the spectra of interest. Creating a cross-correlation function (CCF) of an observed and model spectrum effectively multiplexes all the matching spectral features into a single “superline” profile. Thus, our search method involves an analysis of the CCFs that are shifted into the frame of reference of the companion star and then co-added to obtain the best S/N ratio.
The ESPaDOnS/NARVAL collection of spectra is ideal for this purpose because the individual and nightly averaged spectra have very high S/N ( in the better exposed parts) and they are well distributed over the range of orbital Doppler shifts (Fig. 2). We began by calculating the CCFs with a model spectrum for the assumed parameters of the companion. The flux-normalized model was taken from the BSTAR2006 grid from Lanz & Hubeny (2007) and transformed to the same wavelength scale used for all the ESPaDOnS/NARVAL spectra. The model spectrum is based upon an assumed solar metallicity, a given secondary effective temperature and gravity, and no rotational broadening. We caution that the pre-white dwarf companion may have a photospheric composition that differs from the solar one and that the highest gravity available in the BSTAR2006 grid is probably much lower than the actual value (Section 3.6). Older white dwarf stars have very diverse abundances in their outer atmospheres, but the companion of Regulus is probably too young (Section 4) for elemental diffusion processes to have altered the abundances significantly. Thus, a model spectrum based upon solar abundances is a reasonable starting assumption in a search for the spectral line patterns of the companion in the spectrum of Regulus.
The CCFs derived using a model spectrum with kK (Section 3.4) are dominated by the correlation of the spectral features with the very broad lines in the much brighter spectrum of Regulus itself (compare the observed and model spectra in Fig. 1). Consequently, the next step is to make a first-order correction to remove the broad part of the CCF function that is due to the primary star. All 25 CCFs were shifted in velocity space using the orbital solution for the ESPaDOnS/NARVAL spectra (Table 3, column 3) to place them into the primary’s frame of reference, and then they were co-added to form a primary CCF component. This step assumes that any secondary contribution is too weak and too spread over the velocity range of the secondary between observations to have any impact on the shape of the primary CCF. Once calculated, we shifted the average primary CCF to the observer’s frame for each observed orbital phase and then subtracted it from the observed CCF to derive a matrix of CCF residuals. The CCF residuals are dominated by spectrum to spectrum variations due to small differences in flux rectification that produce low frequency variations with a full sample standard deviation of (approximately of the average CCF maximum before subtraction).
It is very difficult to discern the secondary signal in any individual residual CCF. The residuals after subtraction of the primary component are dominated by low frequency, small amplitude variations that are probably related to small differences between spectra in the final flux placement after echelle blaze normalization. Thus, before coadding the secondary-shifted, residual CCFs, we subtracted from each one a Gaussian smoothed version of itself (with a Gaussian FWHM = 460 km s-1, selected to be much larger than the expected widths of most of the secondary’s spectral features). This effectively removed the low frequency variations while maintaining the sharper, high frequency parts of the CCFs. We experimented with different amounts of Gaussian filtering for background subtraction, and in general a larger Gaussian FWHM results in incomplete removal of the background variations (making it harder to discern the companion signal) while a smaller Gaussian FWHM tends to remove the signal from the companion.
The final steps are to shift each residual CCF into the velocity frame of the companion (for an assumed companion semiamplitude ), coadd the residuals from each observation into a mean CCF, and then subtract a linear fit of the background of the mean CCF far from the CCF central velocity in order to compare any resulting signal with a baseline set to zero. We show the result of this procedure in Figure 3 that shows the mean of the CCF residuals in the velocity frame of the companion. There is a central peak in the mean CCF that represents the sought-after signal from the spectrum of the faint companion star. There are significant variations away from the central peak that are probably related to correlation with echelle order boundaries and other systematic imperfections in the spectra. Instead of using these variations to estimate the CCF noise level, we performed a numerical experiment by making 1000 iterations of a bootstrap random selection of 25 phase samples from the set of CCFs, and then calculating the mean CCF for each sample in the same way as described above. The horizontal dotted lines show the standard deviation levels in the final mean derived from the bootstrap procedure. The vertical dotted line marks the position of the central peak that occurs close to the expected zero velocity location and reaches about above the noise level.

3.2 Validation Tests
The signal detected corresponds to a very faint companion star spectrum (Section 3.4), so it is important to consider tests of the significance of the CCF peak feature. We present several numerical tests here that were suggested to us by the referee and that help to validate the reality of the detected signal. The first is the construction of a “skew map” representation of the orbital phase-integrated signal that has proved to be a valuable tool to detect the faint spectral features of cool mass-donor stars in cataclysmic variables (Smith et al., 1993, 1998; Vande Putte et al., 2003). The concept of the skew map is to evaluate the line integral in a set of CCFs in a matrix of velocity shift and orbital phase for a source that exhibits Doppler shifts according to
| (1) |
where is the sinusoidal representation of orbital phase (equal to our adopted cosinusoidal phase in Table 3 plus 0.75). represents axial motion directed from primary towards secondary and represents orthogonal orbital motion for a circular orbit. An actual signal from an orbiting companion only occurs for and , but it is helpful to calculate the skew map for the full range in and in order to judge the strength of a companion signal with other spurious peaks for non-physical parameters.
We constructed such a skew map by shifting each of the residual CCFs according to the test values of and the observed orbital phases for each of the 25 ESPaDOnS/NARVAL spectra. Then the line integral was taken as the average of the shifted CCF residuals at the velocity of the peak of the signal shown in Figure 3. We found that the background variations of the CCFs varied in a systematic way with parameter . Thus instead of subtracting a smoothed CCF background as done in Section 3.1, we formed a CCF background from the CCF residuals at offset positions of km s-1 for each value of , and then we subtracted this background from the CCF before evaluating the mean value at the peak position. This procedure may also remove the sought after signal if the companion spectral features have half-widths similar to or larger than 70 km s-1, but the correlation widths for the spectrum of the companion are much smaller than this offset (Section 3.3).
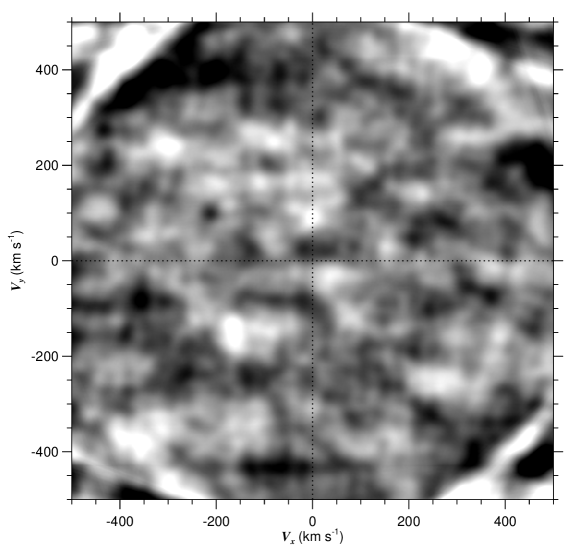
The background subtracted skew map from the CCF residuals is shown as a grayscale image in Figure 4. This image shows that indeed there are other spurious peaks as well as arc features at the extremes of the diagram that arise from edge effects in the CCFs. However, in the region of interest of there is only one bright feature that corresponds to the signal revealed in Figure 3 (at km s-1). Thus, the predominance of this signal at a location in the skew map where it is expected to occur offers support for a true detection.
The second validation test is based upon the idea that the detected peak results from assuming coherent Doppler shifts for the companion star. If instead the orbital phases and velocities were incorrect, then any peak in the co-added residuals would be very weak because the false Doppler shifts would spread the signal over a range in velocity. Therefore, we conducted a numerical test by randomly scrambling the assigned orbital phases of the observations and then forming the residual CCFs over a range of assumed to 200 km s-1. We then determined the resulting CCF maximum near the velocity of the peak shown in Figure 3 over the grid of trial values. We made 10000 iterations of the procedure and collected the resulting peak maxima for statistical analysis. We show in Figure 5 the probability distribution of finding a peak with a height or larger from the randomly scrambled set of CCFs. The vertical line in Figure 5 gives the observed height of the peak we identify using the correctly ordered phases. The chance of finding a peak this high is very small, about 1 in 3000 for the random sampling of the observed phases (making this a detection).

The third validation test involved inserting an artificial spectrum into the observed spectra with pre-defined Doppler shifts and flux ratio, and then using the same CCF procedures to detect the artificial signal. This test demonstrates how the performance of the method deteriorates for ever fainter companion spectra. The simulation used the same TLUSTY model companion spectrum for the inserted signal, but the assumed semiamplitude was assumed to be much larger ( to 500 km s-1) in order to avoid overlapping the actual and simulated CCF signals. The model spectra were added to the observed spectra to form combined spectra ,
| (2) |
where the assumed monochromatic flux ratio is . Then the combined model spectra were used to form CCF residuals as done for the observations, and a search was made for the corresponding peak in the co-added residuals over a grid of trial values to find the semiamplitude that maximizes the signal (Section 3.3).
Removal of the background variations in the CCFs was again accomplished by smoothing each CCF and subtracting the smoothed version to reveal the high frequency component of the correlation. We found, however, that the final signal was still dwarfed by background variations for faint flux ratios, so for this test each co-added CCF for a given test was compared to that for the case of no companion spectrum insertion to determine the net peak strength.
This simulation was done for 16 flux ratios on a logarithmic grid, and for each flux ratio ten simulations were made by inserting the model spectra into the observed set for the Doppler shifts associated with a randomly selected value of between 300 and 500 km s-1. The pairs of input and derived were collected from the simulations, and finally the standard deviation of their difference was determined for each bin of model flux ratio.
The results of the simulation are shown in Figure 6 that shows the standard deviation between input and derived semiamplitude as a function of model flux ratio. The agreement is good and the standard deviation is low for brighter model companions. On the other hand, as expected the derived semiamplitude departs from the model value at progressively lower flux ratios. The vertical dashed line shows the estimated monochromatic flux ratio for the companion of Regulus (Section 3.4), and this occurs at a value that is about a factor of 10 larger than that where the deviations between model and derived semiamplitude become relatively large. Thus, this simulation indicates that the companion is bright enough that the spectra S/N and CCF analysis are sufficient for a reliable detection and for an estimate of semiamplitude (Section 3.3).

All three of these validation tests indicate that the CCF signal we detect can be confidently associated with the spectral correlation from the companion of Regulus. In the next subsections, we assume that CCF signal does reveal the flux of the pre-white dwarf star, and we use the observed CCF properties to estimate physical parameters for this star.
3.3 Secondary Orbital Semiamplitude
Tests show that the strength and sharpness of the central peak varies with the assumed semiamplitude , becoming increasingly weaker, broader, and unfocussed as the trial value of departs from its actual value. This means that we can perform trial runs over a grid of test values to find a best-fit estimate that maximizes the peak strength and minimizes the net width of the residual peak. We found that many of the peaks and troughs surrounding the central peak grew in amplitude with increasing assumed , indicating that they are artifacts introduced by correlation with stationary imperfections in the spectra. Consequently, instead of using the simple subtraction of a smoothed version of the CCF, we adopted the mean formed from an unrealistically large km s-1 shift-and-add of the CCFs as a reference for the background. For each trial value of from 10 to 200 km s-1, this background template was scaled by a factor of and then subtracted from the observed residual CCF to isolate the peak from the companion alone. The local background was set interactively around the central peak for each trial value of , and then the maximum peak height above the local background was recorded together with the second moment of the peak distribution as a measurement of the peak half width. The measured peak height and half width are plotted as functions of in Figure 7.

We next implemented a bootstrap selection of 25 non-unique spectra from the original set in order to repeat the analysis using the same local background velocity regions that were selected interactively. The same procedure of forming the co-added CCF residuals was run over a grid of test values to find the value that maximized the peak height and that minimized the peak half-width. We performed 3000 bootstrap iterations of observation resampling to form distribution functions for the best fitting values, and we determined uncertainties from the standard deviations of these distributions. The peak height criterion attains a maximum at km s-1, and the peak half-width is a minimum (narrowest) at km s-1. We take the error weighted means of the semiamplitude and uncertainty to derive our final estimate, km s-1.
This result implies a mass ratio that is consistent with expectations from the mass function and evolutionary scenarios (Gies et al., 2008; Rappaport et al., 2009) and with similar results for stripped down companions in Be binaries (Wang et al., 2018) and EL CVn binaries (Maxted et al., 2014; Matson et al., 2015; Wang et al., 2020). Using the orbital solution from all spectra (Table 3, column 4) leads to mass product estimates of and . Regulus presents a spin inclination axis of deg to our line of sight (Che et al., 2011), and this should be equal to the orbital inclination according to models of donor spin-up through binary mass transfer. Thus, we expect that , so the actual masses are close to the products given above.
The minimum peak half-width of 20 km s-1 is close to the value expected from cross-correlation with a model spectrum with no rotation, so any rotational broadening in the companion spectrum is small and unresolved. Models of interacting binaries indicate that the mass donor will grow to the dimensions of its Roche lobe, and the subsequent tidal torques will force the entire star into synchronous rotation. This would imply that the companion rotation period is the same as the orbital period (40 d), so any projected rotational velocity would be insignificant and the spectral lines would appear narrow. Synchronous rotation and sharp lines are found for the stripped companions in many other pre-white dwarf plus main sequence star binaries (Matson et al., 2015; Wang et al., 2018, 2020).
3.4 Dependence of Peak Height on Temperature and Flux Ratio
The CCF peak height is also related to the degree of spectral feature matching between the companion and model spectra. We repeated the CCF calculations using a range in model effective temperature and constructing models from the UVBLUE (Rodríguez-Merino et al., 2005) and BSTAR2006 Lanz & Hubeny (2007) grids for less than and greater than 15 kK, respectively. The peak strength reaches a maximum for kK, and the peak disappears for models with kK and kK. Thus, the companion appears to be much hotter than the primary star, which has kK (Gies et al., 2008).
The absolute residual peak height is directly related to the companion flux contribution to the combined spectrum. Thus, we can infer the monochromatic flux ratio from the observed signal strength by determining the predicted relationship between these parameters. We calculated this functional relation by performing a series of simulations of composite spectra over a grid of assumed flux ratios. For each assumed flux ratio, we created a simulated set of 25 spectra by adding the TLUSTY model spectrum of the companion (Fig. 1) to the observed spectrum for the assumed companion Doppler shifts and flux contribution. We formed cross-correlation functions with this simulated set, and then followed the same procedure to remove the primary’s contribution and co-add the the residuals in the secondary’s frame as we did with the actual observations. The final step was to measure the net growth of the signal peak height as a function of assumed and form the linear relation between these parameters. The observed peak appears to be superimposed upon a local maximum in Figure 5, so we used the net peak strength above the local background of together with the derived linear relation to estimate the flux ratio, . This is equivalent to a -band magnitude difference of mag.
This observed monochromatic flux ratio is related to the ratio of stellar radii by
where is the radius and is the emitted monochromatic flux. We calculated that the emitted flux ratio per unit area is for the -band and kK and kK using model fluxes from Bertone et al. (2008). Thus, the derived radius ratio from the relation above is . The error estimate is based on both the uncertainty in from the peak height and the uncertainty in from the range in possible companion temperature and associated model flux. Che et al. (2011) measured the polar and equatorial radii of Regulus, and using their average of , we arrive at a companion radius of .
3.5 Gravitational Redshift
Compact stars like white dwarfs are dense enough that their spectrum suffers a significant gravitational redshift in many cases (Greenstein & Trimble, 1967; Parsons et al., 2017). The prediction in this case is a velocity redshift of km s-1 that is equal to km s-1 for the companion mass and radius given above. A parabolic fit of the central peak velocity in Figure 3 yields a similar value of km s-1, where the uncertainty is dominated by the assumed value for the systemic velocity (taken from the ESPaDOnS/NARVAL solution in Table 3). Thus, the slight offset of the peak in Figure 5 is consistent with our expectation of the gravitational redshift.
3.6 Spectral Template Properties
The results above indicate that the detected CCF peak has the properties expected for a stripped down companion star. On the other hand, the spectrum template used to derive the CCFs is based on a gravity of (the largest in the TLUSTY model grid) while our results imply a larger gravity of . There are only a few published model synthetic spectra of solar abundance atmospheres for gravities this large. We show one example in Figure 1 for a model spectrum with kK and from the Tübingen NLTE Model Atmosphere Package (TMAP) (Werner et al., 2003; Rauch & Deetjen, 2003; Rauch et al., 2018) that we obtained from the Spanish Virtual Observatory web site444http://svo2.cab.inta-csic.es/theory/newov2/. This model is based upon a NLTE treatment of the energy levels for H and He, and also includes line opacity for C, N, O, Ne, Na, and Mg. It is similar in appearance to the TLUSTY model for kK and (Fig. 1) except that the H Balmer line wings have greater pressure broadening. Note that the Balmer line profiles in both the TLUSTY and TMAP models display very narrow absorption cores, and we suspect that the narrow appearance of the final CCF peak (Fig. 3) is due to the correlation of the Balmer line cores in the observed and model spectra. Note that our method of background subtraction will remove correlation from broad features, so the subtracted CCF lacks the broader component from correlation with the Balmer line wings. We found that the CCF peak of the companion is also present when the TMAP spectrum is used as a template, but the peak is somewhat weaker.
We also explored calculating the CCFs using the short and long wavelength halves of the spectra separately (divided at a mid-point wavelength of 4372 Å). We found that the peak was strong for the short wavelength part but nearly absent for the long wavelength part. The short wavelength region contains the strong Balmer lines of H, H, and H, while the long wavelength section only contains H and weaker lines of He I . The difference in the CCF strength for the two regions suggests that the H Balmer lines are the dominant contributor to the CCF amplitude. In the similar, lower mass binary, EL CVn, evidence suggests the presence of a thick hydrogen envelope even after extreme mass loss (Maxted et al., 2014), and the spectrum of the companion in EL CVn shows strong H Balmer lines with narrow cores (Wang et al., 2020), consistent with their appearance in the model CCF template spectra for solar abundances that we use here. Thus, the companion of Regulus probably has a photosphere with a significant hydrogen abundance.
4 Discussion
The cross-correlation analysis of the large set of high S/N spectra from ESPaDOnS/NARVAL reveals a weak signal that has all the properties expected for the spectral signature of the pre-white dwarf companion of Regulus. The CCF peak only appears using model spectra for a hot object, and it attains the strongest and narrowest morphology for a secondary semiamplitude that is consistent with the predicted extreme mass ratio and low mass of the pre-white dwarf remnant. The narrow appearance of the peak agrees with expectations of a low projected rotational velocity for synchronous rotation that is predicted in binary evolution models. The mass and radius implied by the observations lead to a predicted small gravitational redshift that is consistent with the measured peak velocity. Taken together, these results indicate that CCF peak marks the first detection of the spectral features of the pre-white dwarf companion of Regulus.
The stellar masses we derive from the CCF analysis are similar to those proposed in earlier work (Gies et al., 2008). Che et al. (2011) used the stellar temperature and luminosity and the Yale-Yonsei evolutionary tracks to find a primary mass of . This agrees within uncertainties with our result, .
The pre-white dwarf star has a low mass, , that represents the mass of the surviving core after completion of mass transfer. There is a close relationship between core mass and the properties of the former, Roche-filling red giant, and this implies that the core mass is related to the orbital period of the system. Rappaport et al. (2009) describe how the relation applies to the Regulus system and how the orbital period leads to a predicted pre-white dwarf mass of , and this estimate agrees within uncertainties with the measured mass.
The evolution of the stellar core after envelope removal was investigated by Istrate et al. (2016) using MESA models to study the internal structure and tracks in the plane. We show in Figure 8 one example for a He core pre-white dwarf with a mass of from the basic set they present, i.e., without consideration of elemental diffusion and rotation. The remnant first increases in temperature at constant luminosity, and then begins to fade towards the white dwarf cooling sequence. The star may experience episodic and short hydrogen shell flashes that cause excursions to higher luminosity. We also plot the properties of the pre-white dwarf in the Regulus binary in Figure 8, and it appears near the hot end of the cooling sequence predicted by the model. The diamond and plus sign tick marks indicate time intervals of 1 and 10 Myr, respectively, in the evolutionary tracks, and this model predicts that the remnant will have a temperature and luminosity like those observed between 3 and 100 Myr from the time of envelope removal.

Regulus itself was probably spun up to its fast rotation rate around the same time as the peak of the mass transfer rate that led to the stripping of the envelope of the mass donor. According to the companion model track in Figure 8, this occurred some 3 to 100 Myr ago. The upper range is similar to the age derived for the primary from Che et al. (2011) of 90 Myr based upon evolutionary tracks. Their estimate presumably refers to the time since the mass gainer was rejuvenated as a larger mass star by mass transfer from the mass donor, and it agrees with the elapsed time since the conclusion of mass transfer of Myr in the evolutionary model by Rappaport et al. (2009). These estimates are a significant fraction of the main sequence lifetime of a star (about 160 Myr; see Fig. 7 in Che et al. 2011). Thus, stars spun up by mass transfer may appear as rapid rotators for a significant part of their H-core burning lifetime. This suggests that many of the rapid rotators among the early-type stars may have also experienced spin-up through binary mass transfer (de Mink et al., 2014). If so, then there are many other cases awaiting discovery of faint white dwarfs and their progenitors orbiting rapidly rotating stars.
Our new results suggest a different interpretation of the occultation of Regulus by the asteroid Adorea (Dunham & Dunham, 2017). According to the orbital elements presented in Table 3, probable masses, and the distance from Hipparcos, the angular semimajor axis of the orbit is milliarcsec (mas). The projected separation at the time of the occultation was mas, much smaller than the angular diameter of the asteroid ( mas) that transited nearly centered over Regulus from the observing site. This indicates that both Regulus and its companion were occulted by Adorea. Furthermore, the mid-occultation magnitude of is significantly fainter than the estimated companion magnitude derived from the monochromatic flux ratio, mag. Consequently, it appears that flux recorded during the occultation was not that of the companion, but was probably the faint halo of diffracted light of Regulus itself. Based upon the observing site location and circumstances of the occultation, we estimate that the angular separation from the Regulus to the limb of Adorea varied from 0 to 18 mas with a time average of 11 mas. Using the program Occult (v4.6.0) written by Dave Herald555http://www.lunar-occultations.com/iota/occult4.htm, this corresponds to a decrease of 11.2 mag for the asymptotic part of the Fresnel diffraction pattern. Thus, the diffracted flux would yield a a Regulus magnitude of on average during the event. If we add the flux of Adorea (), then the total magnitude would be , the same as observed within uncertainties. This suggests that the observed magnitude during the occultation is consistent with the estimated diffraction flux of Regulus plus the flux of Adorea, and hence, there is no need to posit flux from another source. Nevertheless, future occultation observations may yet lead to a detection of the companion in favorable circumstances. For example, Richichi et al. (2011) used VLT observations of lunar occultations to detect binaries as close as 7 mas in separation with a magnitude difference as large as 6.5 mag.
The small angular separation of the stars means that direct imaging will remain challenging. However, given the equator-on orientation of the spin axis of Regulus, it is likely that the orbital axis has a similiar inclination. For the stellar radii and semimajor axis found above, eclipses should occur for an orbital inclination deg, which is slightly larger than the spin inclination found by Che et al. (2011), deg. Thus, it is marginally possible that the system exhibits shallow eclipses. The deeper (shallower) eclipse would occur at orbital phase 0.75 (0.25) in our ephemeris, and create dips of about 0.6 (0.3) millimag (for total eclipses) with a duration less than 17 hours. Rucinski et al. (2011) attempted a search for eclipses with the MOST satellite, but unfortunately, the noise in the light curve was comparable to the expected eclipse depth during the time of the secondary minimum when they observed (phase 0.25). Future space-based photometry might yet detect the eclipses of this remarkable system.
References
- Alpaslan (2009) Alpaslan, M. 2009, arXiv e-prints, arXiv:0912.4755. https://arxiv.org/abs/0912.4755
- Ayres (2014) Ayres, T. R. 2014, in Astronomical Society of India Conference Series, Vol. 11, Astronomical Society of India Conference Series, 1
- Becker et al. (2015) Becker, J. C., Johnson, J. A., Vanderburg, A., & Morton, T. D. 2015, ApJS, 217, 29, doi: 10.1088/0067-0049/217/2/29
- Bertone et al. (2008) Bertone, E., Buzzoni, A., Chávez, M., & Rodríguez-Merino, L. H. 2008, A&A, 485, 823, doi: 10.1051/0004-6361:20078923
- Che et al. (2011) Che, X., Monnier, J. D., Zhao, M., et al. 2011, ApJ, 732, 68, doi: 10.1088/0004-637X/732/2/68
- Chen et al. (2017) Chen, X., Maxted, P. F. L., Li, J., & Han, Z. 2017, MNRAS, 467, 1874, doi: 10.1093/mnras/stx115
- Chini et al. (2012) Chini, R., Hoffmeister, V. H., Nasseri, A., Stahl, O., & Zinnecker, H. 2012, MNRAS, 424, 1925, doi: 10.1111/j.1365-2966.2012.21317.x
- De Marco & Izzard (2017) De Marco, O., & Izzard, R. G. 2017, PASA, 34, e001, doi: 10.1017/pasa.2016.52
- de Mink et al. (2014) de Mink, S. E., Sana, H., Langer, N., Izzard, R. G., & Schneider, F. R. N. 2014, ApJ, 782, 7, doi: 10.1088/0004-637X/782/1/7
- Dunham & Dunham (2017) Dunham, D., & Dunham, J. 2017, in IOTA North American 2017 Annual Meeting
- Fuhrmann et al. (2011) Fuhrmann, K., Chini, R., Hoffmeister, V. H., et al. 2011, MNRAS, 411, 2311, doi: 10.1111/j.1365-2966.2010.17850.x
- Gies et al. (2008) Gies, D. R., Dieterich, S., Richardson, N. D., et al. 2008, ApJ, 682, L117, doi: 10.1086/591148
- Gosnell et al. (2019) Gosnell, N. M., Leiner, E. M., Mathieu, R. D., et al. 2019, ApJ, 885, 45, doi: 10.3847/1538-4357/ab4273
- Götberg et al. (2018) Götberg, Y., de Mink, S. E., Groh, J. H., et al. 2018, A&A, 615, A78, doi: 10.1051/0004-6361/201732274
- Gray et al. (2003) Gray, R. O., Corbally, C. J., Garrison, R. F., McFadden, M. T., & Robinson, P. E. 2003, AJ, 126, 2048, doi: 10.1086/378365
- Greenstein & Trimble (1967) Greenstein, J. L., & Trimble, V. L. 1967, ApJ, 149, 283, doi: 10.1086/149254
- Iglesias-Marzoa et al. (2015) Iglesias-Marzoa, R., López-Morales, M., & Jesús Arévalo Morales, M. 2015, PASP, 127, 567, doi: 10.1086/682056
- Istrate et al. (2016) Istrate, A. G., Marchant, P., Tauris, T. M., et al. 2016, A&A, 595, A35, doi: 10.1051/0004-6361/201628874
- Kambe et al. (2013) Kambe, E., Yoshida, M., Izumiura, H., et al. 2013, PASJ, 65, 15, doi: 10.1093/pasj/65.1.15
- Lanz & Hubeny (2007) Lanz, T., & Hubeny, I. 2007, ApJS, 169, 83, doi: 10.1086/511270
- Matson et al. (2015) Matson, R. A., Gies, D. R., Guo, Z., et al. 2015, ApJ, 806, 155, doi: 10.1088/0004-637X/806/2/155
- Maxted et al. (2014) Maxted, P. F. L., Bloemen, S., Heber, U., et al. 2014, MNRAS, 437, 1681, doi: 10.1093/mnras/stt2007
- McAlister et al. (2005) McAlister, H. A., ten Brummelaar, T. A., Gies, D. R., et al. 2005, ApJ, 628, 439, doi: 10.1086/430730
- Neiner et al. (2017) Neiner, C., Wade, G. A., Marsden, S. C., & Blazère, A. 2017, in Second BRITE-Constellation Science Conference: Small Satellites - Big Science, ed. K. Zwintz & E. Poretti, Vol. 5, 86–93
- Parsons et al. (2017) Parsons, S. G., Gänsicke, B. T., Marsh, T. R., et al. 2017, MNRAS, 470, 4473, doi: 10.1093/mnras/stx1522
- Petit et al. (2014) Petit, P., Louge, T., Théado, S., et al. 2014, PASP, 126, 469, doi: 10.1086/676976
- Pols et al. (1991) Pols, O. R., Cote, J., Waters, L. B. F. M., & Heise, J. 1991, A&A, 241, 419
- Rappaport et al. (2015) Rappaport, S., Nelson, L., Levine, A., et al. 2015, ApJ, 803, 82, doi: 10.1088/0004-637X/803/2/82
- Rappaport et al. (2009) Rappaport, S., Podsiadlowski, P., & Horev, I. 2009, ApJ, 698, 666, doi: 10.1088/0004-637X/698/1/666
- Rauch & Deetjen (2003) Rauch, T., & Deetjen, J. L. 2003, in Astronomical Society of the Pacific Conference Series, Vol. 288, Stellar Atmosphere Modeling, ed. I. Hubeny, D. Mihalas, & K. Werner, 103
- Rauch et al. (2018) Rauch, T., Demleitner, M., Hoyer, D., & Werner, K. 2018, MNRAS, 475, 3896, doi: 10.1093/mnras/sty056
- Richichi et al. (2011) Richichi, A., Chen, W. P., Fors, O., & Wang, P. F. 2011, A&A, 532, A101, doi: 10.1051/0004-6361/201117282
- Rodríguez-Merino et al. (2005) Rodríguez-Merino, L. H., Chavez, M., Bertone, E., & Buzzoni, A. 2005, ApJ, 626, 411, doi: 10.1086/429858
- Rucinski et al. (2011) Rucinski, S., Gruberbauer, M., Guenther, D. B., et al. 2011, Information Bulletin on Variable Stars, 5987, 1. https://arxiv.org/abs/1104.1723
- Smith et al. (1998) Smith, D. A., Dhillon, V. S., & Marsh, T. R. 1998, MNRAS, 296, 465, doi: 10.1046/j.1365-8711.1998.00743.x
- Smith et al. (1993) Smith, R. C., Collier Cameron, A., & Tucknott, D. S. 1993, in Cataclysmic Variables and Related Physics, ed. O. Regev & G. Shaviv, Vol. 10, 70
- van Leeuwen (2007) van Leeuwen, F. 2007, A&A, 474, 653, doi: 10.1051/0004-6361:20078357
- van Roestel et al. (2018) van Roestel, J., Kupfer, T., Ruiz-Carmona, R., et al. 2018, MNRAS, 475, 2560, doi: 10.1093/mnras/stx3291
- Vande Putte et al. (2003) Vande Putte, D., Smith, R. C., Hawkins, N. A., & Martin, J. S. 2003, MNRAS, 342, 151, doi: 10.1046/j.1365-8711.2003.06524.x
- Wade et al. (2016) Wade, G. A., Neiner, C., Alecian, E., et al. 2016, MNRAS, 456, 2, doi: 10.1093/mnras/stv2568
- Wang et al. (2018) Wang, L., Gies, D. R., & Peters, G. J. 2018, ApJ, 853, 156, doi: 10.3847/1538-4357/aaa4b8
- Wang et al. (2020) Wang, L., Gies, D. R., Lester, K. V., et al. 2020, AJ, 159, 4, doi: 10.3847/1538-3881/ab52fa
- Werner et al. (2003) Werner, K., Deetjen, J. L., Dreizler, S., et al. 2003, in Astronomical Society of the Pacific Conference Series, Vol. 288, Stellar Atmosphere Modeling, ed. I. Hubeny, D. Mihalas, & K. Werner, 31
- Willems & Kolb (2004) Willems, B., & Kolb, U. 2004, A&A, 419, 1057, doi: 10.1051/0004-6361:20040085
- Zucker (2003) Zucker, S. 2003, MNRAS, 342, 1291, doi: 10.1046/j.1365-8711.2003.06633.x