A wide-range wavelength-tunable photon-pair source for characterizing single-photon detectors
Abstract
The temporal response of single-photon detectors is usually obtained by measuring their impulse response to short-pulsed laser sources. In this work, we present an alternative approach using time-correlated photon pairs generated in spontaneous parametric down-conversion (SPDC). By measuring the cross-correlation between the detection times recorded with an unknown and a reference photodetector, the temporal response function of the unknown detector can be extracted. Changing the critical phase-matching conditions of the SPDC process provides a wavelength-tunable source of photon pairs. We demonstrate a continuous wavelength-tunability from 526 nm to 661 nm for one photon of the pair, and 1050 nm to 1760 nm for the other photon. The source allows, in principle, to access an even wider wavelength range by simply changing the pump laser of the SPDC-based source. As an initial demonstration, we characterize single photon avalance detectors sensitive to the two distinct wavelength bands, one based on Silicon, the other based on Indim Gallium Arsenide.
1 Introduction
Characterizing the temporal response function of single-photon detectors is crucial in time-resolved measurements, e.g. determining the lifetime of fluorescence markers [1], characterizing the spontaneous decay of single-photon emitters [2] and the photon statistics of astronomical sources [3] and measuring the joint spectral of photon-pair sources [4], so that the timing uncertainty contributed by the detection process can be taken into account. Typically, the temporal response of a detector is obtained from the arrival time distribution of photons collected from a pulsed laser. In this work, we present an alternative approach that leverages on the tight timing correlation [5] of photon pairs generated in spontaneous parametric down-conversion [6, 7] (SPDC): the coincidence signature corresponding to the detection of two photons of the same pair is used to infer the temporal response function of the photodetectors. Compared to a pulsed laser, a SPDC source is easier to align, and is wavelength-tunable by changing the critical phase-matching condition of the SPDC process [8]. In addition, one can address two wavelength bands with the same source by choosing a non-degenerate phase matching condition.
For an initial demonstration, we generate photon pairs with a tunable wavelength range over 100 nm in the visible band, and over 700 nm in the telecommunication band – a tunability at least comparable to existing femtosecond pulsed lasers – and use it to characterize both Silicon (Si-APDs) and Indium Gallium Arsenide (InGaAs-APDs) avalanche photodiodes. In particular, we characterize timing the behaviour of a fast commercial Si-APD (Micro Photon Devices PD-050-CTC-FC) over a continuous wavelength range, for which we previously assumed an approximately uniform temporal response of the detector in the wavelength range from 570 nm to 810 nm [3]. With the measurement reported in this work, we observe a significant variation of the timing jitter even on a relatively small wavelength interval of 10 nm. A better knowledge of the timing response of this particular Si APD contributes to a better understanding of coherence properties of light in such experiments. Similarly, better characterization of the timing response over a wide wavelength range helps to better model fluorescence measurements regularly carried out with such detectors [1].
2 Correlated photon pair source
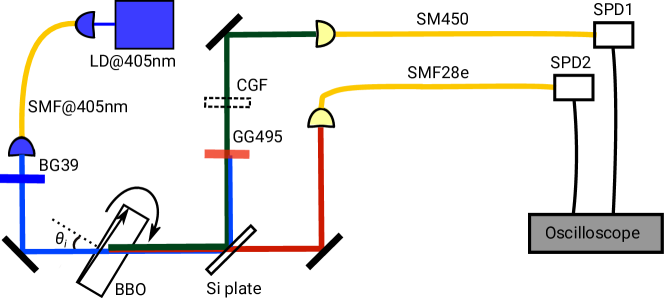
The basic configuration of the spontaneous parametric down conversion source is shown in Fig. 1. The output of a laser diode (central wavelength nm, output power 10 mW) is coupled to a single-mode optical fiber for spatial mode filtering, and focused to a Gaussian beam waist of 70 m into a 2 mm thick -Barium Borate crystal as the nonlinear optical element, cut for Type-II phase matching (, ).
For this cut, SPDC generates photon pairs in the visible and telecommunications band, respectively. We collect the photons in a collinear geometry, with collection modes (beam waists m) defined by two single-mode fibers: one fiber (SMF450: single mode from 488 nm to 633 nm) collects signal photons and delivers them to the single-photon detector SPD1, while the other fiber (standard SMF28e, single transverse mode from 1260 nm to 1625 nm) collects idler photons and delivers them to SPD2. The signal and idler photons are separated to their respective fibers using a 100 m-thick, polished Silicon (Si) plate as a dichroic element. The plate acts as a longpass filter (cut-off wavelength m), transmitting only the idler photons while reflecting approximately half of the signal photons.
To suppress uncorrelated visible and infrared photons detected by our SPDs, we insert both a blue color glass bandpass filter (BG39) in the pump path, attenuating parasitic emission from the pump laser diode and broadband fluorescence from the mode cleaning fiber, and a green color glass longpass filter (GG495) in the path of the idler photons to suppress pump light at SPD1. For the idler path, the silicon dichroic is sufficient.
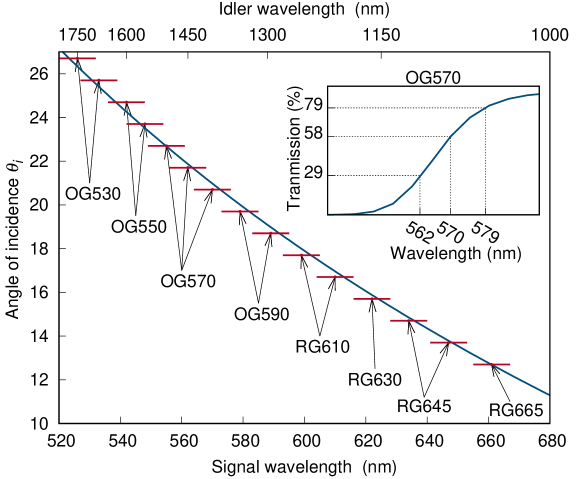
To tune the wavelength of down-converted photons, we change the critical phase-matching condition of the SPDC process by varying the angle of incidence of the pump beam at the crystal [9, 10]. Figure 2 (red dots) shows the signal and idler wavelengths, and , measured for our source for to . To measure the signal wavelength , we insert different standardized color glass longpass filters (CGF in Fig. 1) for different angles , and measure the transmission of the signal photons in order to infer their wavelength. The inset of Fig. 2 shows an example where a filter OG570 is used to infer close to the cut-off wavelength of the filter. The corresponding idler wavelength is calculated through energy conservation in SPDC, . Our measured SPDC wavelengths can be well described by a numerical phase matching model based on optical dispersion properties of BBO [11, 12] (blue line).
This simple pair source provides photons in a wavelength range of nm to 661 nm and nm to 1760 nm, comparable with existing dye and solid-state femtosecond pulsed lasers [13, 14]. In the following section, we demonstrate how the tight timing correlations of each photon pair can be utilized to characterize the temporal response of single photon detectors.
3 Characterizing the temporal response of single-photon detectors
The time response function of a single photon detector characterizes the distribution of signal events at a time after a photon (of a sufficiently short duration) is absorbed by a detector. It characterizes the physical mechanism that converts a single excitation into a macroscopic signal, and can be measured e.g. recording the average response to attenuated optical pulses from a femtosecond laser [15]. In this paper, we use the timing correlation in a photon pair, which emerges at an unpredictable point in time. This requires two single photon detectors registering a photon. As the photon pair is correlated on a time scale of femtoseconds, and the relevant time scales for detector reponses is orders of magitudes larger, the correlation function of time differences between the macroscopic photodetector signals is a convolution of the two detector response functions,
| (1) |
where the total number of recorded coincidence events. Obtaining the detector response function from a measured correlation function requires the known response function of a reference detector. For a device under test, can then be either reconstructed by fitting a in Eqn. 1 with a reasonable model for (with a parameter set ) to a measured correlation function, or obtained from it via deconvolution.
To measure , we evaluate the detection time at single photon detector SPD1 by recording the analog detector signal with an oscilloscope, and interpolating the time it crosses a threshold of around half the average signal height with respect to a trigger event caused by a signal of single photon detector SPD2. The histogram of all time differences for many pair events then is a good represenation of .
4 Reference detector characterization
We use a superconducting nanowire detector (SNSPD) with a design wavelength at 1550 nm as the reference detector SPD2, because a SNSPD has an intrinsic wide-band sensitivity and fast temporal response. To determine its response function , we measure the correlation function from photon pairs with two detectors of the same model (Single Quantum SSPD-1550Ag).
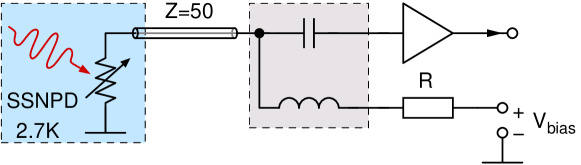
Figure 3 shows the biasing and readout circuit of a single SNSPD. The SNSPD is kept at a temperature of 2.7 K in a cryostat, and is current-biased using a constant voltage source ( V) and a series resistor () through a bias-tee at room temperature. The signal gets further amplified by 40 dB at room temperature to a peak amplitude of about 350 mV.
We first expose both detectors to photons at a wavelength of 810 nm using a degenerate PPKTP-based photon pair source pumped with a 405 nm laser diode (Fig. 4 (a)). The choice of using this source instead of the BBO-based source shown in Fig. 1 was borne out of convenience rather than from any limitation in our BBO-based source described before, as the PPKTP-based type-II SPDC source was readily available [16].
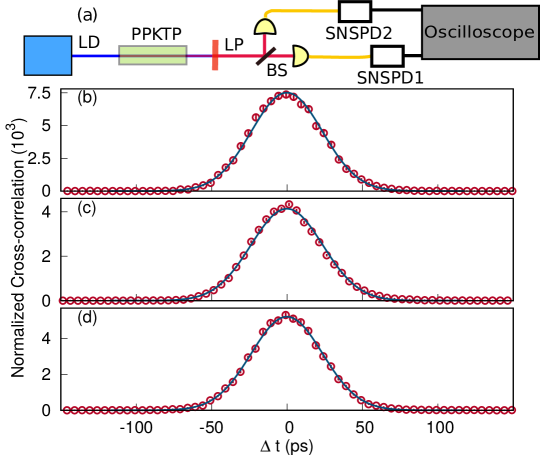
Figure 4 (b) shows the cross-correlation for the two SNSPDs, normalized to background coincidences (red dots).
The histogram closely follows a Gaussian distribution (blue line) with standard deviation ps. This suggests that the two responses are also Gaussian distributions, and Eqn. 1 can be simplified to
| (2) |
where is the total number of correlated photon pairs detected, is a normalized Gaussian distribution, and is associated with the accidental coincidence rate. The standard distribution of the correlation is then simply related to those of the individual detectors by . Assuming the same response for both detectors, we can infer at a wavelength of 810 nm, corresponding to a the full-width at half-maximum (FWHM) of 39.2(2) ps.
Next, we calibrate the SNSPD at 1550 nm using photon pairs at 810 nm and 1550 nm generated from the same PPKTP-based SPDC source pumped with a nm laser diode [Fig. 4 (a)]. The non-degenerate photon pairs are separated by a Si plate as a dicroic element. Figure 4 (c) shows the cross-correlation (red dots) of the photodetection times at the two SNSPDs, and a fit of a Gaussian distribution (blue line) with a standard deviation ps. With ps obtained at 810 nm previously, we obtain resulting in a timing jitter of 39.9(6) ps (FWHM) of the SNSPD at 1550 nm.
Finally, to determine the temporal response function of a SNSPD at 548 nm, we used the BBO-based pair source [Fig. 1] to prepare non-degenerate photon pairs at 548 nm and 1550 nm. Figure 4 (d) shows the cross-correlation obtained with our detectors. The fit to a Gaussian distribution (blue line) leads to a standard deviation ps. With the same argument as before, and using ps, we obtain a timing jitter of 38.9(7) ps (FWHM) at 548 nm. So in summary, the timing jitter of the SNSPD shows no statistically significant dependency on the wavelength in our measurements.
The timing jitter partually originates from the threshold detection mechanism: for a photodetection signal , the timing uncertainty for crossing a threshold, contributed by the electrical noise , is given by at the threshold [17, 18]. For our SNSPDs, we estimate ps, corresponding to a contribution of about 35 ps to the timing jitter of the combined SNSPD and electronic readout system, i.e., we are dominated by this electrical noise. The jitter of the oscilloscope is claimed to be a few ps, which suggests that the intrinsic jitter of these SNSPDs is about ps (FWHM) [19].
5 Avalanche photodetector characterization
First, we characterize the temporal response function of a thin Silicon avalanche photodiode (Si-APD) from Micro Photon Devices (PD-050-CTC-FC). Although thin Si-APDs have been characterized in previous works at a few discrete wavelengths [20, 21, 22], there has yet been a characterization performed over a continuous wavelength range.
Following Refs. [3, 23], we describe the temporal response function with a heuristic model
| (3) |
a combination of a Gaussian component of mean and standard deviation , and an exponential term with a characteristic decay constant . The weights of each distribution are described by and . The Gaussian component is associated with an avalanche that occurs due to the absorption of a photon in the depletion region. The exponential component, convoluted with a Gaussian distribution, is associated with an avalanche that is initiated by a photoelectron that diffused into the depletion region produced by photon absorption elsewhere.
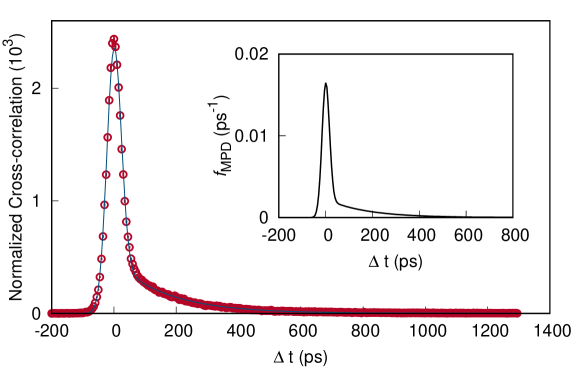
We characterize the Si-APD over a wavelength range from = 542 nm to 647 nm in steps of about 10 nm. The photon wavelength is tuned by rotating the crystal, changing the angle of incidence of the pump from to , in steps of . For each , we obtain the cross-correlation similarly as in section 4. Figure 5 (red dots) shows , the cross-correlation normalized to background coincidences, obtained when signal and idler wavelengths are nm and nm, respectively. For every , we deduce by fitting the measured to the model in Eqn. 1 with , and a Gaussian distribution with full-width at half-maximum (39.9 ps) corresponding to the SNSPD jitter at 1550 nm. For the SNSPD, we assume that its jitter remains constant over the wavelength range nm to 1602 nm, motivated by the observation that it does not differ significantly for nm and 1550 nm. The fit results in parameters and which characterize at the corresponding wavelength . Figure 5 (inset) shows for nm.
Two figures of merit are of interest for characterizing the thin Si APD: the duration of the exponential tail, and the ratio between the coincidences attributed to the Gaussian component to those attributed to the exponential component,
| (4) |
Both values determine if the full-width at half-maximum (FWHM), a value typically quoted for the detector jitter, serves as a good figure of merit for the temporal response of a detector. For example, the jitter of a detector with and , is better described by than the FWHM of the temporal response function.
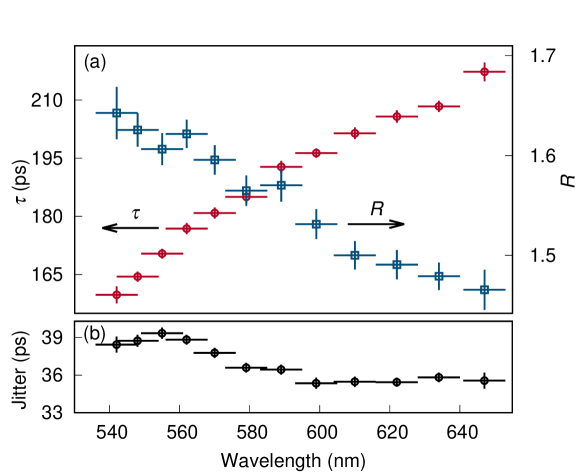
Figure 6 (a) shows that reduces while increases with increasing wavelength. The detector jitter (FWHM) is shown in Figure 6 (b). The observation that changes significantly with wavelength is especially revelant for fluorescence lifetime measurements, where the exponential tail in the temporal response function can be easily misattributed to fluorescence when the detector is not characterized at the wavelength of interest [1].
Next, we characterize the temporal response function of an InGaAs avalanche photodiode (S-Fifteen Instruments ISPD1) which is sensitive in the telecommunication band.
We extract by measuring the cross-correlation of the detection times between the InGaAs-APD and our reference SNSPD. We note that since the expected jitter of the InGaAs-APD (ps) is significantly larger than that of the SNSPD (ps), is well-approximated by .
Again, we fit to a heuristic model [24], here comprising of a linear combination of two Gaussian distributions
| (5) |
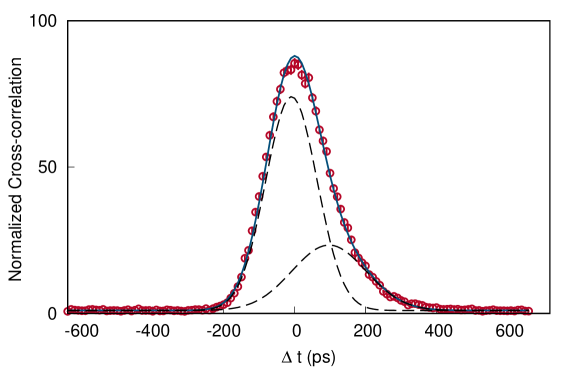
where and are the weights of each distribution, () and () is the mean and standard deviation characterizing the Gaussion distribution G, and is associated with the accidental coincidence rate. Figure 7 shows the measured cross-correlation (red dots) and the fit result (blue line) when the InGaAs-APD detected photons with a wavelength of 1200 nm.
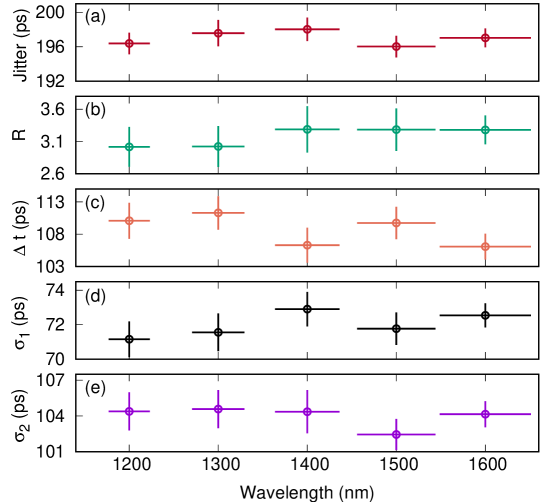
We tune the wavelength of the photons sent to the InGaAs-APD from 1200 nm to 1600 nm in steps of 100 nm, and obtain for each wavelength. Figure 8 shows the parameters describing the temporal response of the InGaAs-APD: its jitter, the ratio of the two Gaussian distributions contributing to , the temporal separation between the two Gaussian distributions (), and the standard deviation of the two Gaussian distributions (,). We find no significant variation of any parameter over the entire wavelength range.
6 Conclusion
We have presented a widely-tunable, non-degenerate photon-pair source that produces signal photons in the visible band, and idler photons in the telecommunications band. With the source, we demonstrate how the tight-timing correlations within each photon pair can be utilized to characterize single-photon detectors. This is achieved by measuring the cross-correlation of the detection times registered by the device-under-test (DUT), and a reference detector – an SNSPD, which has a relatively low and constant jitter over the wavelength range of interest. By taking into account the jitter introduced by the reference detector, we are able to extract the temporal response function of the DUT. As the source is based on SPDC in a BBO crystal, its output wavelengths are continuously tunable by varying the angle of incidence of the pump at the crystal. We experimentally demonstrated wavelength-tunability of over 100 nm in the visible band, and over 700 nm in the telecommunications band – a similar tunability compared to existing femtosecond pulsed laser systems.
With our source, we measured the temporal response functions of two single-photon detectors, an Si-APD and an InGaAs-APD, over a continuous wavelength range centered at the visible and telecommunications band, respectively. For the InGaAs-APD, we observed no significant variation of its jitter over a wide wavelength range. For the Si-APD, we observed that the exponential component of its temporal response increases with wavelength. This observation emphasizes the need for an accurate accounting of Si-APD jitter in precision measurements, e.g. characterizing fluorescence markers at the wavelength of interest [1], or measuring the photon statistics of narrowband astronomical sources [3].
Funding
This research was supported by the National Research Foundation (NRF) Singapore (Grant: QEP-P1), and through the Research Centres of Excellence programme supported by NRF Singapore and the Ministry of Education, Singapore.
References
- [1] W. Becker, Advanced time-correlated single photon counting techniques, vol. 81 (Springer Science & Business Media, 2005).
- [2] M. J. Stevens, R. H. Hadfield, R. E. Schwall, S. W. Nam, R. P. Mirin, and J. A. Gupta, “Fast lifetime measurements of infrared emitters using a low-jitter superconducting single-photon detector,” \JournalTitleApplied Physics Letters 89, 031109 (2006).
- [3] P. K. Tan, A. H. Chan, and C. Kurtsiefer, “Optical intensity interferometry through atmospheric turbulence,” \JournalTitleMonthly Notices of the Royal Astronomical Society 457, 4291–4295 (2016).
- [4] K. Zielnicki, K. Garay-Palmett, D. Cruz-Delgado, H. Cruz-Ramirez, M. F. O’Boyle, B. Fang, V. O. Lorenz, A. B. U’Ren, and P. G. Kwiat, “Joint spectral characterization of photon-pair sources,” \JournalTitleJournal of Modern Optics 65, 1141–1160 (2018).
- [5] C.-K. Hong, Z.-Y. Ou, and L. Mandel, “Measurement of subpicosecond time intervals between two photons by interference,” \JournalTitlePhysical review letters 59, 2044 (1987).
- [6] D. N. Klyshko, A. N. Penin, and B. F. Polkovnikov, “Parametric luminescence and light scattering by polaritons,” \JournalTitleJETP Lett. 11, 5–8 (1970).
- [7] D. C. Burnham and D. L. Weinberg, “Observation of simultaneity in parametric production of optical photon pairs,” \JournalTitlePhys. Rev. Lett. 25, 84–87 (1970).
- [8] S. E. Harris, “Tunable optical parametric oscillators,” \JournalTitleProceedings of the IEEE 57, 2096–2113 (1969).
- [9] R. L. Sutherland, Handbook of nonlinear optics (CRC press, 2003), 2nd ed.
- [10] R. W. Boyd, Nonlinear Optics (Academic Press, Inc., USA, 2008), 3rd ed.
- [11] D. Eimerl, L. Davis, S. Velsko, E. K. Graham, and A. Zalkin, “Optical, mechanical, and thermal properties of barium borate,” \JournalTitleJournal of Applied Physics 62, 1968–1983 (1987).
- [12] D. N. Nikogosyan, “Beta barium borate (BBO) - A review of its properties and applications,” \JournalTitleApplied Physics A Solids and Surfaces 52, 359–368 (1991).
- [13] F. J. Duarte, P. Kelley, L. W. Hillman, and P. F. Liao, Dye laser principles: with applications (Academic Press, 1990).
- [14] E. Sorokin, S. Naumov, and I. T. Sorokina, “Ultrabroadband infrared solid-state lasers,” \JournalTitleIEEE Journal of Selected Topics in Quantum Electronics 11, 690–712 (2005).
- [15] A. Lamas-Linares and C. Kurtsiefer, “Breaking a quantum key distribution system through a timing side channel,” \JournalTitleOpt. Express 15, 9388–9393 (2007).
- [16] L. Shen, J. Lee, L. P. Thinh, J.-D. Bancal, A. Cerè, A. Lamas-Linares, A. Lita, T. Gerrits, S. W. Nam, V. Scarani, and C. Kurtsiefer, “Randomness extraction from bell violation with continuous parametric down-conversion,” \JournalTitlePhys. Rev. Lett. 121, 150402 (2018).
- [17] G. Bertolini and A. Coche, Semiconductor Detectors (North-Holland, 1968).
- [18] J. Wu, L. You, S. Chen, H. Li, Y. He, C. Lv, Z. Wang, and X. Xie, “Improving the timing jitter of a superconducting nanowire single-photon detection system,” \JournalTitleAppl. Opt. 56, 2195–2200 (2019).
- [19] B. Korzh, Q.-Y. Zhao, J. P. Allmaras, S. Frasca, T. M. Autry, E. A. Bersin, A. D. Beyer, R. M. Briggs, B. Bumble, M. G. M. C. Colangelo, A. E. Dane, T. Gerrits, F. Marsili, G. Moody, E. Ramirez, J. D. Rezac, M. J. Stevens, E. E. Wollman, D. Zhu, P. D. Hale, K. L. Silverman, R. P. Mirin, S. W. Nam, M. D. Shaw, and K. K. Berggren, “Demonstration of sub-3 ps temporal resolution with a superconducting nanowire single-photon detector,” \JournalTitleNature Photonics 14, 250–255 (2020).
- [20] A. Lacaita, M. Ghioni, and S. Cova, “Double epitaxy improves single-photon avalanche diode performance,” \JournalTitleElectronics Letters 25, 841–843 (1989).
- [21] A. Giudice, M. Ghioni, R. Biasi, F. Zappa, S. Cova, P. Maccagnani, and A. Gulinatti, “High-rate photon counting and picosecond timing with silicon-spad based compact detector modules,” \JournalTitleJournal of Modern Optics 54, 225–237 (2007).
- [22] S. Cova, G. Ripamonti, and A. Lacaita, “Avalanche semiconductor detector for single optical photons with a time resolution of 60 ps,” \JournalTitleNuclear Instruments and Methods in Physics Research Section A: Accelerators, Spectrometers, Detectors and Associated Equipment 253, 482 – 487 (1987).
- [23] Q. Hernandez, D. Gutierrez, and A. Jarabo, “A Computational Model of a Single-Photon Avalanche Diode Sensor for Transient Imaging,” \JournalTitlearXiv:1703.02635 (2017).
- [24] A. Tosi, F. Acerbi, A. Dalla Mora, M. A. Itzler, and X. Jiang, “Active area uniformity of ingaas/inp single-photon avalanche diodes,” \JournalTitleIEEE Photonics Journal 3, 31–41 (2011).