Looking for the possible gluon condensation signature in sub-TeV gamma-ray spectra: from active galactic nuclei to gamma ray bursts
Abstract
The gluon condensation in the proton as a dynamical model is used to treat a series of unsolved puzzles in sub-TeV gamma ray spectra, they include the broken power-law of blazar’s radiation, the hardening confusion of 1ES 1426+428, Mkn 501, and the recently recorded sub-TeV gamma spectra of GRB 180720B and GRB 190114C. We find that the above anomalous phenomena in gamma ray energy spectra can be understood with the simple broken power law based on a QCD gluon condensation effect.
keywords:cosmic ray theory, gamma ray theory, very high energy cosmic rays
1 Introduction
Gluons are Boson. A Quantum Chromodynamics (QCD) analysis shows that the gluon distribution in the proton may evolute to a chaos solution at high energy limit, which arouses the strong shadowing and antishadowing effects and squeezes the gluons into a narrow space near a critical momentum [1-3]. This is the gluon condensation (GC).
The GC would lead to intriguing signatures in proton collisions, provided the GC-threshold enters the observable energy region. However, we have not directly observed the GC-effect at the Large Hadron Collider (LHC). Therefore, we turn to the astrophysical and cosmological observations. The energy of the protons accelerated in universe may exceed and causes the GC-effect in the collisions.
In a previous work [4] we have used the GC model to explain the sharp broken power law of the -ray spectra in supernova remnant (SNR) Tycho. In this work we will explore more GC-examples in the -ray spectra of active galactic nuclei (AGN). AGN represents a large population of extragalactic objects characterized with extremely luminous electromagnetic radiation produced in very compact volumes. AGNs with relativistic directional jets (so-called blazars) are very effective TeV -sources. Therefore, blazars may provide an ideal laboratory for studying the GC effect since they have extreme physical conditions.
AGNs have relatively large redshift. TeV radiation from these sources is affected by intergalactic absorption. Comparing the observed AGN spectrum with their intrinsic (source) spectrum, one can obtain an important information about the extragalactic background light (EBL) at the infrared energy band. Extracting the EBL structure from intrinsic and observed spectra, or alternatively, using a reasonable EBL model to excavate the emission mechanism in AGN are the hot subjects in astronomy.
Very high energy (VHE) -ray spectra have the following features. (i) The spectral energy distribution (SED) is peaked at GeV-TeV band; (ii) Radiations have strong power, thus, -rays can reach the earth trough the EBL absorption. (iii) The intrinsic spectra present a sharp broken power-law after deducting the EBL corrections from the observed spectra in a series AGN sources , which does not have any existing radiation theory to explain. (iv) Some of them have an extra hard tail at the TeV range, it even raises doubts about the Lorentz covariance. (v) Many AGN examples present the above phenomenons and it might imply a new general dynamics, which have never been recognized before.
A topic related to VHE gamma ray radiation is gamma ray burst (GRB). GRBs are extremely violent, serendipitous sources of electromagnetic radiation in the Universe. Recently, sub-TeV gamma-rays were detected from GRB 190114C by MAGIC[5] and GRB 180720B by HESS telescopes [6], respectively. This discovery caused great interest. For this sake, we will discuss it using a same GC-framework in a special section 5. We find that the SED of both these two events have a series of characteristics of the GC-signature. We also show that the VHE gamma spectra in GRB and AGN relate to a same GC-effect but in two different cosmic environments.
Organization of the article is as follows. We will briefly review the hadronic mechanism for -ray spectra in section 2, i.e., and , and show how the GC-process works in the hadronic mechanism. After a straightforward, but general derivation, we naturally give a sharp broken power-law in -ray spectra. Then a simplified calculation method for the EBL is given in section 3. We chose ten examples of -ray spectra of blazars to indicate the GC-effect in section 4. More complex hardening VHE gamma-ray spectra are explained by using the same GC-model in section 5. We discuss VHE spectra of GRB 180720B and GRB 190114C in section 6. A summary is presented in last section.
2 The GC-effect in high energy -ray spectra
The SED of blazars is assumed to be dominated by the emission from a relativistic jet pointing close to our line of sight. The characteristic SED of blazars shows two broad non-thermal well defined continuum peaks. The first hump located between the infrared (IR) and -ray bands, whereas the second hump exhibits a maximum at the energy band. The origin of low energy peak is attributed to the synchrotron emission of relativistic electrons in the magnetic field of the jet. The productions of VHE rays have different explanations. In leptonic model high energy electrons scatter on low energy photons through inverse Compton (IC) scattering and form TeV-. Normally, these low energy photons are produced in the environment of stars due to thermal emission or due to synchrotron emission by the high energy electrons in the ambient magnetic fields (the SSC model) [e.g. 7-9]. According to hadronic model, VHE ray emissions are dominated by neutral pion decay into photons in the following cascade processes: and following [e.g. 10-12].
Using hadronic mechanism the -flux can be described as
where indexes and denote the propagating loss of gamma rays inside the source and the acceleration process of protons respectively; incorporates the kinematic factor with the flux dimension and the percentage of .
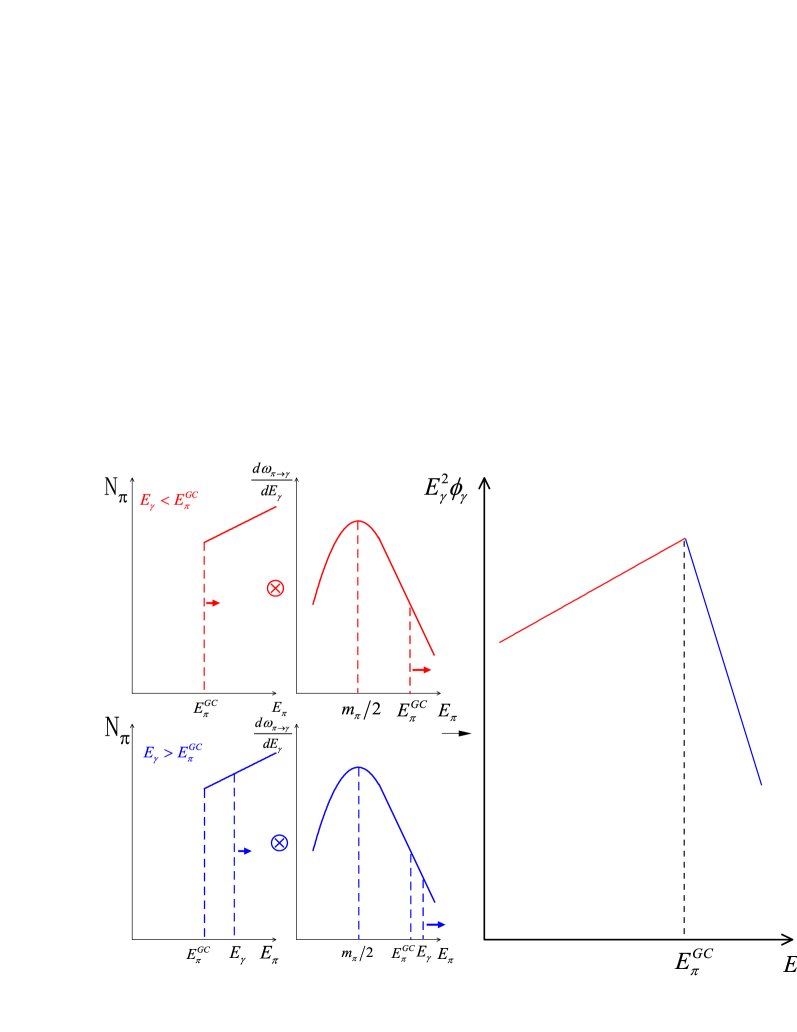
The spectrum of gamma-rays from decay in the center of mass system will have the maximum at , independent of the energy distribution of mesons and consequently of the parent protons. Usually, the distribution of is parameterized by using the cross-section , the resulting distribution presents a smooth excess near . This prediction has been proven by the -ray spectra of supernova remnants (SNRs) [13] (see figure 1). In a broad GeV-TeV region the total cross-section , while the angle-averaged total cross-section of inverse Compton scattering , . Therefore, the lepton mechanism has a stronger radiation power than the hadronic mechanism.
However, the GC-effect produces a different spectral structure in the same hadronic model. According to QCD, the number of secondary particles (they are mostly pions) at the high energy collisions relates to how much gluons participate into the multi-interactions. Pions will rapidly grow from since a lot of condensed gluons enter the interaction range. One can image that the number of pion in this case reaches its maximum value, i.e., all available kinetic energy of the collision at the center-of-mass system is almost used to create pions (see figure 2). Using general relativistic invariant and energy conservation, we straightforwardly obtain the solution in collisions using -unit [4, 14].
The parameters are
and
is inelasticity. Equation (2.2) gives the relations among , and by one-to-one, it leads to the following GC-characteristic spectrum.
Substituting them into equation (2.1), we have [4,14]
where the lower limit of the integration takes (or ) if (or if ). Equation (2.5) is a typical broken power-law, it is formed by the GC-effect in the pion distribution rather than the decay mechanism . This solution is different from all other well known radiation spectra. We regard it as the GC-character (see figure 2). Note that comparing with the hadronic model without the GC effect, the total cross section has increased by several orders of magnitude.
The value of in equation (2.5) may approximately take the value of , where zero means that the energy loss of -ray is almost negligible when it travel inside the source. The term is from the contributions of the integrated initial proton flux , where and . Usually the index in the observation on Earth. On the other hand, a more harder proton beam inside the source is possible but equation (2.5) requests that . Therefore, we take . Thus, equation (2.5) predicts that the change of spectra index on two sides of the break takes , which is measurable and irrelevant to the value of .
The GC-threshold is nuclear number -dependent: since the nonlinear corrections enhance with increasing . A rough estimation finds that the values of may distribute in a range for the collisions between heavy nuclei and collision [e.g. 15]. Generally, we will meet different values of for different -ray sources, the result relates to the dominate component of the hadron beam. While we lack a reliable theoretical prediction about them. We expect more information from the AGN observations, which may help us to establish a rule about .
The above discussion is focused on a single GC-source. The observed spectra in sky survey may origin from several GC-sources in AGN source. We will discuss them in section 5.
3 The EBL corrections to the gamma ray spectra
The EBL is the cosmic background photon field, which is mainly produced by stars and interstellar medium in galaxies throughout the cosmic history. The EBL could be directly measured with different instruments. However, the foreground zodiacal light and galactic light may introduce large uncertainties in such measurements and make it difficult to isolate the EBL contribution from the observed multi-TeV flux from distant blazars. In this sense, the determination of the intrinsic -ray spectra helps to find a correct EBL model.
We list the EBL formula, which modify the propagation of VHE -rays traveling through intergalactic space from the sources. In process , the observed -ray flux on Earth is related to the intrinsic flux of the source as refs. [16, 17].
The optical depth reads
where describes the spectral and spatial distribution of the target photon field in sky.
Because of the narrowness of the cross section , equation (3.2) can be simplified as
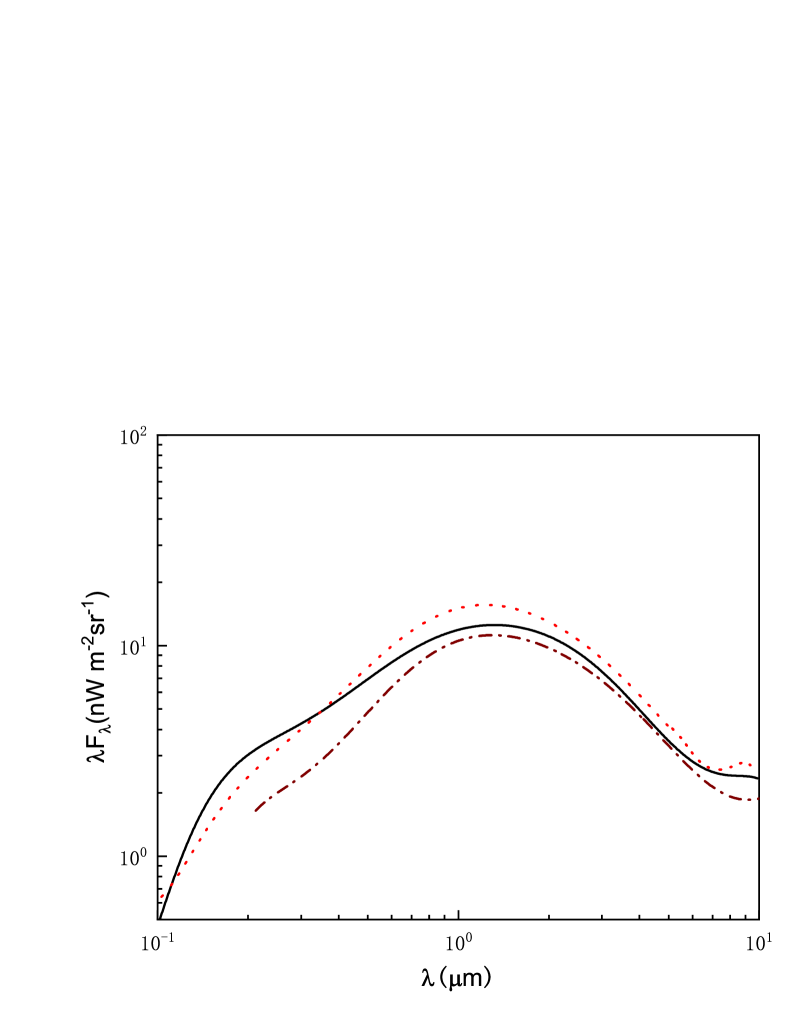
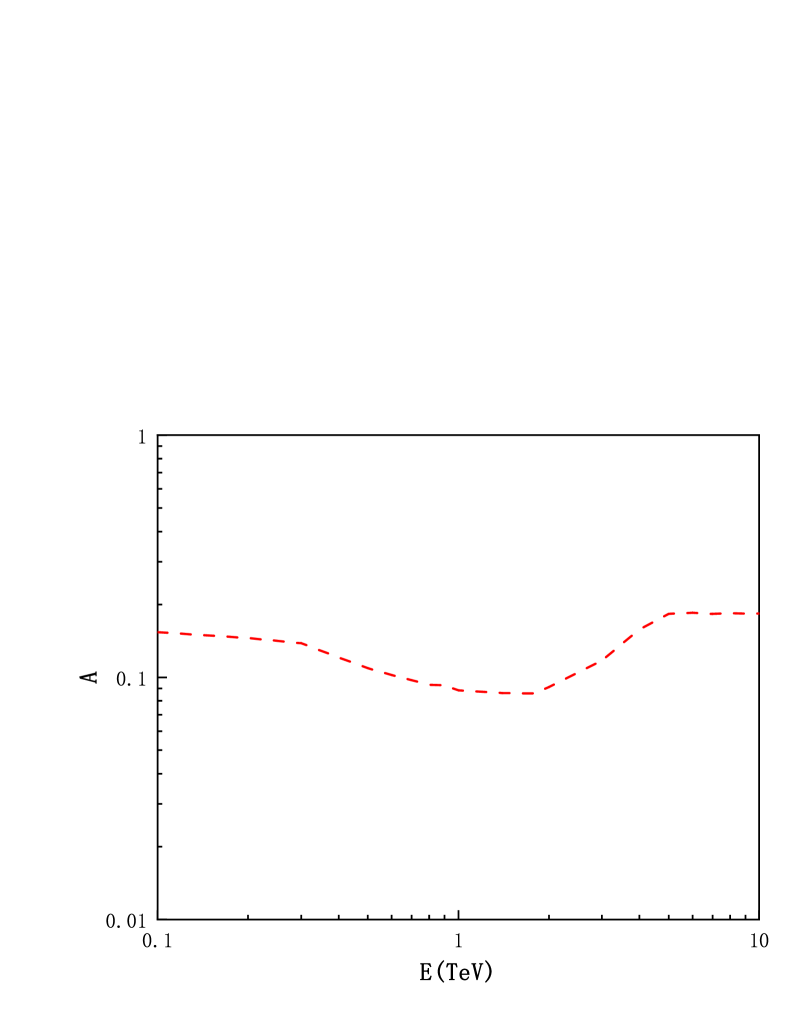
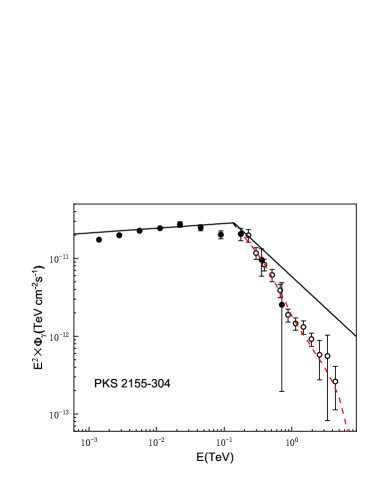
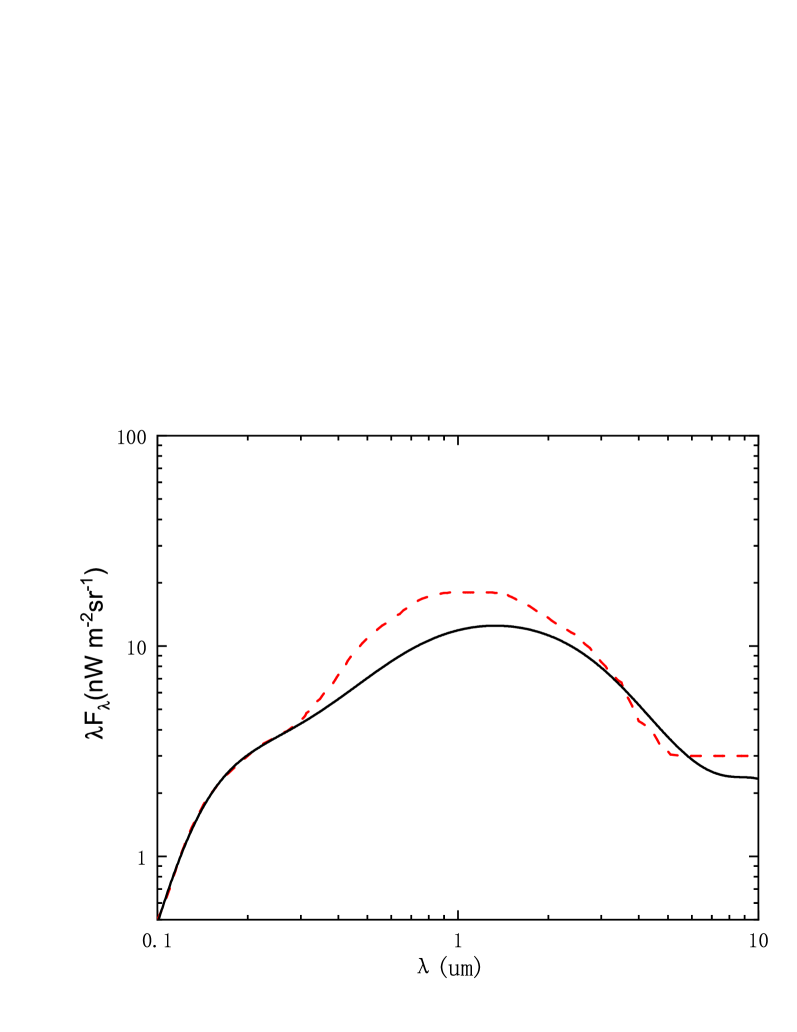
where and the Hubble constant has been included into the coefficient . Usually, is regarded as a constant. However, we find that such a rough estimation cannot extract the correct intrinsic flux. As an improvement, we take as a function of . In next section we will use the data of PKS 2155-304 blazar () to obtain a relation of (see figure 4). Assuming this relation is fixed for the sources with not too larger value , one can get a reasonable relation between and .
Usually the distributions of the EBL at near infrared have different categories. We take a distribution (see figure 3), which is proposed by [18] and it is roughly the low bound of the EBL by the estimation based on the deep-galaxy-surveys data. We call it as the lower EBL model.
4 Gamma ray spectra with single GC-source
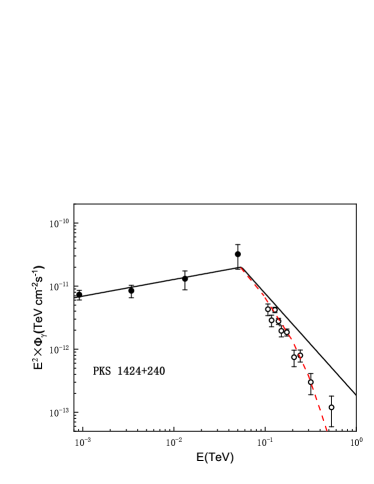
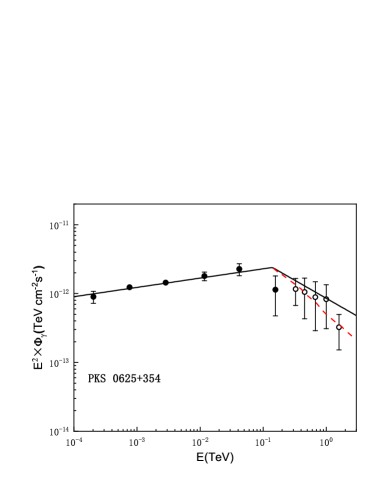
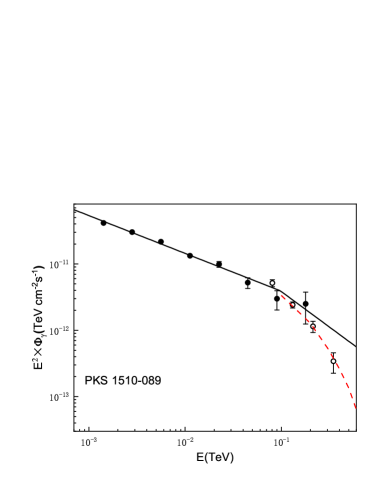
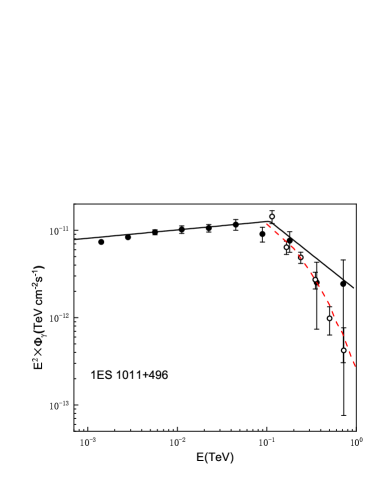
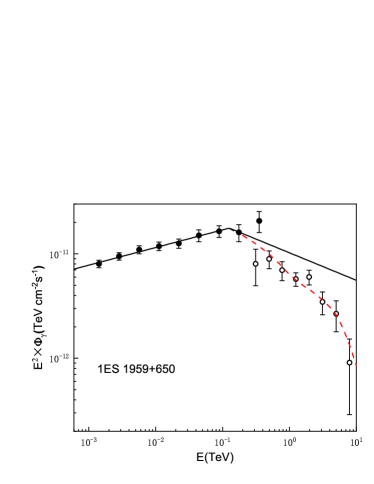
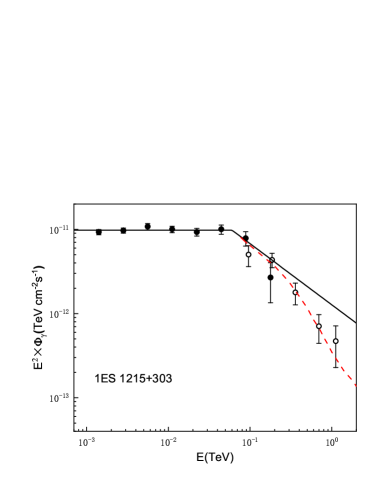
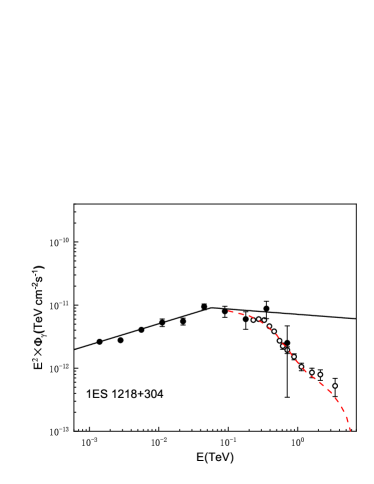
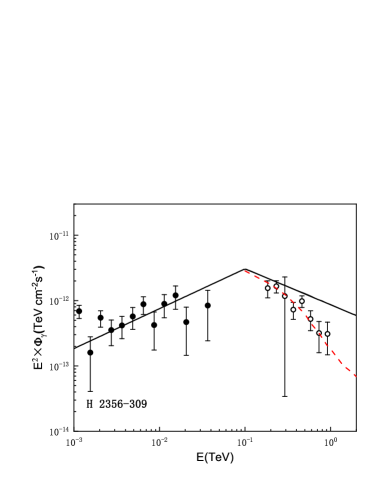
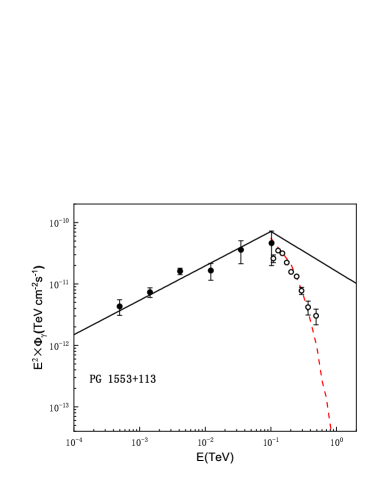
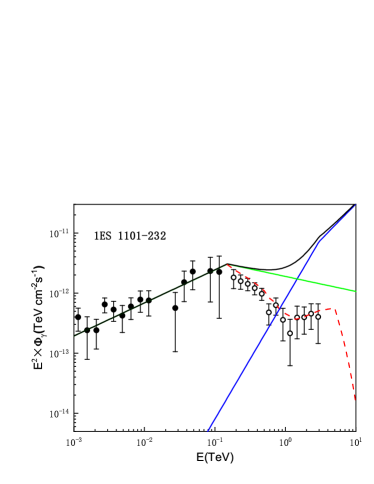
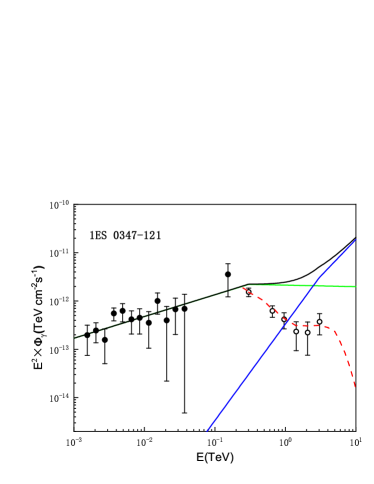
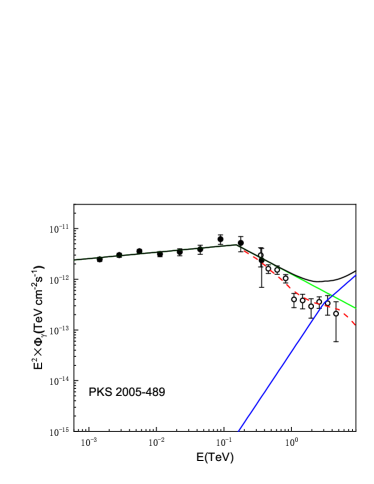
We use equation (2.5) and the lower EBL model in figure 3 to extract from the observed data. Note that a small modification in at may arise a large deformation in since the amplification of the factor in equation (3.1). Therefore, the actual approach is using a suitable distribution in equation (2.5) to fit the observed data (the dashed curves) in figure 5. Note that equation (2.5) has only four free parameters, which are much smaller than other radiation models.
Figure 5 shows the SEDs of ten blazars in the GC-model (see solid lines). They all present the sharp broken power-law. The relating parameters are listed in table 1, where and . One can see that although the EBL may change the index of the spectrum at , always shows a sharp broken power-law. The different EBL may deform , however, Korochkin, Neronov and Semikoz [21] found that the intrinsic spectra are still sharply broken after the corrections of the various EBL models. Therefore, we suppose that the GC is the dynamics of the broken power-law.
The GC-effect not only exists in blazars, but also appears in non-blazar AGNs. PKS 0625+354 has not a clear evidence for optical blazar characteristics [27], however its intrinsic -ray spectrum in figure 5 still presents a broken power-law.
Blazars are known for their variability on a wide range of timescales. Most studies of TeV gamma-ray blazars focus on short timescales. The observations of the blazar 1ES 1215+303 from 2008-2017 are investigated by a combining Fermi-LAT and VERITAS collaborations [28]. The results show that the parameters of the observed spectra change in a narrow range, and a sharp broken power-law is still kept.
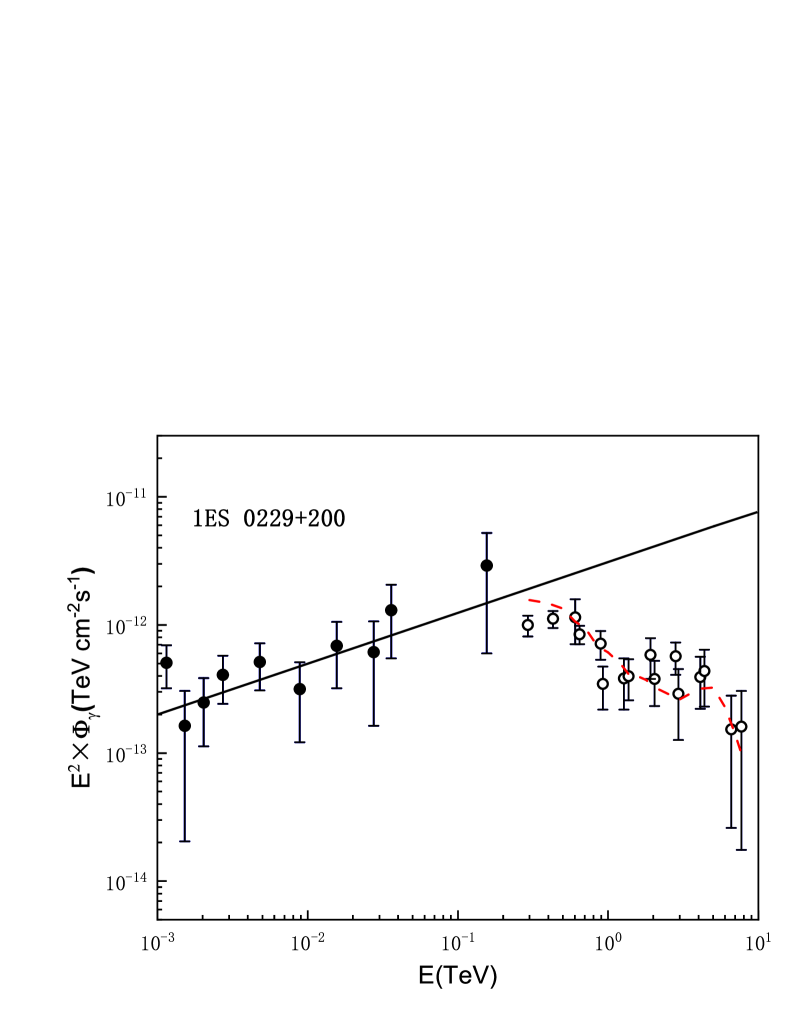
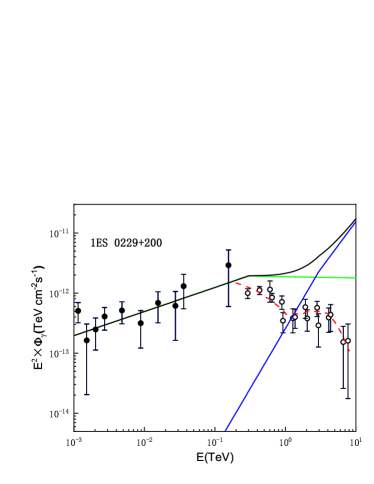
The intrinsic -ray spectra will have different forms if different EBL models are used for an observed spectrum. PKS 2155-304 and 1ES 1218+304 are located at redshifts and , respectively. Some authors expect that they have the unusually hard and unbreakable intrinsic spectra due to a strong EBL absorption [25,29]. We take 1ES 0229+200 as an example. A stronger EBL model with an additional narrow Gaussian component (dashed curve in figure 6) may fit the data (see figure 7). However, similar TeV spectra of PKS 0625+354, 1ES 1959+650 and 1ES 1218+304 in figure 5 will deviate from the theoretical predictions if the same stronger EBL model is used. In other words, different EBL distributions are needed if all broken power behaviors in AGNs are attributed to the EBL absorption. It means that the EBL would loss its universality. On the other hand, the lower EBL model uniformly describes all blazar spectra in figure 5. Thus, from the perspective of the universality of the EBL, we adopt the lower EBL model.
5 Hardening VHE gamma-ray spectra
As well known that the index of a cosmic ray spectrum at the asymptotic range decreases with increasing energy. While some of TeV-blazars present an opposite trend in their intrinsic spectra, i.e., the spectra have hard tails. To understand this interesting phenomenon, the photon to axion-like particle (ALP) conversion, and even the Lorentz invariance violation are proposed.
We have mentioned at section 2, the GC-threshold in the collision is much bigger than that in the heavy nuclei collisions since the GC-critical value is nuclear mass -dependent. We can observe multi-values of if a gamma ray source contains - and - (or -) collisions. Usually we only record a single GC-source, because the observation energy range is not wide enough, or some of signals are too weak. We will show that the double-GC effect may explain the hardening tail. We give a few of hardening examples in figure 8 and table 2.
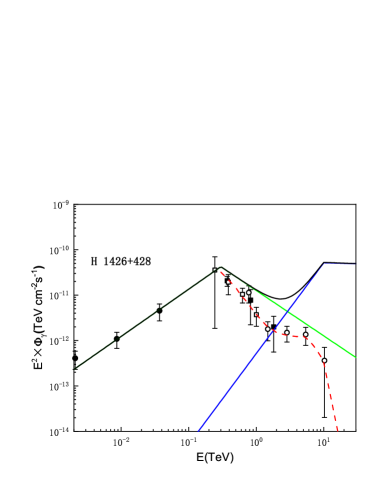
1ES 1426+428 is a TeV -ray source that has been noticed earlier. The TeV -rays from this source arrive the earth after the EBL absorption. However, the measured spectrum looks significantly different compared to the other blazar spectra since it has a bump at [36]. We use the double GC-sources to explain 1ES 1426+428 spectrum. The parameters is much smaller than that and . This result can be understood as follows: the first GC-source produced in the heavy nuclear collisions deep in the star with a smaller , the spectrum has non-zero value of , while the second GC-source produced by the light nuclear collisions with a larger at the surface of this star, where the photons go directly into the sky without passing through the polluted range, therefore, its spectrum has . One can find that superposition of the first intrinsic spectrum at (where the index ) and the second intrinsic spectrum at (where the index ) causes a hardening tail (see red dashed curve in figure 8) even considering the EBL correction.
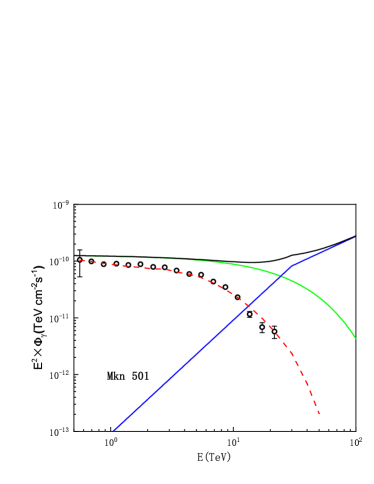
TeV blazar Markarian (Mkn) 501 is a striking star. Although its spectrum can be described, at least qualitatively, by the leptonic and normal hadronic models, it is difficult to explain a pile-up at the end of the absorption-corrected spectrum. For this sake, several extreme hypotheses have been proposed to overcome this so called ”IR-background-TeV gamma ray crisis”. We try to answer this question. We consider that the leptonic mechanism dominates the spectrum of Mkn 501 at , and it can be described by a curvilinear form . However, a GC-effect participated in the process at . The result is shown in figure 8, where we assume temporarily the parameters and because we lack the data at higher energy.
6 GRB 180720B and GRB 190114C
GRBs occur suddenly and unpredictably with a rate of approximately one burst per day. The durations of the GRBs are very short ranging from fractions of a second up to 100 seconds. The GRBs appear to be uniformly distributed over the whole sky. The short burst duration it is very difficult to identify a GRB event with a known object.
The generally accepted the sub-TeV emission mechanism of the GRB is the SSC mechanism synchrotron, where a synchrotron-emitting source must produce high energy radiation through up-scattering of synchrotron photons by the same electrons [37-39]. Thus, sub-TeV radiation is expected from GRB afterglows at early stage. However, several attempts to detect very high energy (VHE) () gamma-rays from GRBs were unsuccessful, resulting only in upper limits. Just recently, VHE photons were detected in GRB 180720B and GRB 190114C.
The connection between the VHE emission by IC and the low energy afterglows in synchrotron radiation does not seem inevitable, since most of the GRB events have not the VHE spectral record. we do not exclude the possibility existing a new radiation mechanism in GRB. We try to use the GC-model to understand the VHE spectra from these two GRBs.
Considering a proton- (or nuclei-) beam after being accelerated to an extremely high energy in a AGN and traveling in interstellar space. If it randomly collides with high-density matter (meteorite, small star even mini black hole), electromagnetic radiation will be generated in the short time of collision, which includes VHE gamma-rays if the collision energy beyond the GC-threshold. These are called as the short-duration bursts
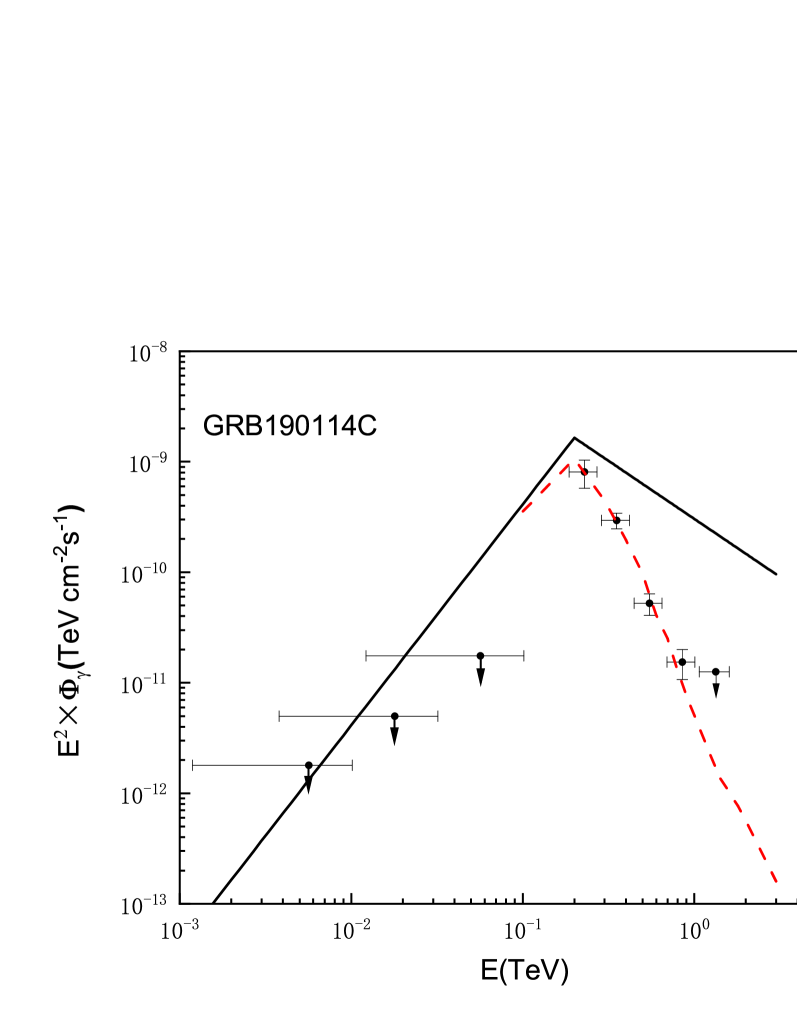
Using equation (3.1) we extract for GRB 190114C (solid curve in figure 9). According to equation (2.5) we have the parameters , and , where we consider that the energy loss of gamma-rays inside small target is negligible (i.e., ). Note that no signal from GRB 190114C was detected when . We use the result in ref. [40] to place the upper limits on its SED (see horizontal bars with downwards arrows), where the instrument resolution and a special program are considered. The result of the GC-model is acceptable.
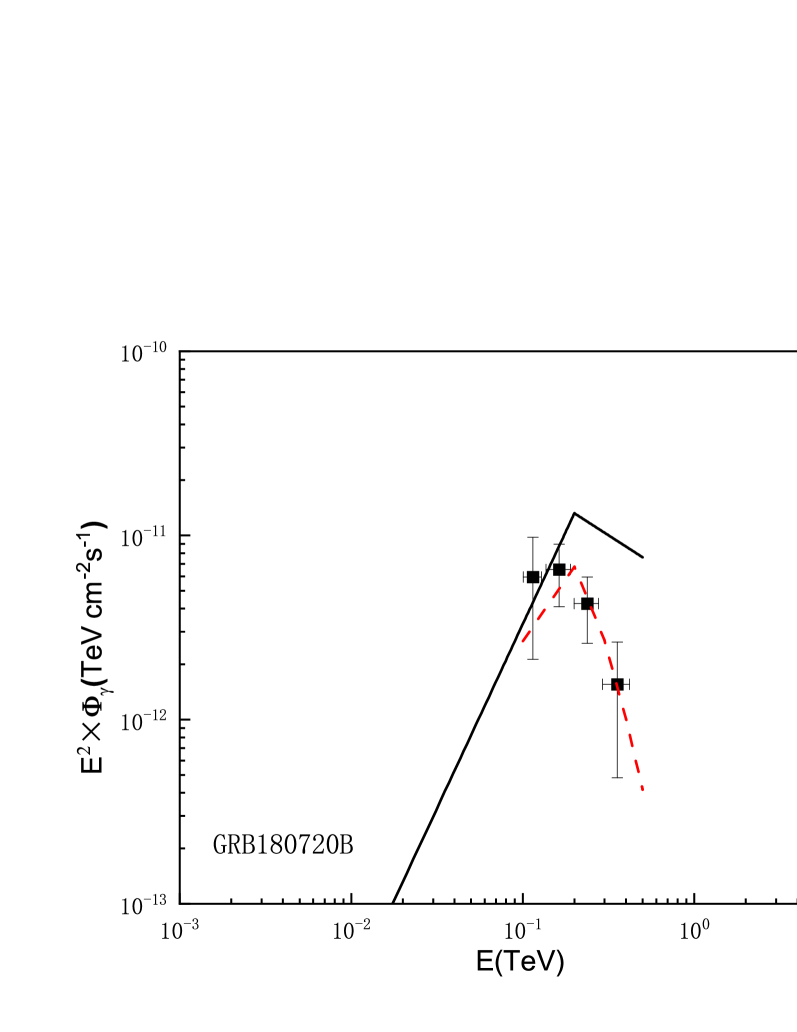
A similar VHE spectrum of RGB 180720B is given in figure 10. Note that the values for RGB 180720B and GRB 190114C are obviously larger than the maximum value of in the AGNs (see tables 1 and 2). It confirms the following fact: in the GRB-events includes the corrections due to the energy loss of the proton beam in the interstellar journey, therefore, has a larger value. Note that MAGIC used a higher EBL model to get a hard spectrum for GRB 190114C [5], which corresponds to .
One can find that the result of the GC model is different from the predictions of the SSC model. The former shows a typical broken power-law in a broad energy range without the cut factor. On the other hand, both the SSC and the traditional hadronic model fit the gamma ray spectra using a log-parabolic curve with a cut factor.
The suddenly increasing cross section leads to a big excess of number at the GC-threshold . This greatly improves the radiative efficiency in the conversion from kinetic energy of the accelerated protons to the radiation energy. Besides, this is exactly what the GRB-event needs.
If the VHE gamma-ray spectra of both AGN (blazar) and GRB are dominated by the GC-effect, they have a similar broken power-law. However, acceleration and collisions of the protons in the blazar occur in a same AGN-source, the observed spectra can maintain a long time, although its intensity changes over time. On the other hand, GRB may be a product of extremely fast protons hitting matter during interstellar travel. The recorded GRB spectra are random in a very short formation time. These are well known but have no satisfactory explanation yet.
7 Summary
The hadronic model and leptonic model are two major categories of theories explaining the VHE -ray spectra. The GC model is a hadronic model considering the GC-effect. As we have proven that the GC origins from a general QCD evolution dynamics, once a -ray spectrum with the GC characteristic is confirmed, a series of similar GC spectra are found to be inevitable. We collected some of typical spectra in the large amount of existing references. For example, the spectra in figures 5 and 8 are presented as the examples in a summary article [24] and we adopted them all. We find that the change of these spectra indexes before and after breaking is within the theoretical value range of the GC model. This is a strong support for the GC model and it may be the origin of the broken power law. Of cause, this does not exclude other hadronic and leptonic models. As we know that the broken power law is often used to fit the VHE -ray spectra as a mathematical parameter formula. The GC model gives this formula a deep physical significance and predictive power.
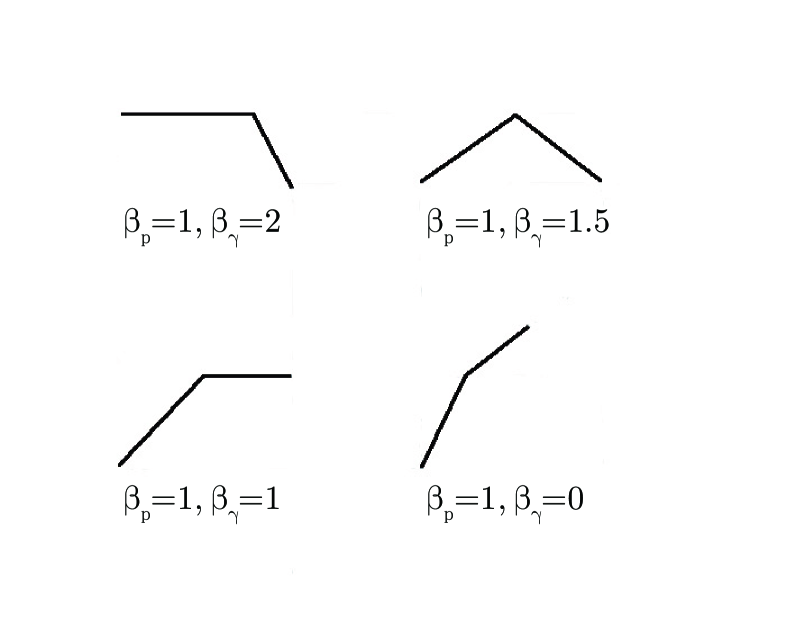
The gamma ray spectra with GC-effect has a typical broken power form, which is clearly different from the traditional hadronic model and leptonic model. Note that although the distribution turns around the break from an increase to a downward, however, the SED of almost decrease with increasing energy since both and . Besides, the slopes of the spectrum on two sides of the break are correlated by as shown in tables 1 and 2. One can find that the VHE -ray spectra have different break forms in a reasonable range of the parameters and (see figure 11). Especially, they may combine a more complex spectra in figure 8.
The application condition of the the GC model is that the initial protons have enough high energy, thus, the GC-threshold may enters the observable energy region at collision. For example, the observation of a signal at needs the incident energy about in the traditional hadronic model [17]. However, the GC effect increases the number of the pions, but it is at the cost of consuming more proton’s kinetic energy. Using equation (2.2), the protons should be accelerated beyond for producing gamma signal at . Moreover, this value is only a lower limit and it corresponds to the lower limit of integral in equation (2.5). The actual value of should be larger than by one- to two-magnitude for getting a broad integral range, i.e., . Therefore, we search the GC signal in AGNs since it is the factory of ultra-high energy protons.
Conclusions, we find that the GC is one of possible VHE gamma ray sources, which presents a typical broken power law and caused the hardening spectrum. The GC occurs at the deepest level of matter, it may relate to several seemingly unrelated cosmological phenomena. Using the GC-model we present the following features, which are mentioned in introduction. (i) The GC-threshold distributes in a broad region from to energies, which coincides with the peak range of ray distribution; (ii) The cross section rises linearly with energy rather than increases logarithmically because the GC-effect contributes all available kinetic energies to create pions. The channel with the GC-effect has a high conversion efficiency from kinetic energy to -rays; (iii) The broken power-law is a natural result of the GC-effect in VHE -ray spectra; (iv) Some of blazars spectra have an extra hard tail at the TeV range, which can be explained by the contributions of second GC-source; (v) We present a new dynamic in AGNs, although it has never been recognized before, but it can be reasoned in QCD; (vi) In particularly, we expose the GC-effect in the VHE gamma energy spectra of GRBs. A series of characteristics of the spectra predicted by the GC model are consistent with the observed results of GRB 180720B and GRB 190114C. Thus, the GC-effect opens a new window to understand the anomalous phenomena in cosmic ray energy spectra.
Acknowledgments: This work is supported by the National
Natural Science of China (No.11851303).
References
- [1] W. Zhu, Z.Q. Shen and J.H. Ruan, Chin, Phys. Lett. (2008) 3605 [arXiv:0809.0609].
- [2] W. Zhu, Z.Q. Shen and J.H. Ruan, Nucl. Phys. (2016) 1 [arXiv:1603.04158].
- [3] W. Zhu and J.S. Lan, Nucl. Phys. (2017) 647 [arXiv:1702.02249].
- [4] W. Zhu, P. Liu, J.H. Ruan and F. Wang, Astrophys. J. (2020) 127 [arXiv:1912.12842].
- [5] V. A. Acciari, S. Ansoldi, L. A. Antonelli, A. Arbet Engels, D. Baack6, A. Babi et al., (MAGIC Collaboration), Nature (2019) 455 [arXiv:2006.07249].
- [6] H. Abdalla, R. Adam, F. Aharonian F. Ait Benkhali, E. O. Angüner, M. Arakawa et al., Nature (2019) 464 [arXiv:1911.08961].
- [7] L. Maraschi, G. Ghisellini and A. Celotti, Astrophys. J. (1992) L5, doi:10.1086/186531.
- [8] C. Dermer and R. Schleickeiser, Astrophys. J. (1993) 458, doi:10.1086/173251.
- [9] M. Sikora, M.C. Begelman and M.J. Rees, Astrophys. J. (1994) 153, doi:10.1086/173633.
- [10] K. Mannheim and P.L. Biermann, A&A (1992) L21.
- [11] F. Aharonian, New Astron (2000) 377 [arXiv:0003159].
- [12] A. Mücke and R.J. Protheroe, Astropart. Phys. (2001) 121 [arXiv:0004052].
- [13] M. Ackermann, M. Ajello, A. Allafort, L. Baldini, J. Ballet, G. Barbiellini et al., Science (2013) 807 [arXiv:1302.3307].
- [14] L. Feng, J.H. Ruan, F. Wang and W. Zhu, Astrophys. J. (2018) 2 [arXiv:1805.10618].
- [15] W. Zhu, J.S. Lan and J.H. Ruan, Int. J. Mod. Phys. E. (2018) 1850073 [arXiv:1709.03897].
- [16] R.J. Gould and G.P. Schreder, Phys. Rev. (1966) 252 doi:10.1103.
- [17] F.A. Aharonian, Very high energy cosmic gamma radiation, World Scientific Co. Pre.Ltb (2004).
- [18] R.C. Gilmore, R.S. Somerville, J.R. Primack and A. Dominguez, Mon. Not Roy. Astron. Soc. (2012) 3189 [arXiv:1104.0671].
- [19] A.A. Korochkin and G.I. Rubtsov, MNRAS (2018) 557 [arXiv:1712.06579].
- [20] A. Franceschini and G. Rodighiero, A&A, (2017) A34 [arXiv:1705.10256].
- [21] A. Korochkin1, A. Neronov1 and D. Semikoz, JCAP (2019) 064 [arXiv:1911.13291].
- [22] M. Ceruti, W. Benhow, X. Chen, J. P. Dumm, L. F. Fortson and K. Shahinyan, A&A, (2017) 606 [arXiv:1707.00804].
- [23] S. Abdollahi, et al., (The Fermi-LAT Collaboration), Science (2018) 1031 [arXiv:1812.01031].
- [24] M. Ackermann, M. Ajello, L. Baldin, J. Ballet, G. Barbiellini et al., Astrophys. J. Supplement Series (2018) 32 [arXiv:1804.08035].
- [25] D. Zaborov, A. M. Taylor, D. A. Sanchez, J.-P. Lenain, C. Romoli et al., (H. E. S. S. Collaboration), AIP Conference Proceedings 1792, 050017 (2017) arXiv:1612.05111].
- [26] S. Sahu, A.R. de Leon and S. Nagataki, Eur.Phys. J. (2018) 484 [arXiv:1801.04423].
- [27] N. Sahakyan, V. Baghmanyan and D. Zargaryan, A&A (2018) A6 [arXiv:1801.09381].
- [28] J. Valverde, D. Horan, D. Bernard, S. Fegan, A. Brill and R. Brose, (Fermi-LAT Collaboration), Astrophys. J. (2020) 170 [arXiv:2002.04119].
- [29] K.K. Singh, K K Yadav and A.K. Tickoo, R.C. Rannot, P. Chandra, N.K. Agarwal et al., New Astronomy (2014) 1 [arXiv:1410.2369].
- [30] F. Tavecchio, P. Romano, P.M. Landoni and S. Vercellone, MNRAS (2018) 1802 [arXiv:1810.07493].
- [31] E.V. Khalikov and T.A. Dzhatdoev, [arXiv:1912.10570].
- [32] A. Korochkin, A. Neronov1 and D. Semikoz, JCAP (2020) 064 [arXiv:1911.13291].
- [33] K.K. Yadav, R.C. Rannot, P. Chandra, A. K. Tickoo1, S. Thoudam, K. Venugopal et al., J. Phys. (2009) 085201 [arXiv:1911.13291].
- [34] E. Prandini, C. Arcaro, V.F. Ramazani, K. Asano, G. Bonnoli, M. Cerruti, F. D’Ammando, L. Foffano and F. Tavecchio for the MAGIC Collaborationy, [arXiv:1908.10800].
- [35] D. Horns, L. Maccione and M. Meyer, A. Mirizzi, D. Montanino and M. Roncadelli, Phys. Rev. (2012) 075024 [arXiv:1207.0776].
- [36] G. Galanti, F. Tavecchio and M. Landoni, MNRAS (2020) 5268 [arXiv:1911.09056].
- [37] Y.Z. Fan and T. Piran, Frontiers of Physics in China, [arXiv:0805.2221].
- [38] S. Inoue, J. Granot, P.T. O’Brien, K. Asano, A. Bouvier, A. Carosi et al., Astropart. Phys. (2013) 252 [arXiv:1301.3014].
- [39] L. Nava, Int. J. Mod. Phys. (2018) 1842003 [arXiv:1804.01524].
- [40] T.A. Dzhatdoev, E.I. Podlesnyi and E.I. Vaiman, [arXiv:2002.06918].
- [41] H. Abdalla, A. Abramowski, F. Aharonian, F. Ait Benkhali, A. G. Akhperjanian, T. Andersson et al., (H.E.S.S. Collaboration), MNRAS (2018) 4187 [arXiv:1802.07611].
- [42] V.A. Acciari, S. Ansoldi, L. A. Antonelli, A. A. Engels, D. Baack, B. Banerjee et al., (MAGIC Collaboration), MNRAS (2019) 4233 [arXiv:1904.00134].
![[Uncaptioned image]](/html/2009.01984/assets/x1.png)
![[Uncaptioned image]](/html/2009.01984/assets/x2.png)