THE RELATIVE EMISSION FROM CHROMOSPHERES AND CORONAE: DEPENDENCE ON SPECTRAL TYPE AND AGE111Based on observations made with the NASA/ESA Hubble Space Telescope obtained from the Mikulski Archive for Space Telescopes (MAST) at the Space Telescope Science Institute, which is operated by the Association of Universities for Research in Astronomy, Inc., under NASA contract NAS AR-09525.01A. These observations are associated with programs #12475, 12596, 13650, 14640, and 15071.
Abstract
Extreme-ultraviolet and X-ray emissions from stellar coronae drive mass loss from exoplanet atmospheres, and ultraviolet emission from stellar chromospheres drives photo-chemistry in exoplanet atmospheres. Comparisons of the spectral energy distributions of host stars are, therefore, essential for understanding the evolution and habitability of exoplanets. The large number of stars observed with the MUSCLES, Mega-MUSCLES, and other recent HST observing programs has provided for the first time a large sample (79 stars) of reconstructed Ly- fluxes that we compare with X-ray fluxes to identify significant patterns in the relative emission from these two atmospheric regions as a function of stellar age and effective temperature. We find that as stars age on the main sequence, the emissions from their chromospheres and coronae follow a pattern in response to the amount of magnetic heating in these atmospheric layers. A single trendline slope describes the pattern of X-ray vs. Lyman- emission for G and K dwarfs, but the different trendlines for M dwarf stars show that the Ly- fluxes of M stars are significantly smaller than warmer stars with the same X-ray flux. The X-ray and Lyman- luminosities divided by the stellar bolometric luminosities show different patterns depending on stellar age. The L(Ly-)/L(bol) ratios increase smoothly to cooler stars of all ages, but the L(X)/L(bol) ratios show different trends. For older stars, the increase in coronal emission with decreasing is much steeper than chromospheric emission. We suggest a fundamental link between atmospheric properties and trendlines relating coronal and chromospheric heating,
v
1 Introduction
Essentially all stars with convective interiors from the A7 V star Aql (Robrade & Schmitt, 2009) to the late-M and perhaps L dwarfs (Berger et al., 2010; Stelzer et al., 2012; Hawley & Johns-Krull, 2003) emit ultraviolet (91.2–300 nm, UV) and X-ray (0.1–10 nm) photons from plasmas at temperatures ranging from roughly 5,000 K to at least K. Since these plasmas are too hot to be explained by radiative/convective equilibrium in stellar photospheres, there must be an additional heat source to explain their elevated temperatures. This heat source is either the dissipation of MHD waves or direct magnetic field reconnection events called flaring, see review by Cranmer & Winebarger (2019). In analogy with the solar chromosphere and corona, stellar plasmas in the lower temperature range are called chromospheres (see review by Linsky, 2017) and plasmas in the higher temperature range are called coronae (see review by Güdel, 2004). Except for very faint stars where instrumental sensitivity limits detection, all dwarf stars with convective interiors show X-ray emission from coronae and emission lines of Mg II, Ca II, and H I Lyman- indicating the presence of plasma at chromospheric temperatures.
There are many examples of correlations of chromospheric emission (e.g., Lyman-, Ca II H and K lines, Mg II h and k lines, H) with such stellar activity indicators as age, rotation, and magnetic field strength and coverage (e.g., Wood et al., 2005; Guinan, Engle, & Durbin, 2016; Newton et al., 2017). There are also correlations of coronal properties such as X-ray emission with activity indicators (e.g., Güdel, 2004; Wood et al., 2005). These correlations generally show saturation at high activity levels and linear regressions in log-log plots with decreasing activity indicators such as age and rotation. These correlations are usually described by power-law relations of the form (corona) (chromo) , where (corona) is a coronal flux or luminosity diagnostic, usually the broad band X-ray emission, and (chromo) is the flux or luminosity of a chromospheric diagnostic, generally an emission line such as the Ca II K line (393.3 nm), Mg II k line (279.6 nm) or H I Lyman- line (121.56 nm). An example of such power-law correlations between X-ray and Mg II emission is for F and G dwarfs and for K dwarfs (Wood et al., 2005). Another example is the correlations of chromospheric Ca II K line with UV emission lines and extreme-ultraviolet (10–91 nm, EUV) flux (Youngblood et al., 2017).
The correlations have steeper slopes for activity indicators formed at higher temperatures in the stellar atmosphere. For example, in a volume-limited sample of 159 M dwarfs located within 10 pc, Stelzer et al. (2013) found that the slope of X-ray lumiosity with age is steeper than that for the luminosity in the Galaxy Evolution Explorer (GALEX) far-ultraviolet (134–178 nm, FUV) emission formed in the upper chromosphere and the GALEX near-ultraviolet (177–283 nm, NUV) emission formed in the lower chromosphere. Ribas et al. (2005) found a steeper decline of X-ray emission with age compared to chromospheric and transition region emission for solar analog stars, and Guinan, Engle, & Durbin (2016) found a steeper decline of X-ray emission compared to Ly- emission for M0-M5 V stars. For M stars, Guinan, Engle, & Durbin (2016) showed that the decay of X-ray emission with time is also faster than the decay of Lyman- radiation. These pioneering studies point to a trend of decreasing stellar activity that results from the decay of magnetic fields with decreasing rotation rate. The age dependence of decreasing activity depends on stellar mass with the decay time scale of order 100 Myr for F–K dwarfs and increasing to several Gyr for late-M dwarfs (Reiners & Mohanty, 2012).
Flux-flux diagrams, which plot one emission feature, such as X-rays vs. another emission feature such as UV emission or Ca II emission, are useful tools for studying the spectral energy distributions of radiation seen by exoplanets. Stelzer et al. (2013) found that in plots of X-ray luminosity vs. luminosity in the GALEX FUV and NUV bands, M dwarfs with weak emission follow the same trendline as active M dwarfs over three orders of magnitude in X-ray luminosity. Walkowicz & Hawley (2009) showed that the X-ray flux and Ca II emission follow a similar trendline for M3 V stars.
Oranje (1986); Schrijver & Rutten (1987) and Rutten et al. (1989) observed chromospheric emission in the Mg II lines with the International Ultraviolet Explorer (IUE) satellite and Ca II emission from ground-based observatories together with X-ray emission observed by the European X-ray Observatory Satellite (EXOSAT) for main sequence stars. They found that M dwarfs deviate from the chromosphere-coronal flux-flux correlation (here called trendlines) seen in the warmer stars in the sense that the chromospheric emission is systematically weak compared to coronal emission and that this weakness becomes more pronounced for the coolest and least active stars.
Increasing interest in the environments and habitability of exoplanets of M dwarfs (Shields, Ballard, & Asher, 2016; Kaltenegger, 2017; Wandel, 2018) and the availability of more sensitive ultraviolet spectra with the Hubble Space Telescope (HST) and X-ray fluxes with the Röntgensatellit (ROSAT), Chandra, and XMM-Newton satellites encouraged us to re-examine the difference in the trendlines between M dwarfs and warmer stars. In particular, we explore whether there is a difference between the trendlines of warmer and cooler M dwarfs and whether stellar age and rotation set limits for these trendlines. Given that the emission from M dwarfs is variable at all wavelengths, our study benefits from the availability of near simultaneous high-resolution UV spectra of M stars obtained for some of the stars in the HST MUSCLES Treasury Survey program (France et al., 2016). We will also use UV spectra obtained with other HST programs specifically aimed at M dwarfs.
This paper will explore the X-ray vs. Lyman- trendlines for M dwarfs separated into spectral type and age bins. X-ray emission is the primary tool for measuring the heating rates in stellar coronae, although thermal conduction, winds, and radiation in the EUV are additional sinks for coronal heating. The Lyman- emission line is by far the brightest feature emitted by chromospheres of G-type stars and represents at least half of the total emission in the ultraviolet spectra of M dwarfs (France et al., 2012). Claire et al. (2012) estimated that Ly- photons represented about 40% of all solar photons at nm throughout the Sun’s history. Compared to other chromospheric emission lines formed at temperatures less than 10,000 K, the power-law index in the relation log F(Ly-) = a log F(line) + b is close to unity: for the Mg II k line (Youngblood et al., 2016) and for the Ca II K line (Youngblood et al., 2017). Thus the flux in the Ly- line is a good but not perfect proxy for the total emission from a stellar chromosphere at temperatures less than about 15,000 K. In our comparison of coronal and chromospheric emission from stars between spectral types F and late-M, we will use X-ray emission as a diagnostic of coronal emission and Lyman- fluxes reconstructed to remove interstellar absorption as a diagnostic for chromospheric emission.
In Section 2, we list the available reconstructed Lyman- and X-ray data and the origins of these data. Section 3 describes the different trendlines for the warmer stars compared to the M dwarfs, and in Section 4 we compare L(X)/L(bol) with L(Ly)/L(bol) as functions of stellar effective temperature and age. We then consider possible explanations for the different trendline slopes in Section 5, and summarize our conclusions in Section 6.
2 Lyman- and X-ray fluxes for F-M dwarf stars
We include in this study all dwarf stars with spectral types later than mid-F for which there are both reconstructed Lyman- and broad band X-ray fluxes. A major source of these data is the paper by Linsky, France, & Ayres (2013) that gives Lyman- and X-ray fluxes for five F stars, 18 G stars, 16 K stars, and 8 M stars. The coolest M dwarf in this list is Proxima Centauri (M5.5 V). The Lyman- fluxes were reconstructed either by correcting for the observed interstellar H I Lyman- absorption along the lines of sight to the stars (Wood et al., 2005), or by simultaneously solving for the intrinsic line profile and the interstellar absorption (France et al., 2012; Youngblood et al., 2016; Wilson et al., 2020). The observations and their data sources are listed in Table 1. The Lyman- and X-ray fluxes (erg cm-2 s-1) are listed at a standard distance of 1 au. The stellar effective temperatures and ages are primarily from Schneider et al. (2019) and Melbourne et al. (2020). The bolometric luminosities are computed from the effective temperatures, stellar radii, and GAIA parallaxes cited in these papers. For many of the stars these quantities are from Youngblood (in prep.). In addition to the Ly- and X-ray fluxes cited in the Linsky, France, & Ayres (2013) paper, we include new data from the following sources:
- MUSCLES Treasury Survey
-
The Measurements of the Ultraviolet Spectral Characteristics of Low-mass Exoplanetary Systems (MUSCLES) Treasury Survey (France et al., 2016; Youngblood et al., 2016; Loyd et al., 2016) observed seven low activity M dwarfs and 4 K dwarfs together with coordinated X-ray and ground-based observations. We include in Table 1 the reconstructed Lyman- fluxes (Youngblood et al., 2016) and coordinated X-ray fluxes corrected for interstellar absorption (Loyd et al., 2016). The MUSCLES fluxes for the stars GJ 667C, GJ 832, GJ 876, GJ 581, and GJ 436 are listed in Table 1 instead of the values listed in the previous Linsky, France, & Ayres (2013) paper. Proxima Centauri was not part of the MUSCLES survey, but the fluxes for the 2017 HST and Chandra observations of the star are included in the MUSCLES Team webpage.
- Mega-MUSCLES Program
-
Continuing from the MUSCLES program, the Mega-MUSCLES program (Froning et al., 2019; Wilson et al., 2020) observed 13 more active M dwarfs with HST (program GO-15071) with coordinated Chandra, XMM-Newton and ground-based observations. Youngblood et al. (2020) have reconstructed the Lyman- fluxes for these stars using the technique described in Youngblood et al. (2016). Brown et al. (in prep) have analyzed the Chandra ACIS-S S3 CCD spectra of five of these stars: GJ 15A, GJ 163, GJ 849, LHS 2686, and GJ 699 (Barnard’s star). The fluxes listed in Table 1 are mean values, except that a flare on GJ 799 was deleted to provide the quiescent emission level. The Chandra observation of GJ 15A was simultaneous with the HST observation.
One of the Mega-MUSCLES targets, the M7.5 V star TRAPPIST-1 has a previous reconstructed Lyman- flux (Bourrier et al., 2017) and X-ray flux (Wheatley et al., 2017). We use the new Mega-MUSCLES fluxes (Wilson et al., 2020) because the HST and XMM-Newton observations are nearly simultaneous and thus can be reliably intercompared. To obtain a rough estimate of the uncertainty in the Lyman- flux of a late-M dwarf like TRAPPIST-1, one should consider both possible errors in the reconstruction technique and stellar variability. Bourrier et al. (2017) obtained a reconstructed Lyman- flux of erg cm-2 s-1 from their 2016 STIS data, but using a different reconstruction technique Wilson et al. (2020) obtained when analyzing the same data. The analysis of the 2018 Ly- STIS spectra by Wilson et al. (2020) resulted in a reconstructed flux of in the same units. The uncertainty in the X-ray flux of TRAPPIST-1 is primarily due to stellar variability. Wheatley et al. (2017) obtained an X-ray flux of erg cm-2 s-1 from their 2014 XMM-Newton EPIC observation, while Wilson et al. (2020) obtained from their 2018 EPIC observation.
- High radial velocity stars program
-
We include the reconstructed Lyman- line fluxes for Kapteyn’s star (Guinan, Engle, & Durbin, 2016; Youngblood et al., 2016) and the reconstructed Lyman- fluxes for two high-radial velocity stars with spectral types G8 V to M4 V observed by Youngblood et al. (in prep.) obtained with HST program GO-15190. We also include the high radial velocity stars Ross 825 and Ross 1044 analyzed by Schneider et al. (2019).
- Winds of M dwarf stars program
-
We include the reconstructed Lyman- and X-ray fluxes of nine nearby M dwarf stars observed by Wood et al. (in prep.) with HST program GO-15326. These stars were observed primarily to measure their winds using the Lyman- line.
- FUMES targets
-
The Far-Ultraviolet M-dwarf Evolution Survey (FUMES) (Pineda et al. in prep.) observed ten M0 V to M5 V stars. We have included the two stars with STIS E-140M moderate resolution spectra and three of the eight stars with STIS G-140L low resolution spectra. Youngblood et al. (in prep.) reconstructed the Lyman- lines of these five stars with cited measurement uncertainties less than 25%.
- Individual targets
-
We also include in Table 1 the reconstructed Lyman- line fluxes of the stars: HD 28568 (Schneider et al., 2019), Men (Garcia Munoz et al., 2020), Kepler-444 (Bourrier et al., 2017), Kapteyn’s star (Guinan, Engle, & Durbin, 2016), GJ 3470 (Bourrier et al., 2018), GJ 821 and GJ 213 (Youngblood et al., 2017), GJ 1132 (Waalkes et al., 2019), and TRAPPIST-1 (Wheatley et al., 2017; Bourrier et al., 2017).
2.1 X-ray Fluxes
The X-ray fluxes cited in Table 1 were observed by instruments on XMM-Newton, Chandra, and ROSAT. Fluxes are given for the 0.2–12 keV (0.1–6 nm) band. For the MUSCLES and Mega-MUSCLES surveys, some of the X-ray observations were obtained on the same day or adjacent days as the Ly- observations, but most of the X-ray observations in Table 1 were obtained at random times uncorrelated with the Ly- observations. We have identified two stars in the MUSCLES program where all of the X-ray and Ly- observations were obtained within the same day. In the subsequent figures, these two M dwarfs (GJ 667C and GJ 176) are identified with circuled symbols.
A major source of X-ray fluxes is from the on-line XMM Serendipitous Source Catalog222https://heasarc.gsfc.nasa.gov/W3Browse/xmm-newton/xmmssc.html. The fourth generation catalog (4XMM-DR9), which is a complete re-reduction of all data obtained by XMM-Newton until March 2019, contains the mean fluxes from pointed observations, which may be many pointings for a given star. Another source of X-ray data is the XMM-Newton Slew Source Catalog XMMSL2333https://www.cosmos.esa.int/web/xmm-newton/xmmsl2-ug. A description of the first slew catalog is in Saxton et al. (2008). From sources in both catalogs, we selected data with the smallest error bars.
3 Stellar Flux-Flux Trendlines
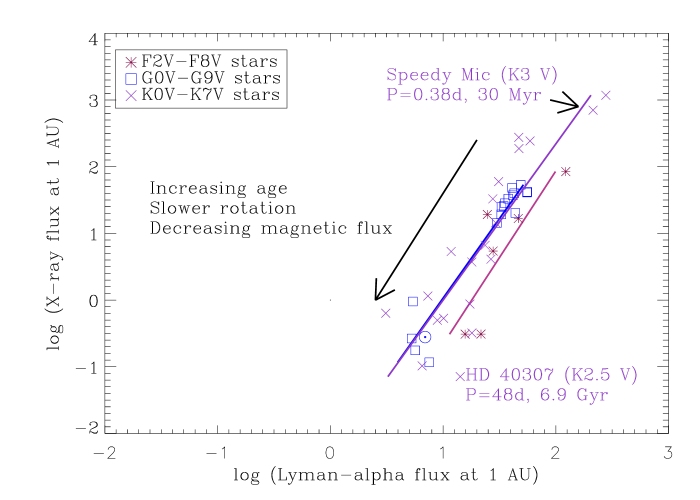
Figure 1 plots the reconstructed Lyman- and X-ray fluxes listed in Table 1 for the F, G, and K stars. X-ray and Lyman- fluxes at the standard distance of 1 au are plotted with different symbols and colors for each spectral class. The least-squares linear fits to the data sets of the F, G and K stars all have the same slopes, and the trendlines for the G and K stars overlap. We note that the most active single star Speedy Mic (K3 V) lies at the top of the K star trendline next to the spectroscopic binary V471 Tau (K2 V + WD), and that the least active K star as measured by the weakest X-ray flux, HD 40307 (K2.5 V), lies below the K star trendline. In this and subsequent figures, we do not plot measurement errors because a prime source of error is stellar activity, which is different for the UV and X-ray data typically obtained at different times especially for cooler stars.
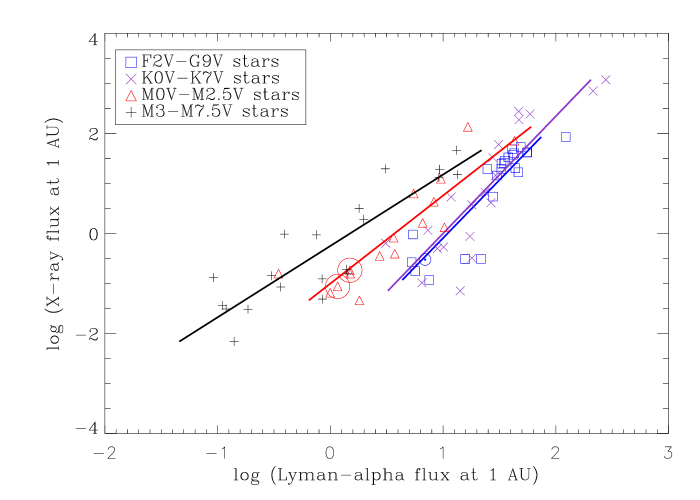
Figure 2 shows the same data as Figure 1 but includes the M dwarfs divided into M0 V – M2.5 V, and M3 V – M7.5 V groups. The early-M star with the weakest Lyman- flux is the subdwarf Kapteyn’s star (M1 VI). It’s weak Lyman- emission may result from the star’s low metallicity and thus low electron density at chromospheric temperatures.
We plot linear least-squares fits to the data for each spectral type group. The fits to the F2–G9 and K stars are similar with equal to , and , respectively. These values are similar to the ones reported by Wood et al. (2005): for the F-G dwarfs and for the K dwarfs, as would be expected since there are many stars in common among the two data sets. A single least squares fit with would fit all of the G and K stars including the Sun observed at low activity.
The M stars, however, show different trendlines than the F, G, and K stars. The M0 V – M2.5 V stars show a shallower slope (). The two early-M dwarfs with X-ray and Ly- data obtained on the same day (GJ 644C and GJ 176) are on the trendline established by stars with mostly non-contemporaneous data. The most active of the early-M stars, the young stars AU Mic (M0 V) and HIP 23309 (M0 V), are at the top of the early-M dwarf and the F-G star trendlines. The least active stars, GJ 667C (M1.5 V) and GJ 176 (M2.5 V), have Lyman- fluxes a factor of 10 times weaker than the least active G and K stars with similar X-ray fluxes.
The M3–M7.5 group also shows a shallow slope () with the more active of these late-M stars having Lyman- fluxes a factor of 4 times lower than the G and K stars with similar X-ray fluxes. The least active of the M3–M7.5 dwarf stars (GJ 581 and GJ 436) have a factor of 10 times weaker Lyman- flux than the G and K stars with similar X-ray fluxes. The coolest M dwarf in our list, TRAPPIST-1 (M7.5 V), has a factor of 150 times lower Lyman- flux than the G and K stars with similar X-ray fluxes. Figure 2 shows this pattern of decreasing chromospheric emission compared to coronal emission for the increasingly cool and less active M dwarf stars.
The most active stars lie near the top of each trendline and the least active stars lie near the bottom. For example, the two young stars near the top of the G star trendline, HR 6748 (age Myr) and V993 Tau (age Myr), have rotation periods of 5.9 and 4.65 days, respectively, whereas the old stars with the lowest X-ray fluxes at the bottom of the G star trendline, Cen A (age Gyr) and Cet (age Gyr) have rotation periods of 28 and 34.5 days, respectively. Note that the quiet Sun (G2 V) lies near the bottom of the G star trendline close to Cen A and Cet. A star near the top of the K star trendline is Speedy Mic, a young ( Myr) rapidly rotating star with a rotational period of 0.38 days. At the bottom end of the K star trendline is the old ( Gyr) star HD 40307 with a rotation period of 48 days. For the M0 V – M2.5 V star group, AU Mic (age Myr) lies at the top of the trendline and Kapteyn’s star (age Gyr) lies at the bottom of the trendline. A similar trend is seen for the M3 V – M7.5 V star group with the active and probably young stars AD Leo and EV Lac at the top of the trendline and the Gyr star Ross 905 (GJ 436) and the Gyr star TRAPPIST-1 near the bottom of the trendline. The stellar ages are from the compilation of Schneider et al. (2019).
As stars age on the main sequence, rotate more slowly, and generate less magnetic flux, they descend the trendline for their spectral type. However, the time scale for decreasing rotation depends on stellar mass with the F–K dwarfs becoming slow rotators before the age of the Pleiades (125 Myr), and the M3–M7.5 stars remaining rapid rotators at the age of Praesepe (790 Myr) (Rebull et al., 2017). Since X-ray fluxes and Lyman- fluxes are usually not measured at the same time for a given star, part of the scatter about the trendlines is due to variable activity, which is larger for the M stars than for the warmer stars (Marino et al., 2002; Miles & Shkolnik, 2017; Loyd & France, 2014).
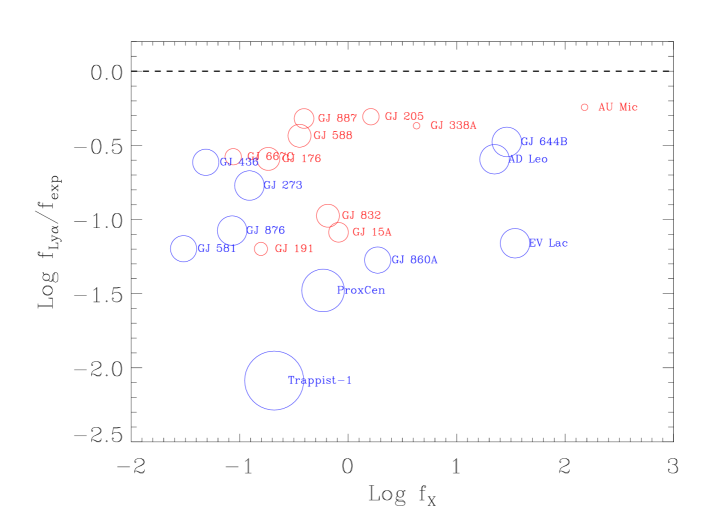
Figure 3 shows the decline of M dwarf chromospheres in a different way. The figure plots reconstructed Lyman- flux divided by the Lyman- flux ratio predicted if the M stars followed the trendline for the G stars at the same X-ray flux. The most important trend in this figure is the large decrease in Lyman- flux toward the later spectral types.
3.1 Error Analysis for the Regression Coefficients
We developed two methods for estimating the linear regression coefficients and their uncertainties for the plots of log vs log (Figure 2) and log vs log . The first method estimates the error of the regression fit by bootstraping the residuals. For the observed data , we first estimate the regression coefficients of the linear fit and calculate the fitted values . The residuals of the fit are defined as . We then built 10000 boostrap samples of the residuals . For each residual series, we computed the boostrap and then obtained the linear fit for each dataset . In this way, we obtained the mean and the standard deviation of the regression coefficients. These results are shown in Table 2.
The second method, which is not a traditional bootstrap, involves allowing both and to vary within a wide range and then solving for the regression coefficients multiple times to determine their mean values and uncertainties. We allowed all values of or to vary randomly between 0.7 and 1.3 times the observed values and all values of or to vary randomly between zero and twice the observed values. The results are very similar to those obtained by the first method.
4 Trend Lines for Luminosity divided by Bolometric Luminosity
Between the early-F and late-M dwarfs, stellar effective temperatures, radii, and bolometric luminosities change by large factors. Ratios of X-ray and Lyman- luminosities to the stellar bolometric luminosities measure the relative amounts of radiated energy from the chromosphere and corona. Table 1 lists bolometric luminosities computed from the stellar radii, effective temperatures and distances listed in Schneider et al. (2019), Melbourne et al. (2020), and Youngblood et al. (in prep.). The ratios R(Ly-)=L(Ly-)/L(bol) and R(X)=L(X)/L(bol) in Table 1 are computed from the fluxes and bolometric luminosities. The ages listed after the star names are in three catagories: young stars (Y) 0–450 Myr, middle age stars (M) 0.5–3 Gyr, and old stars (O) Gyr. We group the stars into these three groups as many stellar ages are imprecise. Most of the ages are from the compilations of Schneider et al. (2019) and Melbourne et al. (2020).
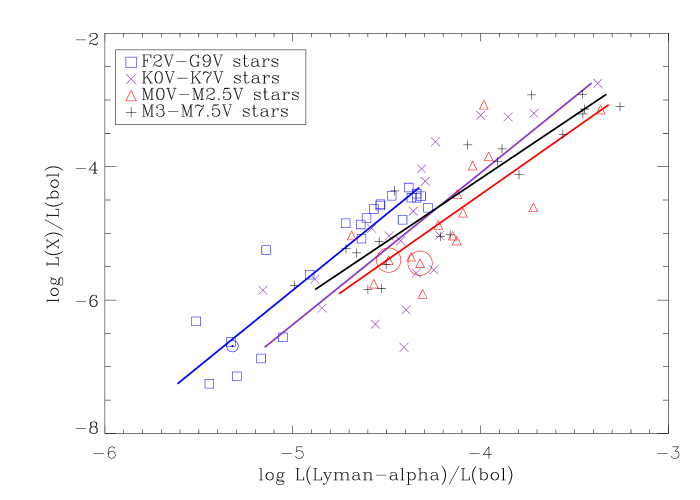
In Figure 4 we plot L(X)/L(bol) vs L(Ly-)/L(bol) for the stars grouped by spectral type. Unlike Figure 2, the stars in Figure 4 are clumped together as the small bolometric luminosities of the M stars move their luminosity ratios to the upper right in Figure 4. The regression line slopes in the luminosity ratio equation log L(X)/L(bol) = log(L(Ly)/L(bol)) + are similar to the regression line slopes for the flux-flux equation as shown in Table 2. GJ 176 is on the trendline for early-M stars, but GJ 667C. The errors in the regression coefficients were computed as described in Section 3.1. We next consider how L(X)/L(bol) and L(Ly-)/L(bol) change with stellar effective temperture () for stars with different ages..
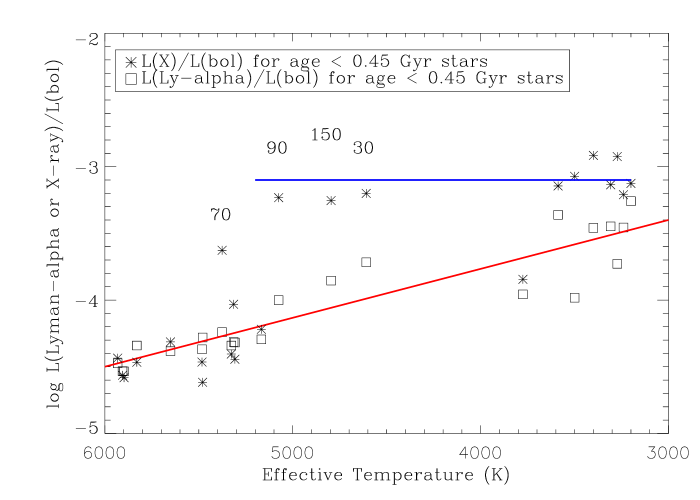
4.1 Young stars
We have identified 21 young stars with reconstructed Ly- and X-ray fluxes. The range in ages for these young stars is 0.02 Gyr (AU Mic and HIP 23309) to 0.44 Gyr (HR 6748). The boundary between young and middle aged stars is arbitrary, but separating young from middle-aged stars at 0.45 Gyr reveals a clear pattern. We include two spectroscopic binaries (V471 Tau and GJ 644B) in the young star list as tidally induced rapid rotation raises their activity levels to those of the rapidly rotating young stars (Wheatley, 1998). The distribution of data points in Figure 5 and least-squares fits to the data show two interesting trends. The L(Ly-)/L(bol) data increase smoothly from K (near spectral type G0 V) to 3,000 K (near spectral type M5 V), implying that the fraction of the stellar bolometric luminosity that heats chromospheres increases steadily to cooler stars.
The L(X)/L(bol) data behave differently than L(Ly-)/L(bol). At high temperatures, L(X)/L(bol) is roughly equal to L(Ly-)/L(bol), but beginning near 5,400 K (about spectral type G8 V), L(X)/L(bol) rises steeply to near the saturation value of . L(Ly-)/L(bol) does not reach saturation for young stars until . This behavior may result from the different ages of stars in our young star sample. There are 12 stars in Figure 5 with in the range 5167–5932 K. Eleven of these stars have ages 200–450 Myr with a mean age of 310 Myr. All of these stars have L(X)/L(bol) below . The exception is LQ Hya with age 70 Myr and K, which has L(X)/L(bol) well above . Three other somewhat cooler stars with ages 30–150 Myr have L(X)/L(bol) close to as shown in Figure 5. However, the L(Lyman-)/L(bol) for these four stars are close to the least-squares fit. We interpret these data in terms of coronal heating in G and K stars younger than about 150 Myr and cooler than about 5,200 K being enhanced relative to chromospheric heating.
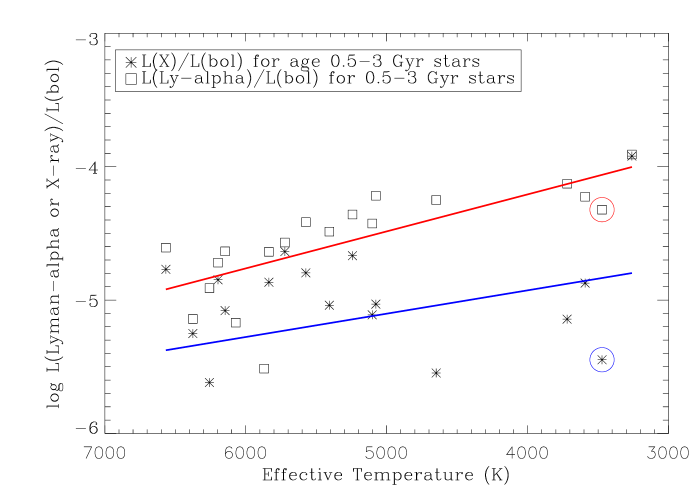
4.2 Middle age stars
For the 17 stars with middle ages, which we consider here to be 0.5 Gyr ( Eri) to 3 Gyr ( Men), the dependence on is somewhat different than the young stars. Like the young stars, L(Ly-)/L(bol) in Figure 6 also increases smoothly to lower effective tempertures. On the other hand, the L(X)/L(bol) data points are widely scattered with no apparent pattern except that they are far below saturation and well below L(Ly-)/L(bol).
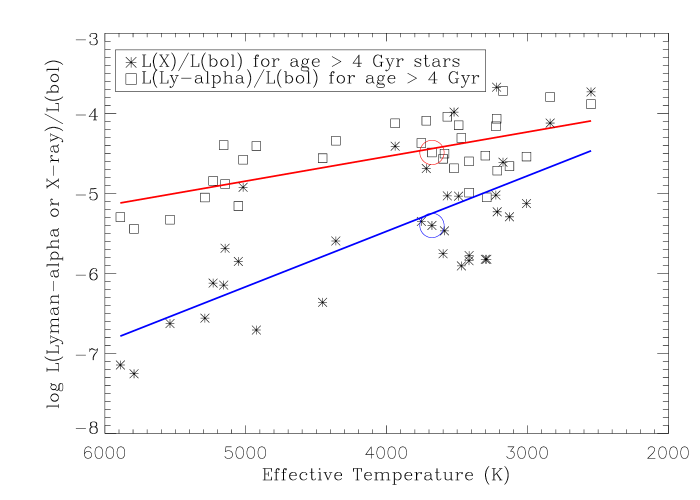
4.3 Older stars
In Figure 7 we show data for the group of 33 older stars between ages 4.0 Gyr (GJ 176) and 11.6 Gyr (Kapteyn’s star). The data for GJ 176 are on both trendlines. Similiar to the young and middle age stars, L(Ly-)/L(bol) also increases smoothly to the coolest stars in our sample. Although the L(X)/L(bol) data are scattered, they show an increasing trend to lower with a steeper slope than L(Ly-)/L(bol). The mean ratio of L(Ly-)/L(bol) to L(X)/L(bol) decreases from a factor of about 100 near K to a factor of about 3 near 3,000 K. L(X)/L(bol) and L(Ly-)/L(bol) are nearly equal for some of the coolest stars. We find that for the older stars, with decreasing , coronal emission and heating become increasingly important relative to chromospheric emission and heating.
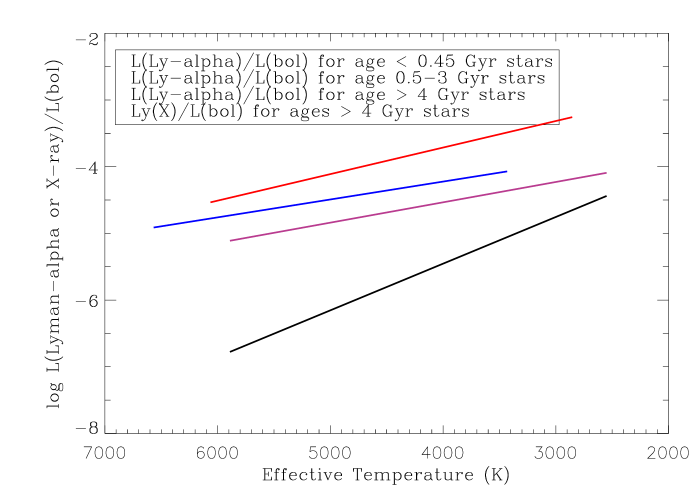
4.4 Comparison of L(Ly-)/L(bol) for stars of different age groups
Figure 8 compares the the least squares fits to the L(Ly-)/L(bol) data for the young, middle age, and older stars. These three plots are nearly parallel and show a decrease by a order of magnitude at all effective temperatures between the young and older stars. The black line in the figure is the least-squares plot of L(X)/L(bol) for the older stars showing an increased slope toward lower compared to L(Ly-)/L(bol).
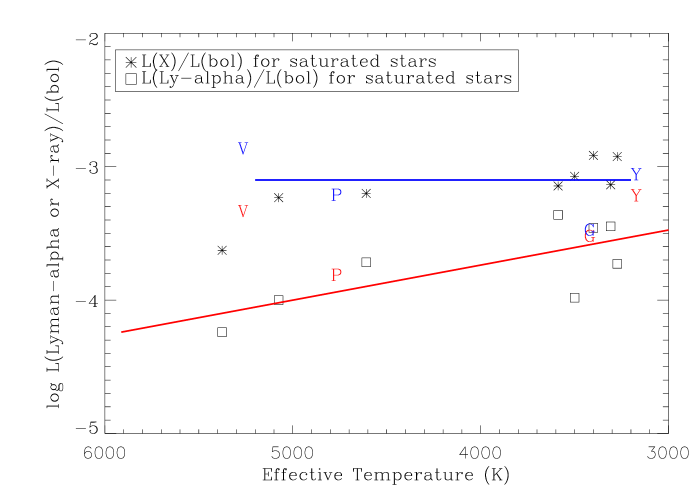
4.5 Comparison of L(Ly-/L(bol) with L(X)/L(bol) for stars with saturated X-ray emission
Young F, G, and K (FGK) stars are rapid rotators that generally show maximum X-ray emission with L(X)/L(bol) (Pizzolato et al., 2003). For early F stars, however, the maximum value for L(X)/L(bol) is about (Jackson, Davis, & Wheatley, 2012). The decrease from saturated X-ray emission occurs with decreasing rotation rate after about age 100 Myr for FGK stars but significantly later for M stars that have longer spin-down times (Newton et al., 2017). For FGK stars, saturated emission occurs when the rotation period is less than 1.3 to 3.5 days, depending on stellar mass, but the maximum rotation period for saturation is greater than about 10.8 days for M stars (Pizzolato et al., 2003). As measured by the GALEX NUV and FUV fluxes corrected for photospheric emission, chromospheric emission is also saturated until approximently 100 Myr for FGK stars but much later ages for late-M stars (Schneider & Shhkolnik, 2018; Richey-Yowell et al., 2019). GJ 871.1 (M4 IV), a young star with L(X)/L(bol) exceeding , was not included in our analysis as the observed L(X)/L(bol) ratio exceeded the saturation level by more than an order of magnitude indicating that flares occured during the observations.
Our data set provides an opportunity to explore the saturation behavior of X-ray and Lyman- emission as a function of in the same stars. We first select stars with ages less than 100 Myr. As shown in Figure 9, there are 8 stars that meet this criterion. For stars cooler than 5075 K (V368 Cep), the values of L(X)/L(bol) are close to with little dispersion, but the corresponding L(Ly-)/L(bol) values are much lower than L(X)/L(bol). This shows that when the coronal emission is saturated (or nearly so), the saturated emission level for chromospheric emission is an order of magnitude lower for early K stars () but only a factor of 3 lower for late-M dwarfs.
To check on the broader applicability of these trends, we include older stars with large L(X)/L(bol). These are shown as colored symbols in Figure 9. PW And is a K2 V star in the AB Dor moving group with an age of Myr. The values of both L(X)/L(bol) and L(Ly-)/L(bol) are consistent with the younger stars at similar . The M4 V star YZ CMi also fits these trends despite its field star age (about 5 Gy), indicating that late-M stars can also have saturated emission like the young stars. Another group of stars that could have saturated X-ray and Ly- emission are short period spectroscopic binaries that have been spun-up due to tidal interactions. There are two spectroscopic binaries in Table 1: the day period V471 Tau (K2 V + DA) binary (Hussain et al., 2006) and the day period GJ 644B (M3.5V + SB) multiple system (Mazeh et al., 2001). The two systems are only partially consistent with the trends shown by the younger stars. For V471 Tau, L(X)/L(bol) is slightly above perhaps due to X-ray emission from the hot white dwarf star, but L(Ly-)/L(bol) is far above the trend line. For GJ 644B. L(X)/L(bol) is well below , but L(Ly-)/L(bol) is on the trend line. A much larger sample of spectroscopic binaries is needed to test whether their saturation properties are similar to the Myr stars.
5 Discussion
5.1 Trends with spectral type and effective temperature
Compared to the F, G, and K stars, M dwarfs show an increasing trend of weak chromospheric emission relative to their coronal emission, as clearly shown in Figures 2 and 3. Stellar age also plays an important role in determining whether chromospheric emission becomes relatively weak or coronal emission becomes relatively strong with decreasing . Since emissions from both chromospheres and coronae decay with decreasing rotation rate and magnetic flux that occur as stars age on the main sequence, we have separated stars into three age groups: young (age Myr), middle aged (0.5–3 Gyr) and older ( Gyr). This crude age discriminant is needed to have at least 15 stars in each group for decent statistics.
The smooth increase of L(Ly-)/L(bol) with decreasing for stars in all age groups says that with decreasing an increasing fraction of the stellar luminosity heats chromospheres irrespective of stellar age. The decrease in chromospheric heating by a factor of 10 from the young to the older stars shown in Figure 8 is remarkable in that it shows that stellar effective temperature and thus bolometric luminosity are relatively unimportant parameters for understanding the relative decline of chromospheric emission with stellar age. France et al. (2018) also found that the decrease in the normalized flux for the chromospheric Si III 120.6 nm line, L(Si III)/L(bol), with rotation period is the same for F, G, K, and M stars. These two results are consistent as the increase in rotation period is correlated with stellar age.
The trend of L(X)/L(bol) with and stellar age is more complex. For the young star group, the increase in L(X)/L(bol) with decreasing effective temperature overlaps L(Ly-)/L(bol) for F and G stars ( K), but L(X)/L(bol) then rapidly rises to the saturation level () while L(Ly-)/L(bol) continues its steady increase to lower effective temperatures. This suggests that for G and K stars younger than about 150 Myr, coronal heating exceeds chromospheric heating by about an order of magnitude and this difference decreases with age. New observations are needed to test this interpretation of the relative heating of coronae and chromospheres.
For older stars there is a simple trend, L(X)/L(bol) increases far more rapidly with decreasing than does L(Ly-)/L(bol). Near =6000 K, L(Ly-)/L(bol) is 100 times larger than L(X)/L(bol), but L(Ly-)/L(bol) is only a factor of 3 times larger than L(X)/L(bol) near K. Thus for older stars there is a more rapid increase in coronal heating compared to chromospheric heating with decreasing .
The dispersion of L(X)/L(bol) about the trend lines is much larger than the dispersion of L(Ly-)/L(bol) for the middle age and older stars. In part this must be a consequence of the large variation in X-ray flux between magnetic cycle maximum and minimum. For Cen A and B, Ayres (2014) found minimum-to-maximum X-ray flux ratios of 3.4 and 4.5, respectively, as observed by the Chandra/HRC instrument with its 0.5–17.5 nm bandpass. These minimum-to-maximum contrasts are larger that what is typically seen in chromospheric lines. With its spectral bandpass limited to nm, the instruments on XMM-Newton detected a very deep minimum in the X-ray flux from Cen A in 2005. This points to the second reason for the large dispersion in the L(X)/L(bol) data for middle age and older stars. Such stars have coronae with temperatures near K (Ayres, 2014). Decreases in coronal temperature near cycle minimum cause a larger fraction of the coronal emission to be at the longer wavelengths that XMM-Newton and even Chandra cannot detect. The combination of variations in coronal heating over a cycle, changing spectral hardness compared to instrumental bandwidth, and flares conspire to produce the large scatter in L(X)/L(bol) about the trendlines.
5.2 Possible explanations for the different emissions from coronae and chromospheres
We find that the relative emission and therefore heating rates of chromospheres and coronae depend on stellar age and effective temperature very differently. What could be the contributing factors to this different behavior? We consider four important differences between M dwarfs and warmer stars that could explain the different trendline slopes and the different L(Lyman-)/L(bol) and L(X)/L(bol) trends with : (1) M stars have higher gravity and lower photospheric opacity, (2) the different effects of flares on the Ly- and X-ray emissions, (3) M stars have increased molecular formation and lower ionization in their photospheres and lower chromospheres, and (4) the absence of a radiative core structure in stars cooler than spectral type M3.5 V. We now consider each of these factors.
(1) Since decreases faster than stellar mass along the main sequence, M dwarfs have higher gravities () than solar-mass stars by a factor of 2–3. Since the pressure scale height is inversely proportional to gravity, M dwarf photospheres are more compact than for more massive stars. M dwarf photospheres are also denser than for warmer dwarf stars, because important opacities (e.g., H and H-) are smaller due to lower temperatures and decreased ionization. It appears that there may be a fundamental link between atmospheric structure and the trendlines relating heating of coronae and chromospheres. The precise nature of this link is uncertain, but one component could be that higher photospheric gas pressures increase the equipartition magnetic field strengths (), and M dwarfs usually have significantly higher magnetic field strengths than solar type stars (e.g., Reiners, 2012). We consider this to be the most interesting of the possible explanations.
(2) For three older M dwarfs, Loyd et al. (2018) found that flares contribute at least 10–40% of the quiescent FUV flux, and that during flares the Ly- flux increases by a much smaller factor than higher temperature lines and the X-ray flux. Since flares are more frequent in older M dwarfs than older G dwarfs, flaring may play a role in explaining the relative behavior of X-ray and Ly- emission with decreasing . Coronal temperatures determine the fraction of the input magnetic energy that is radiated within the XMM-Newton and Chandra bandpasses as opposed to the extreme-UV wavelengths outside of the X-ray bandpasses. The cooler coronae of older G stars like the Sun have a higher percentage of coronal emission in the EUV range than the hotter coronae of older M dwarfs. The more rapid increase in L(X)/L(bol) compared to L(Ly-)/L(bol) with decreasing could be due in part to the higher percentage of coronal emission in the Chandra and XMM-Newton bandpasses rather than in the EUV with decreasing . A quantitative assessment of this effect would be useful but is beyond the scope of this paper.
(3) M stars have lower temperatures in their photospheres and lower chromospheres compared to warmer stars, as shown for example by the temperature distributions of GJ 832 (M2 V) and the Sun in Figure 1 of Fontenla et al. (2016). Lower temperatures lock up atoms in molecules and cause reduced ionization. With decreasing photospheric temperatures, hydrogen and abundant metal atoms (e.g., C, N, and O) can be sequestered in diatomic and more complicated molecules. At these low temperatures only atoms with very low ionization potentials such as Na and K can supply free electrons needed for important opacity sources such as H-, but these atoms have very low abundances. Also, the gases in nearly neutral photospheres and lower chromospheres are poor electrical conductors, which may alter MHD wave dissipation and flare heating processes in chromospheres. The heating in stellar coronae, however, may be unaffected as hot plasma is highly ionized.
(4) A fourth possible cause for relatively weak chromospheric emission compared to coronal emission may be related to the switch from radiative cores in stars warmer than spectral type M3.5 V to fully convective interior structures of cooler stars. Interior structure models (e.g., van Saders & Pinsonneault, 2012; Baraffe & Chabrier, 2018) predict that after stars reach the main sequence, stars with masses greater than about acquire and retain radiative cores, whereas stars with lower masses remain fully convective. At dwarf stars have K and spectral type near M3.5 V. Baraffe & Chabrier (2018) found that near this critical mass, the abundances of 3He in the stellar core and envelope play important roles in nuclear reaction rates leading to a subtle change in stellar luminosity and color seen in GAIA photometry (Jao et al., 2018).
For solar-type stars, the regeneration and amplification of magnetic fields is generally described by a -type dynamo (Dobler, 2005; Cameron, Dikpati & Brandenburg, 2017). In the simplest example of a kinematic dynamo, the velocity fields are specified rather than self-consistently computed. The effect converts torroidal magnetic fields into poloidal fields, and the effect converts poloidal fields into torroidal fields. The interplay between these two processes is driven by stellar rotation and turbulence. The regeneration of magnetic fields in dynamo models is usually thought to occur mainly near the tachocline, the interface between the radiative core and convective envelope, where rotational shear and associated turbulence are a maximum. Stellar dynamos are likely far more complex than this simple model, and many problems are still inadeqately understood (Charbonneau, 2014; Brun & Browning, 2017)
Without a radiative core, a star has no tachocline and the simple kinematic type dynamo should no longer be feasible. However, fully convective cool M dwarfs do have strong magnetic fields (Reiners, 2012) indicating that magnetic heating is occuring in their chromospheres and coronae. A different type of dynamo, perhaps a -type dynamo, could operate in the convective envelopes of stars cooler than M3.5 V (Chabrier & Baraffe, 2000) and perhaps also in the warmer M stars.
5.3 Search for observational evidence of changes when stars become fully convective
While there have been many searches for changes in the X-ray, UV, and H fluxes that could result from a fundamental change in the way magnetic fields are amplified in stellar interiors, most have found no changes near spectral type M3.5 V. For example, Stelzer et al. (2013) did not find any obvious changes in the ratios of fluxes in different energy bands between early and late-M dwarfs that would indicate a change in interior structure. In their volume-limited survey of X-ray emission from K and M dwarf stars, Fleming, Schmitt, & Giampapa (1995) also found no evidence for a decrease in L(X)/L(bol) and thus coronal heating efficiency between early-M dwarfs and the fully convective late-M dwarfs. Loyd et al. (2018) found that the rate of flaring is the same for both young and old M dwarfs with no obvious spectral type dependence within the M dwarfs.
In their study of M dwarfs with masses 0.1–0.5 , Newton et al. (2017) found that there is a single relationship between L(H)/L(bol) and the Rossby number , where is the stellar rotation period and is the convective turnover time, implying no change in the magnetic dynamo across the radiative/convective core boundary. Wright & Drake (2016) showed that fully convective M dwarfs show the same behavior of L(X)/L(bol) as seen in the more massive stars and concluded that both the more massive M stars with radiative cores and the less massive fully convective stars likely have the same dynamo process, perhaps a dynamo that generates magnetic fields by helical turbulence first proposed by Durney, De Young, & Roxburgh (1993).
Are there any observations of different magnetic field properties that could identify changes in stellar interior structures? Shulyak et al. (2015) found no difference in the magnetic field distributions between partially and fully convective stars in their high resolution study of Zeeman broadening of spectral lines, and Morin et al. (2010) found that the fully convective M dwarfs have a diverse range of magnetic topologies with a tendancy for a higher degree of magnetic field organization (more flux in lower degree sperical harmonics) than the partially convective stars.
Magnetic fields in stellar coronae likely play a major role in the first ionization potential (FIP) effect in which elements with first ionization potential (FIP) less than about 10 eV are enhanced relative to elements with FIP greater than hydrogen (13.5 eV). First identified in the solar corona (e.g., von Steiger et al., 1995; Feldman & Laming, 2000; Laming, 2015), the FIP effect has also been identified in stellar coronae (e.g., Drake, Laming & Widing, 1997; Güdel et al., 2001). In their analysis of Chandra Low Energy Transmission Grating Spectrograph (LETGS) data, Wood et al. (2018) showed that the FIP effect occurs in A7 V to K5 V stars, and for stars cooler than K5 V including M dwarfs, an inverse-FIP effect occurs when the low-FIP elements have lower coronal abundances than the high-FIP elements. This change from FIP to inverse-FIP may indicate that the propagation of MHD waves through coronal magnetic loops is very different in the M stars compared to warmer stars (Wood et al., 2018). However, the change occurs near spectral type K5 ( K) not M3.5 ( K).
While we find for the older stars both L(X)/L(bol) and L(Lyman-)/L(bol) increase smoothly (with different slopes) to lower effective temperatures, we find no clear evidence for changes in either quantity near the fully convective bouldary. A much larger data set is needed to find any substantial changes near this boundary.
6 Conclusions
This paper seeks to answer two questions that are not usually asked in previous studies of dwarf stars with convective interiors. First, what is the relative amount of UV flux from stellar chromospheres and X-ray flux from stellar coronae emitted by F, G. K. and M dwarfs stars? These emissions as measured by the stellar Lyman- flux and the X-ray flux, respectively, are critically important for understanding the rate of mass loss and photochemical reactions occuring in exoplanet atmospheres. Are there patterns in the relative behavior of these two types of emission for different types of stars?
Second, we ask whether the relative amount of heating in stellar chromospheres and coronae depends upon stellar effective temperature and age? The answer to this question is important for determining which types of heating processes operate in stars. Our analysis of 79 stars observed in recent observing programs with HST and several X-ray observatories has led to the following conclusions:
-
•
For stars with similar spectral types and effective temperatures, the trendlines between chromospheric and coronal emission are described by power laws. As stars become less active with increasing age, slower rotation, and weaker magnetic fields, the relative fluxes of the chromospheric and coronal emissions both decrease following the trendline for their spectral type. We show that the trendlines for F, G, and K dwarfs are nearly identical, but the trendlines for M stars differ significantly from those of the warmer stars. In particular, the trendline slopes () for the M0–M2.5 stars () and for the M3–M7.5 stars () are smaller than for the F2–G9 V stars () and K0–K7 V stars ().
-
•
At the same X-ray flux level (normalized to a distance of 1 au), the more active M3–M7.5 stars show Lyman- emission a factor of 4 smaller than corresponding F–K stars, and for the least active late-M stars the Lyman- emission is a factor of 10 lower. The coolest star in the sample, TRAPPIST-1 (M7.5 V), emits a factor of 150 times less Lyman- flux than does the least active F–K stars with similar X-ray fluxes. The relative amounts of chromospheric and coronal emission in M stars are thus qualitatively different from the warmer stars. This difference is most extreme for the coolest star in the sample.
-
•
We call attention to a possible fundamental link between atmospheric structure and the trendlines relating heating of coronae and chromospheres. With their higher gravities and lower photospheric temperatures, M dwarf atmospheres are denser, less ionized, and have smaller pressure scale heights than warmer stars. The precise nature of the link is uncertain, but one underlying cause could be that higher photospheric gas pressures increase the equipartition magnetic field strengths (), and M dwarfs usually have significantly higher magnetic field strengths than solar type stars. The relative heating rates in chromospheres and coronae should be related to the strength and scale height of the magnetic fields in stratified atmospheres with different pressure scale heights.
-
•
The M stars show different trendlines and wider scatter about the trendlines than the warmer stars. Increased scatter is expected as even low activity M dwarfs flare more often than warmer stars and show larger UV and X-ray variability. The different trendlines for the M stars compared to the warmer stars suggest that different heating mechanisms may operate in the M stars compared to the warmer stars that distribute heat differently between their chromospheres and coronae.
-
•
We find that the fraction of a star’s bolometric luminosity that heats its chromosphere increases smoothly with decreasing for dwarf stars of all ages, but this fraction decreases a factor of 10 from the group of young stars (age Myr) to the older stars (age Gyr) at all effective temperatures.
-
•
The dependence of L(X)/L(bol) on is very different for the young and older stars. For G and K stars younger than about 150 Myr, saturated coronal heating as measured by L(X)/L(bol) is significantly larger than saturated chromospheric heating as measured by L(Lyman-)/L(bol). As stars age, both L(X)/L(bol) and L(Ly-)/L(bol) decrease from their saturation levels, and L(Ly-)/L(bol) becomes larger than L(X)/L(bol). For the older stars, L(X)/L(bol) increases far more steeply with decreasing than does L(Ly-)/L(bol). We conclude that at least for the older stars, coronal heating becomes much more important compared to chromospheric heating with decreasing .
-
•
We asked whether the decreasing ratio of Lyman- to X-ray emission in the cooler M dwarfs results from chromospheres becoming weaker or coronae becoming stronger. Plots of L(X)/L(bol) and L(Lyman-)/L(bol) with respect to stellar effective temperature show that for the younger stars chromospheric emission increases gradually with decreasing effective temperature, but the coronal emission increases dramatically to saturation levels for stars with K (spectral type K2 V). The likely explanation for this effect is that for stars younger than about 150 Myr, coronal heating is an order of magnitude larger than chromospheric heating, but this difference decays with age. For the older stars, L(X)/L(bol) increases much faster to lower than does L(Lyman-)/L(bol). We have described several possible explanations for coronal heating increasing much faster than chromospheric heating with decreasing . We conclude that the decreasing ratio of Lyman- to X-ray emission in the cooler M dwarfs results from coronal emission becoming stronger rather than chromospheric emission becoming weaker with decreasing .
-
•
We searched for observational evidence for an abrupt change in Lyman- or X-ray flux near spectral type M3.5 V ( K) where dwarf stars become fully convective. We found gradual changes in Lyman- and X-ray fluxes and luminosities devided by bolometric luminosity but no abrupt changes at or near the boundary.
-
•
Photochemistry and mass loss in exoplanet atmospheres are driven by the spectral energy distribution of the host star’s radiation. Very different evolutions of exoplanet atmospheres can result from whether the host star is an M dwarf or a warmer star. The different trendlines of M stars compared to warmer stars mean that the spectral energy distributions of M stars will evolve in different ways than warmer stars as stars age on the main sequence. This difference in the host star’s evolution will be important in assessing whether exoplanets of M stars can retain their atmospheres.
References
- Ayres (2014) Ayres, T. R. 2014, AJ, 147, 59
- Baraffe & Chabrier (2018) Baraffe, I. & Chabrier, G. 2018, A&A, 619, A177
- Berger et al. (2010) Berger, E., Basri, G., Fleming, T. A. 2010, ApJ, 709, 332
- Bourrier et al. (2017) Bourrier, V., Ehrenreich, D., Wheatley, P. J., et al. 2017, A&A, 599, L3
- Bourrier et al. (2018) Bourrier, V., Lecavelier des Etangs, A., Ehrenreich, D. 2018, A&A, 620, A147
- Brun & Browning (2017) Brun, A. S. & Browning, M. K. 2017, Living Rev. Solar Phys., 14, 4
- Cameron, Dikpati & Brandenburg (2017) Cameron, R. H., Dikpati, M., & Brandenburg, A. 2017, Space Sci. Rev., 210, 367
- Chabrier & Baraffe (2000) Chabrier, G. & Baraffe, I. 2000, ARA&A, 38, 337
- Charbonneau (2014) Charbonneau, P. 2014, ARA&A, 52, 251
- Claire et al. (2012) Claire, M. W., Sheets, J., Cohen, M. 2012, ApJ, 757, 95
- Cranmer & Winebarger (2019) Cranmer, S. R., Winebarger, A. R. 2019, ARA&A, 57, 157
- Dobler (2005) Dobler, W. 2005, Astr. Nachrichten, 326, 254
- Drake, Laming & Widing (1997) Drake, J. J., Laming, J. M., Widing, K. J. 1997, ApJ, 478, 403
- Durney, De Young, & Roxburgh (1993) Durney, B. R., De Young, D. S., & Roxburgh, I. W. 1993, Sol. Phys., 145, 207
- Feldman & Laming (2000) Feldman, U., Laming, K. G. 2000, Phys. Scripta, 61, 222
- Fleming, Schmitt, & Giampapa (1995) Fleming, T. A., Schmitt, J. H. M. M., & Giampapa, M. S. 1995, ApJ, 450, 401
- Fontenla et al. (2016) Fontenla, J., Linsky, J. L., Witbrod, J., et al. 2016, ApJ, 830, 154
- France et al. (2018) France, K., Arulanantham, N., Fossati, L., et.al. 2018, ApJS, 239, 16
- France et al. (2012) France, K., Linsky, J. L., Tian, F., Froning, C. S., & Roberge, A. 2012, ApJ, 750, L32
- France et al. (2016) France, K., Loyd, R. O. P., Youngblood, A., et al. 2016, ApJ, 820, 89
- Froning et al. (2019) Froning, C. S, Kowalski, A., France, K., et al. 2019, ApJ, 871, L26
- Garcia Munoz et al. (2020) Garcia Munoz A., Youngblood, A., Fossati, L., Gandolfi, D., Rauer,, H. 2020, ApJ, 888, L21
- Guinan, Engle, & Durbin (2016) Guinan, E. F., Engle, S. G., & Durbin, A. 2016, ApJ, 821, 81
- Güdel (2004) Güdel, M. 2004, Astron. Astrophys. Rev. 12, 71
- Güdel et al. (2001) Güdel, M., Audard, M., Briggs, K., et al. 2001, A&A, 365, L336
- Hussain et al. (2006) Hussain, G. A. J., Allende Prieto, C., Saar, S. H., Still, M. 2006, MNRAS, 367, 1699
- Jackson, Davis, & Wheatley (2012) Jackson, A. P., Davis, T. A., Wheatley, P. J. 2012, MNRAS, 422, 2024
- Jao et al. (2018) Jao, W.-C., Henry, T. J., Gies, D. R., & Hambly, N. C. 2008, ApJ, 861, L11
- Hawley & Johns-Krull (2003) Hawley, S., & Johns-Krull, C. M. 2003, ApJ, 588, L109
- Kaltenegger (2017) Kaltenegger, L. 2017, ARA&A, 55, 433
- King et al. (2019) King, G. W., Wheatley, P. J., Bourrier, V., Ehrenreich, D. 2019, MNRAS, 484, L49
- Laming (2015) Laming, J. M. 2015, Living Rev. Solar Phys., 12, 2
- Linsky (2017) Linsky, J. L. 2017, Ann. Rev. Astron. Astrophys. 55, 197
- Linsky, France, & Ayres (2013) Linsky, J. L., France, K., & Ayres, T. 2013, ApJ, 766, 69
- Loyd & France (2014) Loyd, R. O. P. & France, K. 2014, ApJS, 211, 9
- Loyd et al. (2016) Loyd, R. O. P., France, K., Youngblood, A., et al. 2016, ApJ, 824, 102
- Loyd et al. (2018) Loyd, R. O. P., France, K., Youngblood, A., et al. 2018, ApJ, 867, 71
- Malo et al. (2014) Malo, L., Artigau, E., Doyon, R., et al. 2014, ApJ, 788, 81
- Marino et al. (2002) Marino, A., Micela, G., Peres, G., & Sciortino, S. 2002, A&A, 383, 210
- Mazeh et al. (2001) Mazeh, T., Latham, D. W., Goldberg, E., et al. 2001, MNRAS, 325, 343
- Melbourne et al. (2020) Melbourne, K., Youngblood, A., France, K., et al. 2020, submitted to ApJ
- Miles & Shkolnik (2017) Miles, B. E.& Shkolnik, E. L. 2017, AJ, 154, 67
- Morin et al. (2010) Morin, J., Donati, J.-F., Petit, P., Delfosse, X., Forveille, T., & Jardine, M. M. 2010, MNRAS, 407, 2269
- Newton et al. (2017) Newton, E. R., Irwin, J., Charbonneau, D., Berlind, P., Calkins, M. L., & Mink, J. 2017, ApJ, 834, 85
- Oranje (1986) Oranje, B. J. 1986, A&A, 154, 185
- Pizzolato et al. (2003) Pizzolato, N., Maggio, A., Micela, G., Sciortino, S., Ventura, P. 2003, A&A, 397, 147
- Rebull et al. (2017) Rebull, L. M., Stauffer, J. R., Hillenbrand, L. A., et al. 2017, ApJ, 839, 92
- Reiners (2012) Reiners, A. 2012, Living Rev. Sol. Phys., 9, 1
- Reiners & Mohanty (2012) Reiners, A., Mohanty, S. 2012, ApJ, 746, 43
- Ribas et al. (2005) Ribas, I., Guinan, E. F., Güdel, M., & Audard, M. 2005, ApJ, 622, 680
- Richey-Yowell et al. (2019) Richey-Yowell, T., Shkolnik, E. L., Schneider, A. C., Osby, E., Barman, T., Meadows, V. S. 2019, ApJ, 872, 17
- Robrade & Schmitt (2009) Robrade, J. & Schmitt, J. H. M. M. 2009, A&A, 497, 511
- Rutten et al. (1989) Rutten, R. G. M., Schrijver, C. J., Zwaan, C., Duncan, D. K., Mewe, R. 1989, A&A, 219, 239
- Sans-Forcada et al. (2011) Sans-Forcada, J., Micela, G., Ribas, I. 2011, A&A, 532, A6
- Saur, et al. (2018) Saur, J., Fischer, C., Wennmacher, A., et al. 2018, ApJ, 859, 74
- Saxton et al. (2008) Saxton, R. D., Read, A. M., Esquej, P., et al. 2008, A&A, 480, 611
- Schmidt et al. (2015) Schmidt, S. J., Hawley, S. L., West, A. A., et al. 2015, AJ, 149, 158
- Schneider & Shhkolnik (2018) Schneider, A. C. & Shkolnik, E. L. 2018, AJ, 155, 122
- Schneider et al. (2019) Schneider, A. C., Shkolnik, E. L., Barman, T. S., Loyd, R. P. 2019, ApJ, 886, 19
- Schrijver & Rutten (1987) Schrijver, C. J., Rutten, R. G. M. 1987, A&A, 177, 143
- Shields, Ballard, & Asher (2016) Shields, A. L., Ballard, S., & Asher, J. 2-16, Physics Reports, 663, 1S38
- Shulyak et al. (2015) Shulyak, D., Reiners, A., Seemann, U., Kochukhov, O., & Piskunov, N. 2015, A&A, 563, A35
- Singh et al. (1999) Singh, K. P., Drake, S. A., Gotthelf, E. V., White, N. E. 1999, ApJ, 512, 874
- Stelzer et al. (2012) Stelzer, B., Alcalá, J., Biazzo, K., et al. 2012, A&A, 537, 94
- Stelzer et al. (2013) Stelzer, B., Marino, A., Micela, G., López-Santiago, Liefke, C. 2013, MNRAS, 431, 2063
- van Saders & Pinsonneault (2012) van Saders, J. L. & Pinsonneauldt, M. H. 2012, ApJ, 751, 98
- von Steiger et al. (1995) von Steiger, R., Wimmer-Schweingruber, R. F., Geiss, J., Gloeckler, G. 1995, Adv. Space Res., 15, 3
- Walkowicz & Hawley (2009) Walkowicz, L. M. & Hawley, S. L. 2009, AJ, 137, 3297
- Waalkes et al. (2019) Waalkes, W. C., Berta-Thompson, Z., Bourrier, V., et al. 2019, AJ, 158, 50
- Wandel (2018) Wandel, A. 2018, ApJ, 856, 165
- Wheatley (1998) Wheatley, P. J. 1998, MNRAS, 297, 1145
- Wheatley et al. (2017) Wheatley, P., Loudon, T., Bourrier, V., Ehrenreich, D., & Gillon, M. 2017, MNRAS, 465, L74
- Wilson et al. (2020) Wilson, D. J., Froning, C. S., Duvvuri, G. M., et. al 2020, submitted to ApJ
- Wood et al. (2018) Wood, B. E., Laming, J. M., Warren, H. P., Poppenhaeger, K. 2018, ApJ, 862, 66
- Wood et al. (2005) Wood, B. E., Redfield, S., Linsky, J. L., Müller, H.-R., & Zank, G. P. 2005, ApJS, 159, 118
- Wright & Drake (2016) Wright, N. J. & Drake, J. J. 2016, Nature, 535, 526
- Youngblood et al. (2016) Youngblood, A., France, K., Loyd, R. T. O. P., et al. 2016, ApJ, 824, 101
- Youngblood et al. (2017) Youngblood, A., France, K., Loyd, R. T. O. P., et al. 2017, ApJ, 843, 31
- Youngblood et al. (2020) Youngblood, A., Pineda, J. S., France, K. 2020, submitted to ApJ
| Star names (Age group) | Age(Gyr) | Sp. Type | (pc) | (Ly-) | (X) | R(Ly- | R(X) | Ref. | |||
|---|---|---|---|---|---|---|---|---|---|---|---|
| SAO 93981(M) | HD 28568 | (S) | 6567 | F2 V | 45.21 | 34.144 | 122.6 | 84.3 | 2.47 | 1.70 | 10,23 |
| SAO 76609(M) | HD 28033 | (S) | 6376 | F8 V | 48.38 | 33.983 | 24.7 | 19.2 | 0.722 | 0.561 | 1 |
| Her(O) | HD 142373 | (S) | 5890 | F8 V | 15.83 | 34.083 | 21.7 | 0.309 | 0.504 | 0.00717 | 1 |
| V376 Peg(M) | HD 209458 | (S) | 6071 | F9 V | 48.36 | 33.814 | 15.7 | 0.308 | 0.677 | 0.0133 | 1,24 |
| HR 4657(M) | HD 106516 | (S) | 6258 | F9 V | 22.35 | 33.802 | 27.8 | 5.43 | 1.23 | 0.241 | 1 |
| Dor(M) | HD 33262 | (S) | 6147 | F9 V | 11.63 | 33.750 | 46.5 | 16.7 | 2.32 | 0.834 | 1 |
| V993 Tau(M) | HD 28205 | (S) | 6197 | G0 V | 47.78 | 33.913 | 55.5 | 41.4 | 1.91 | 1.42 | 1 |
| Ori(Y) | HD 39587 | (S) | 5898 | G0 V | 8.840 | 33.602 | 41.6 | 37.3 | 2.92 | 2.62 | 1 |
| HR 6748(Y) | HD 165185 | (S) | 5932 | G0 V | 17.20 | 33.612 | 48.9 | 53.5 | 3.36 | 3.67 | 1 |
| Men(M) | HD 39091 | 3(Y) | 5870 | G0 V | 18.28 | 33.695 | 5.39 | 0.952 | 0.306 | 0.048 | 17,6 |
| HR 4345(Y) | HD 97334 | (S) | 5906 | G2 V | 22.66 | 33.613 | 42.8 | 39.9 | 2.93 | 2.73 | 1 |
| Cen A(O) | HD 128620 | (S) | 5793 | G2 V | 1.324 | 33.771 | 7.54 | 0.117 | 0.360 | 0.00557 | 1 |
| Quiet Sun(O) | … | 5780 | G2 V | … | 33.586 | 5.95 | 0.224 | 0.436 | 0.0164 | 2 | |
| Active Sun(O) | … | 5780 | G2 V | … | 33.586 | 9.15 | 2.85 | 0.670 | 0.209 | 2 | |
| HR 2882(Y) | HD 59967 | (S) | 5830 | G2 V | 21.77 | 33.537 | 55.9 | 41.9 | 4.56 | 3.42 | 1 |
| Cet(M) | HD 20630 | (S) | 5723 | G4 V | 9.146 | 33.494 | 30.0 | 25.6 | 2.70 | 2.31 | 1 |
| SAO 136111(M) | HD 73350 | (S) | 5836 | G5 V | 24.34 | 33.602 | 32.8 | 19.3 | 2.30 | 1.36 | 1 |
| SAO 158720(M) | HD 128987 | (S) | 5574 | G6 V | 23.76 | 33.401 | 34.4 | 14.3 | 3.84 | 1.60 | 1 |
| HR 2225(Y) | HD 43162 | (S) | 5651 | G6.5 V | 16.73 | 33.444 | 41.0 | 48.1 | 4.14 | 4.86 | 1 |
| Boo A(Y) | HD 131156A | (S) | 5483 | G7 V | 6.733 | 33.365 | 35.3 | 28.3 | 4.28 | 3.43 | 1 |
| 61 Vir(O) | HD 115617 | (S) | 5538 | G7 V | 8.506 | 33.499 | 5.26 | 0.265 | 0.468 | 0.0236 | 1 |
| SAO 254993(Y) | HD 203244 | (S) | 5480 | G8 V | 20.81 | 33.371 | 43.8 | 20.2 | 5.24 | 2.42 | 1 |
| HR 8(Y) | HD 166 | (S) | 5327 | G8 V | 13.78 | 33.368 | 37.9 | 33.0 | 4.56 | 3.94 | 1 |
| Cet(O) | HD 10700 | (S) | 5290 | G8.5 V | 3.603 | 33.255 | 5.66 | 0.176 | 0.886 | 0.0276 | 1 |
| SAO 28753(Y) | HD 116956 | (S) | 5308 | G9 V | 21.66 | 33.285 | 33.0 | 24.7 | 4.81 | 3.60 | 1 |
| HR 1925(M) | HD 37394 | (S) | 5243 | K0 V | 12.28 | 33.274 | 29.3 | 14.4 | 4.38 | 2.15 | 1 |
| 40 Eri A(O) | HD 26965 | (S) | 5147 | K0.5 V | 5.036 | 33.195 | 7.33 | 1.15 | 1.31 | 0.206 | 1 |
| Cen B(O) | HD 128621 | (S) | 5232 | K1 V | 1.255 | 33.297 | 10.1 | 0.533 | 1.43 | 0.0756 | 1 |
| DX Leo(Y) | HD 82443 | (S) | 5315 | K1 V | 18.08 | 33.256 | 31.1 | 59.7 | 4.85 | 9.30 | 1 |
| 70 Oph A(M) | HD 165341 | (S) | 5407 | K1 V | 5.122 | 33.308 | 23.6 | 6.62 | 3.26 | 0.915 | 1 |
| GJ 3651(O) | HD 97658 | (S) | 5157 | K1 V | 21.57 | 33.101 | 18.01 | 0.321 | 4.01 | 0.0714 | 5,24 |
| Kepler-444(O) | HIP 94931 | (S) | 5053 | K1 V | 36.48 | 33.099 | 3.10 | 0.635 | 0.694 | 0.141 | 10,24 |
| EP Eri(Y) | HD 17925 | (S) | 5167 | K1.5 V | 10.36 | 33.185 | 27.6 | 32.9 | 5.07 | 6.04 | 1 |
| Eri(M) | HD 22049 | (S) | 5077 | K2 V | 3.203 | 33.092 | 26.6 | 4.10 | 6.05 | 0.932 | 4,5 |
| 36 Oph A(M) | HD 155886 | (S) | 5103 | K2 V | 5.959 | 33.130 | 18.0 | 3.72 | 3.75 | 0.775 | 1 |
| LQ Hya(Y) | HD 82558 | (S) | 5376 | K2 V | 18.29 | 33.461 | 59.1 | 243.0 | 5.75 | 23.6 | 1 |
| V368 Cep(Y) | HD 220140 | (S) | 5075 | K2 V | 18.96 | 33.120 | 46.9 | 275.0 | 10.0 | 58.6 | 1 |
| PW And(Y) | HD 1405 | (S) | 4796 | K2 V | 28.34 | 32.976 | 47.1 | 187.0 | 14.0 | 55.7 | 1 |
| GJ 4130(O) | HD 189733 | (S) | 5019 | K2 V | 19.77 | 33.102 | 11.8 | 5.34 | 2.63 | 1.19 | 2,19 |
| GJ 2046(O) | HD 40307 | (S) | 4925 | K2.5 V | 12.94 | 33.010 | 14.2 | 0.0712 | 3.91 | 0.0196 | 4,5 |
| V471 Tau(SB) | … | (S) | 5291 | K2 V | 47.71 | 33.270 | 277.9 | 1175. | 42.0 | 178. | 1,23 |
| Speedy Mic(Y) | HD 197890 | (S) | 4609 | K3 V | 66.76 | 33.497 | 214. | 702. | 19.2 | 63.0, | 1 |
| Ind(M) | HD 209100 | (S) | 4649 | K4 V | 3.639 | 32.936 | 17.3 | 0.871 | 5.63 | 0.284 | 1 |
| 61 Cyg A(O) | HD 201091 | (S) | 4361 | K5 V | 3.497 | 32.742 | 8.90 | 0.498 | 4.54 | 0.254 | 1 |
| GJ 370(O) | HD 85512 | (S) | 4455 | K6 V | 11.28 | 32.823 | 6.50 | 0.103 | 2.75 | 0.0435 | 4,5 |
| GJ 338A(O) | HD 79210J | 5(Y) | 3940 | M0 V | 6.33 | 32.491 | 8.28 | 4.28 | 7.51 | 3.88 | 15 |
| Ross 1044(O) | GJ 1188 | (S) | 3754 | M0 V | 37.17 | 31.996 | 1.50 | 0.157 | 4.26 | 0.446 | 10 |
| HIP 23309(Y) | CD-57 1054 | (Y) | 3500 | M0 V | 26.9 | 32.651 | 16.58 | 135. | 10.40 | 84.7 | 16,25 |
| AU Mic(Y) | HD 197481 | (S) | 3588 | M1 V | 9.725 | 32.445 | 43.0 | 70.9 | 43.5 | 71.7 | 2 |
| Kapteyn’s(O) | GJ 191 | (S) | 3570 | M1 VI | 3.91 | 31.676 | 0.347 | 0.157 | 2.06 | 0.930 | 7,11 |
| GJ 410(Y) | HD 95650 | 0.3(M) | 3775 | M1 V | 11.94 | 32.386 | 9.56 | 12.36 | 11.04 | 14.3 | 16,25 |
| GJ 49(O) | HIP 4872 | 5(M) | 3175 | M1.5 V | 9.86 | 32.180 | 10.27 | 1.32 | 19.06 | 2.45 | 16,24 |
| GJ 667C(M) | HD 156384C | (S) | 3472 | M1.5 V | 7.245 | 31.837 | 1.16 | 0.087 | 4.76 | 0.357 | 4,22 |
| GJ 205(O) | HD 36395 | 5(Y) | 3719 | M1.5 V | 5.70 | 32.361 | 6.59 | 1.67 | 8.06 | 2.04 | 15 |
| GJ 3470(M) | LP 424-4 | 2(Y) | 3592 | M2 V | 29.45 | 32.235 | 3.64 | 0.82 | 5.95 | 1.34 | 18 |
| GJ 15A(O) | HD 1326 | 5(Y) | 3470 | M2 V | 3.56 | 32.015 | 1.81 | 0.0458 | 4.91 | 0.124 | 14,15,20 |
| GJ 887(M) | HD 217987 | 2.9(Y) | 3720 | M2 V | 3.28 | 32.148 | 3.73 | 0.390 | 7.45 | 0.779 | 15 |
| GJ 832(O) | HD 204961 | 8.4(S) | 3522 | M2 V | 4.965 | 32.016 | 0.996 | 0.0650 | 2.70 | 0.176 | 4,5 |
| GJ 176(O) | HD 285968 | (S) | 3679 | M2 V | 9.473 | 32.113 | 1.49 | 0.183 | 3.24 | 0.397 | 4,5 |
| Ross 860(O) | GJ 649 | 5(Y) | 3590 | M2 V | 10.38 | 32.231 | 5.49 | 6.28 | 9.06 | 10.36 | 14,25 |
| GJ 588(O) | CD-40 9712 | 5(M) | 3490 | M2.5 V | 5.92 | 32.035 | 2.74 | 0.356 | 7.10 | 0.923 | 15 |
| Ross 905(O) | GJ 436 | (S) | 3416 | M3 V | 9.756 | 31.978 | 0.850 | 0.0486 | 2.51 | 0.144 | 4,5 |
| GJ 860A∗ | HD 239960 | 3410 | M3 V | 4.01 | 31.782 | 0.750 | 0.935 | 3.48 | 4.34 | 15 | |
| GJ 581(O) | HO Lib | (S) | 3415 | M3 V | 6.299 | 31.709 | 0.186 | 0.0304 | 1.02 | 0.167 | 4,5 |
| GJ 644B(SB)∗ | HD 152751 | 5(M) | 3450 | M3.5 V | 6.20 | 32.138 | 13.4 | 14.9 | 27.4 | 30.5 | 15 |
| HIP 17695(Y) | G80-21 | 0.1(Y) | 3400 | M3 V | 16.8 | 32.026 | 13.17 | 45.9 | 34.8 | 121.5 | 16,25 |
| GJ 674(M) | CD-46 11540 | 0.5(Y) | 3260 | M3 V | 4.55 | 31.654 | 1.98 | 1.91 | 12.34 | 12.0 | 14,24 |
| GJ 729(Y) | V1216 Sgr | 0.5(Y) | 3240 | M3.5 V | 2.98 | 32.160 | 1.80 | 3.17 | 34.98 | 61.6 | 14,24 |
| Luyten’s(O) | GJ 273 | 5(M) | 3290 | M3.5 V | 3.80 | 31.589 | 0.846 | 0.123 | 6.12 | 0.89 | 15 |
| GJ 876(O) | IL Aqr | (S) | 3129 | M3.5 V | 4.676 | 31.669 | 0.363 | 0.0846 | 2.19 | 0.509 | 4,5 |
| GJ 849(O) | BD-05 5(Y) | 5(Y) | 3600 | M3.5 V | 8.80 | 32.107 | 1.43 | 0.156 | 3.14 | 0.34 | 14,20 |
| AD Leo(Y) | GJ 388 | 0.025–0.3(S) | 3308 | M3 V | 4.966 | 31.867 | 9.33 | 19.1 | 35.7 | 73.1 | 2 |
| GJ 163(O) | L229-91 | 5(Y) | 3225 | M3.5 V | 15.14 | 31.754 | 1.39 | 0.192 | 6.88 | 0.95 | 14,20 |
| Barnard’s(O) | GJ 699 | 10(Y) | 3300 | M4 V | 1.83 | 31.123 | 0.14 | 0.00688 | 2.96 | 0.15 | 11,14,20,22 |
| YZ CMi(Y) | GJ 285 | 5(M) | 3200 | M4 V | 5.99 | 31.671 | 9.189 | 13.21 | 55.2 | 79.4 | 15 |
| GJ 1132(O) | L320-124 | (S) | 3216 | M4 V | 12.62 | 31.240 | 0.11 | 0.0363 | 1.92 | 0.588 | 14,12,24 |
| GJ 1214(O) | G139-21 | 5–10(S) | 3008 | M4 V | 14.65 | 31.065 | 0.119 | 0.0308 | 2.88 | 0.745 | 5,24 |
| EV Lac(Y) | GJ 873 | 0.025–0.3(S) | 3273 | M5 V | 5.050 | 31.663 | 3.07 | 19.5 | 18.7 | 119.0 | 1 |
| LHS 2686(O) | G177-25 | 5(Y) | 3220 | M5 V | 12.19 | 31.118 | 0.39 | 0.967 | 8.54 | 21.18 | 14,20 |
| Prox Cen(O) | GJ 551 | (S) | 2840 | M5.5 | 1.301 | 30.726 | 0.301 | 0.142 | 16.0 | 7.55 | 2 |
| Trappist-1(O) | … | (S) | 2550 | M7.5 V | 12.43 | 30.301 | 0.092 | 0.131 | 13.0 | 18.5 | 14,8,9 |
References. — ∗ The value of refers to one-half of the total X-ray flux from the binary system as the X-ray observations could not resolve the emission from each star. R(Ly-)=L(Ly-)/L(bol). R(X)=L(X)/L(bol).
Age group: Y= Myr, M=0.5–3 Gy, O= Gyr., SB=Spectroscopic Binary (treated a a young star).
Age(Gyr): S = Schneider et al. (2019), Y = Youngblood (in prep), M = Melbourne (submitted to ApJ).
(1) Wood et al. (2005); (2) Linsky, France, & Ayres (2013); (3) Youngblood et al. (2017); (4) Loyd et al. (2016); (5) Youngblood et al. (2016); (6) King et al. (2019); (7) Guinan, Engle, & Durbin (2016); (8) Wheatley et al. (2017); (9) Bourrier et al. (2017); (10) Schneider et al. (2019); (11) Youngblood high RV program; (12) Waalkes et al. (2019), (13) Saur, et al. (2018); (14) Mega-Muscles program. (Wilson et al. 2020); (15) Wood et al. program GO-15326; (16) FUMES II paper Youngblood et al. (2020); (17) Garcia Munoz et al. (2020); (18) Bourrier et al. (2018); (19) Sans-Forcada et al. (2011); (20) Brown et al. (in prep); (21) Singh et al. (1999); (22) France et al. (2020); (23) ROSAT Hyades Catalog; (24) XMM Seredipitous Source catalog; (25) XMM Slew Catalog; (26)Malo et al. (2014).
| Equation | Spectral Type | |||
|---|---|---|---|---|
| F2 V to G9 V | ||||
| K0 V to K7 V | ||||
| M0 V to M2.5 V | ||||
| M3 V to M7.5 V | ||||
| F2 V to G9 V | ||||
| K0 V to K7 V | ||||
| M0 V to M2.5 V | ||||
| M3 V to M7.5 V |