Identifying the 3FHL Catalog. IV. Swift Observations of Unassociated Fermi-LAT 3FHL Sources
Abstract
The Fermi Large Area Telescope (Fermi-LAT) 3FHL catalog is the latest catalog of GeV sources and will remain an important resource for the high-energy community for the foreseeable future. Therefore, it is crucial that this catalog is made complete by providing associations for most sources. In this paper, we present the results of the X-ray analysis of 38 3FHL sources. We found a single bright X-ray source in 20 fields, two sources each in two fields and none for the remaining 16. The analysis of the properties of the 22 3FHL fields with X-ray sources led us to believe that most () are of extra-galactic origin. A machine-learning algorithm was used to determine the source type and we find that 15 potential blazars are likely BL Lacertae objects (BL Lacs). This is consistent with the fact that BL Lacs are by far the most numerous population detected above GeV in the 3FHL.
1 Introduction
Gamma rays can provide insight into the most powerful objects in the universe. The very first sensitive census of the -ray sky came in 1993 when the Energy Gamma Ray Experiment Telescope (EGRET; Fichtel) on the Compton Gamma Ray Observatory (CGRO) completed a survey of the -ray sky above 50 MeV. This revealed many high-energy astrophysical objects, such as active galactic nuclei (AGN), gamma-ray bursts, supernova remnants, and pulsars. In 2008, the Large Area Telescope (LAT; Atwood09) on board the Fermi gamma-ray space telescope took the next step in -ray astrophysics with its improved sensitivity and resolution over EGRET by factors of 100 and 3, respectively. Fermi-LAT is sensitive to the detection of hard-spectrum sources (emission GeV) as demonstrated in the 1FHL (514 objects detected above 10 GeV) and the 2FHL (360 objects detected above 50 GeV).
The newest catalog in this series, the 3FHL (Ajello17), provided a significant improvement with the detection of 1556 sources between 10 GeV and 2 TeV relying on the first 7 years of LAT data.
However, upon release, the 3FHL had 200 sources listed as either unknown (i.e., associated with a source of unknown nature) or lacking a firm association in any other wavelength. The median positional resolution of 2.3 hinders the easy identification of the counterpart. Finding these counterparts is critical because a complete catalog will enable the study of energetics and emission mechanisms for all source populations within it. Moreover, blazars (AGN with relativistic jets pointed towards the observer at a viewing angle, ) detected above 10 GeV are powerful probes of the extragalactic background light (EBL, Dominguez15), the integrated emission of all stars and galaxies in the Universe, which can shed insight into cosmological applications such as the measurement of the Hubble constant (Dominguez2019). However, that requires knowledge of their redshift. Associating the sources is thus the first step towards measuring their redshift and employing them for cosmological studies. Additionally, a complete 3FHL will be a critical resource for future observations with the upcoming Cherenkov Telescope Array (CTA; Hassan17; 4LAC2019).
One way to find potential associations is by performing X-ray observations of the fields of -ray sources. The mechanisms responsible for creating the -ray emission in blazars, i.e., the synchrotron self-Compton process or the external Compton process, also emit in the X-rays (Bottcher2007). This is what motivates an X-ray search of -ray sources potentially associated to blazars. This X-ray radiation can localize the potential counterpart with greater reliability due to their arcsecond positional uncertainties
(see e.g. Stroh13111https://www.swift.psu.edu/unassociated/, SazParkinson16; Paiano17). In addition, this improved positional localization enables the precise detection of the optical counterpart from the Ultra-Violet/Optical Telescope (UVOT, SwiftUVOT), on board the Neil Gehrels Swift Observatory (Gehrels04). Knowing the exact position will enable the follow up from ground based telescopes to measure the redshifts of these sources.
Kaur19 have provided a likely association for 52 out of the 200 unassociated 3FHL sources using the X-ray Telescope (XRT, SwiftXRT) also on board Swift. This leaves 150 3FHL unassociated objects. Here, we follow the same approach and we analyze the Swift observations of 38 3FHL unassociated sources with the aim of identifying potential counterparts and understanding their nature. A machine learning algorithm is used here, for the sources which are believed to be associated to blazars, to understand whether they are flat-spectrum radio quasars (FSRQs, i.e., blazars with optical emission lines of equivalent width 5Å) or BL Lacertae objects (BL Lacs, i.e., blazars with no emission lines in their optical spectrum) according to their spectral properties, such as the spectral photon index, color differences and variability.
This paper is organized as follows: 2 discusses the multiwavelength data acquisition and analysis. The results from this analysis are reported in 3. Then in LABEL:sec:mach, we describe our machine learning algorithm to classify these sources into BL Lacs and FSRQs and the corresponding results. Finally, LABEL:sec:conc contains the discussion and conclusions based upon our analysis.
2 Data
2.1 Observations
As part of the Swift guest investigator cycle 14 (proposal 1417063, PI: Ajello222https://swift.gsfc.nasa.gov/proposals/c14_acceptarg.html#abstracts), Swift-XRT observed 20 bright unassociated 3FHL sources without any previous X-ray observation. Then, we cross-matched the remaining 119 unassociated and 9 unknown class sources in the 3FHL catalog with archival Swift observations. We found 97 unassociated 3FHL sources that had been observed with Swift-XRT. We selected observations where the 3FHL source fell within 20 of the XRT pointing and had an XRT exposure ks to ensure reasonable statistics. This left us with 18 additional sources. For each target, we stacked all the XRT exposures found in the archive.
2.2 Swift XRT Data Analysis
The analysis was performed using HEASARC version 6.26.1333https://heasarc.gsfc.nasa.gov/docs/software.html and XSPEC version 12.10.1444https://heasarc.gsfc.nasa.gov/xanadu/xspec/ for the spectral fitting. The source spectra were extracted using a circular region with a radius ranging from 1015 depending on the brightness of the source. The background spectra were obtained from an annular region centered on the source with inner radius 35.4 and outer radius 70.7. All spectra were fit in the 0.310 keV regime with the Tuebingen-Boulder ISM absorption model (tbabs, Wilms2000). The Galactic column densities in the direction of the sources were determined following Kalberla05. Most spectra were binned with 3 counts per bin while the remaining five sources were bright enough to use 10 counts per bin. Spectral fitting was performed with C-statistic for the low-count sources and statistics for the remaining555If c-stat was used, the results are in agreement.. The parameters of all X-ray sources are reported in Table 1.
2.3 Swift-UVOT Data Analysis
All of the sources observed by XRT also had an observation conducted in at least one Swift-UVOT filter (except 3FHL J0737.5+6534 and 3FHL J1907.0+0713). The data were downloaded from the HEASARC archive and each cleaned sky image was loaded into DS9. A 5 circular region was created at the position of the XRT source. In some cases, the UVOT counterpart was not centered in the XRT region, so this circle was moved slightly (no more than 3) to enclose the entire source. 3FHL J1439.93955, 3FHL J1719.05348, and 3FHL J2030.42236 required a 4 region to eliminate any overlap from a bright source nearby. Since the UVOT fields for these sources were crowded, it was not possible to select the usual annular background region around the source. Instead circular regions of radii 20 were selected for the background from within the field where no other source was present. We provide AB magnitudes for all the detected UVOT counterparts of the XRT sources. 3FHL J1405.16118 is not included in the results due to an extremely high extinction value of A = 67.8666A represents the extinction in the V band.. The results of the analysis are listed below in Table LABEL:tab:uvot.
2.4 Archival Data
The NASA/IPAC Extragalactic Database (NED)777https://ned.ipac.caltech.edu/simplesearch and SIMBAD888http://simbad.u-strasbg.fr/simbad/ were used to provide information at lower energies about the X-ray sources adopting a search radius of 5. These results can be found in Table LABEL:tab:count.
3 Results
In the sample of 38 unassociated 3FHL sources, 22 contained at least one X-ray object in the field. Of these 22, 11 were high-latitude and 11 were low-latitude . As discussed in 3.3, it is highly unlikely these sources are chance coincidences. Two of the 3FHL sources had two X-ray objects within 4 of the 95% confidence region boundary, leaving us with 24 X-ray sources to analyze.
Approximately 80 of the objects in the 3FHL catalog are associated with blazars (FSRQs, BL Lacs, or blazar candidates of uncertain type, BCUs) with this fraction increasing to 90% if low-latitude sources are excluded. Considering all the unassociated sources we analyzed have a 3FHL photon index between 1.2 and 3.5 and an energy flux between 0.5 erg cm s and 7.5 erg cm s, we calculated the fraction of sources classified as blazars in the 3FHL with a photon index and energy flux in that range. Approximately 96% are blazars independent of Galactic latitude, however, if we only consider high-latitude sources, this increases to 98%.
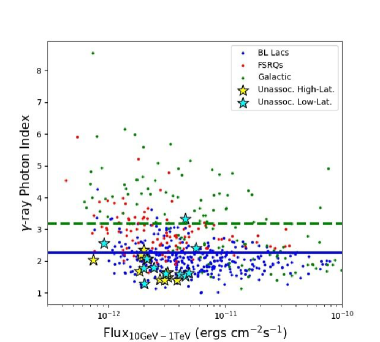
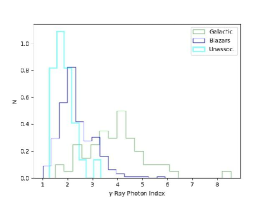
We also compared the unassociated sources’ multiwavelength data with that of classified blazars and Galactic objects. Figure 1 displays the XRT flux (0.310 keV) and 3FHL flux (10 GeV1 TeV) vs the photon index for the 24 analyzed sources, 439 3FHL sources classified as BL Lacs or FSRQs, and Galactic 3FHL sources. There is not a large discrepancy in the left plot with an average blazar X-ray photon index of 2.19 0.60 compared to the average Galactic X-ray photon index of 1.86 0.79, with the unassociated sources seemingly distributed evenly around both. However, the right plot clearly shows blazars with a harder photon index than Galactic objects, 2.25 0.63 compared to 3.18 1.29, and the 22 unassociated sources analyzed are even harder than the average blazars, aligning more with BL Lacs. This trend is further elucidated in Figure 2 as the distribution of the photon spectral indices of unassociated sources is more aligned with the distribution of blazars than that of Galactic sources.
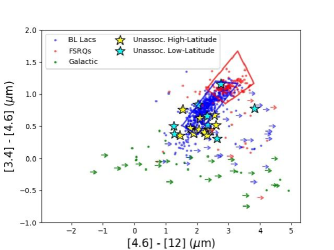
Moreover, Figure 3 displays a region of the infrared color-color space known as the WISE blazar strip (Massaro12). Galactic objects are much more likely to have a w2 (4.6 m) magnitude greater than or equal to w1 (3.4 m) while blazars and the unassociated sources exhibit the reverse. Again, the unassociated sources most frequently fall into/near the BL Lac region which agrees with the fact that BL Lacs populate 80% of the classified extragalactic sources in the 3FHL. Based on the above, the likely fraction of blazars among the 22 unassociated 3FHL sources analyzed here is 19/22. Of the 11 high-latitude and 11 low-latitude, 10 and 9 are likely to be blazars, respectively. While some of these sources do not have radio data available, the properties described above indicate a blazar nature.
The three sources not believed to be blazars are 3FHL J0737.56534, 3FHL J1405.16118, and 3FHL J1907.00713, all of which are described as pulsar-like candidates in Hui20. More specifically, Hui20 identifies 3FHL J1405.16118 as a new -ray binary. In addition to being a potential pulsar, 3FHL J1907.00713 is at low Galactic latitude ( = 0.14) and has a photon index () more typical of Galactic objects in the 3FHL.
According to Abdollahi20 and Ajello2020, 3FHL J0737.56534 is associated with the star-forming galaxy NGC 2403. However, Xi2020 believes the -ray emission originated from the supernova SN 2004dj. Our analysis finds an X-ray source 2.28 away from the 3FHL region that is spatially coincident with a high mass X-ray binary in NGC 2403, RX J073655.7+653542. Due to these findings, we have excluded it from consideration as a blazar.
Another important application of the study of 3FHL unassociated sources is the indirect detection of
dark matter. Coronado2019_1910 and Coronado2019_1906 accomplish this
through the use of archival Swift observations. We note that the only source shared between those two
works and our analysis is 3FHL J0359.40235. We believe this source is a blazar, not dark matter,
because its properties align well with known blazars as visible in Figures 1 and 2.
For all sources in Table 1, we report UVOT magnitudes and archival counterparts at different wavelengths in Tables LABEL:tab:uvot and LABEL:tab:count, respectively.
3.1 4FGL-DR2 Associations
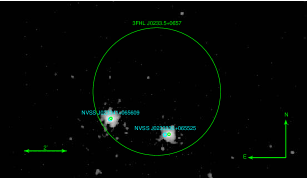
According to the second data release of the 4FGL catalog (4FGL-DR2, Abdollahi20), 7 of our 22 unassociated 3FHL sources have new associations with at least an 85% probability. Five of these associations are consistent with the X-ray sources reported in Table 1 (3FHL J0233.50657999Right source in Figure 4., 3FHL J0933.55240, 3FHL J1439.93955, 3FHL J1917.90331101010Left source in Figure 5., 3FHL J2321.61618). The other two associations are discussed in more detail below.
Of the 7 new associations, five are classified as BCUs while two are still of unknown class (3FHL J1917.90331 and 3FHL J1927.50153), meaning that the counterpart is also an unassociated source. All seven of these sources have been considered as blazars in this work and were included in our machine learning classification. Considering how the spectral properties of 3FHL J1917.90331 and 3FHL J1927.50153 align well with blazars, we included them in our machine learning algorithm despite having an unknown classification in the 4FGL-DR2.
3.1.1 3FHL J0648.3+1744
The 4FGL-DR2 reports GB6 J06481749 as the association with a 90% probability, while the XRT source had no radio data available, and are thus not reported in Table LABEL:tab:count. GB6 J06481749 lies 1.2 outside of the 3FHL 95% confidence region whereas the XRT source is inside. Therefore, we believe the XRT source, SWIFT J064827174423, is the more likely counterpart to the 3FHL source.
3.1.2 3FHL J1927.5+0153
NVSS J192729015353 is reported as the association for 3FHL J1927.50153 in the 4FGL-DR2 with an 86% probability whereas no radio data was available for the XRT source. Although both sources are inside the 3FHL 95% confidence region, the XRT source is only 6 away from the region’s center while NVSS J192729015353 is 34 away. Furthermore, the XRT source has a potential WISE association that falls within the blazar strip while NVSS J192729015353 has no WISE association. This is significant because the WISE data supports its blazar classification. For these reasons, we believe our XRT source is the more likely counterpart of 3FHL J1927.50153, yet it is possible these are all the same source if the NVSS positional uncertainty was underestimated.
3.2 Multiple X-Ray Sources
3FHL J0233.50657 and 3FHL J1917.90331 are the two sources with multiple X-ray sources. The XRT field of 3FHL J0233.50657 can be viewed in Figure 4. Since it is high-latitude, we aimed to discover which of these two X-ray sources most likely matched our above conclusion of being a blazar. We found that both had a radio counterpart, NVSS J023341065609 (left) and NVSS J023330065525 (right), which is often expected because blazars emit in radio through synchrotron radiation (Bottcher2007). Next, both displayed very similar SEDs with the two-hump spectrum indicative of blazars. Finally, both are considered radio loud, i.e. a radio flux density to optical flux density ratio111111Radio flux at 5 GHz and optical flux in the B band. 10, with a ratio of 314 14 (left) and 438 4 (right).
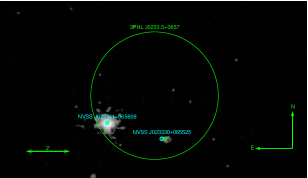
With all those results being so similar, we looked into the sources’ variability in an effort to understand their nature. The left image in Figure 4 shows the field during the 3.1 ks taken from XRT and the right five months later. As is evident, the right source decreases significantly in flux (2.67 erg cm s to 0.23 erg cm s). This increases its likelihood of being a variable blazar. However, because the properties of both sources are blazar-like, it is impossible to confidently derive which is the likely counterpart of 3FHL J0233.50657.
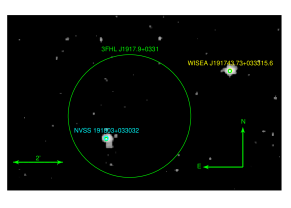
The source 3FHL J1917.90331 also had two bright (Flux 10 erg cms) X-ray sources in the field as seen in Figure 5. While being inside the 3FHL region makes the left source the more likely counterpart, we wanted to verify it with additional information. Our analysis revealed the left source has an X-ray photon index of and a flux = 1.3110 erg cms, both consistent with blazars as evident in Figure 1. Moreover, the left source has WISE and radio counterparts while the right lacks radio data. Therefore, we conclude that the left X-ray source (SWIFT J191804033030), which falls within the 95 % 3FHL error region, is the more likely X-ray counterpart for 3FHL J1917.90331.
3.3 Chance Coincidence
Following the procedure laid out in Xi2020, we used a Poisson distribution to determine the likelihood of finding another X-ray source of similar flux inside the 3FHL 95 % uncertainty region. We calculated the chance probability as:
| (1) |
where R is the angular distance between the 3FHL source and the X-ray source, is the 95 % uncertainty radius of the 3FHL source, and (F) is the surface density of X-ray sources with flux greater than F. Our sample has an average R = 2 and = 2.3. Using the newly released 4XMM-DR9 (Webb2020), we calculated a lower limit source density of 2.2 degrees at high-latitudes and with a flux 2.25 erg cm in the 0.212 keV band. This value was extrapolated from the average flux calculated in the 0.310 keV band observed by XRT. These values give an estimate for the probability of chance coincidence equal to 1.5 .
=10mm
3FHL
SWIFT Name
X-Ray R.A.
X-Ray Decl.
Exp. Time
Flux
RL
/d.o.f.
In 95%
(hh:mm:ss)
(:’:”)
(ks)
(X )
(cgs)
J0233.50657
J023341065611
02:33:40.91
06:56:11.31
14.1
1.85 0.07
0.062
4.49
314 14
99/91
Yes
J1439.93955
J143951395517
14:39:50.89
39:55:17.19
7.5
2.33 0.15
0.066
2.17
78 4
18.53/25
Yes
J1451.84145
J145149414525
14:51:49.40
41:45:24.57
7.1
2.40 0.22
0.077
1.37
…
11.51/11
Yes
J1719.05348
J171856535043
17:18:56.48
53:50:42.64
7.1
1.78 0.13
0.145
5.9
29 4
34.4/40
Yes
J2321.61618
J232137161927
23:21:36.82
16:19:26.65
3.7
2.37 0.23
0.018
2.22
…
13.35/15
Yes
3FHL
SWIFT Name
X-Ray R.A.
X-Ray Decl.
Exp. Time
Flux
RL
Cstat/d.o.f.
In 95%
(hh:mm:ss)
(:’:”)
(ks)
(X )
(cgs)
J0057.96325
J005758632637
00:57:58.4
63:26:37.34
8.7
2.05 0.24
0.81
3.86
24 4
70.1/54
Yes
J0233.50657
J023330065526
02:33:29.89
06:55:26.44
14.1
1.96 0.13
0.062
2.01
438 4
100.1/105
Yes
J0359.40235
J035923023459
03:59:23.39
02:34:59.46
6.1
2.00
0.11
0.43
96 6
2.9/5
Yes
J0528.43851
J052831385200
05:28:31.27
38:51:59.52
3.8
1.32 0.81
0.51
2.08
61 7
5.0/10
Yes
J0648.31744
J064827174423
06:48:26.67
17:44:23.19
9.7
2.00
0.18
0.16
…
0.6/2
Yes
J0737.56534
J073655653530
07:36:54.99
65:35:30.08
25.1
1.52 0.29
0.11
0.46
…
31.0/32
No, 2.28′
J0933.55240
J093334524021
09:33:33.50
52:40:20.54
8.0
2.00
0.84
0.51
6440 890
1.7/4
Yes
J1405.16118
J140514611826
14:05:14.20
61:18:25.91
23.3
2.00
1.8
0.84
…
8.2/11
Yes
J1855.30751
J185520075140
18:55:19.86
07:51:39.97
5.0
2.00
0.72
1.28
42 7
4.7/3
Yes
J1907.00713
J190706071953
19:07:06.23
07:19:52.97
14.4
1.76 0.88
1.5
0.77
…
4.8/7
No, 3.74′
J1917.90331
J191804033030
19:18:03.76
03:30:30.37
7.9
2.45 0.43
0.39
1.31
…
17.7/21
Yes
J1917.90331
J191744033315
19:17:43.77
03:33:14.98
7.9
1.66 0.34
0.39
1.39
…
21.8/25
No, 1.75′
J1927.50153
J192732015355
19:27:31.59
01:53:54.62
3.8
2.59 0.44
0.18
1.38
…
14.5/15
Yes
J2030.25037
J203024503411
20:30:24.18
50:34:11.28
2.8
1.87 0.40
0.024
0.84
…
15.2/15
No, 0.90′
J2030.42236
J203031223439
20:30:31.33
22:34:39.31
5.0
2.00
0.14
1.00
…
6.1/3
Yes
J2104.52117
J210416211813
21:04:15.95
21:18:12.50
2.1
2.00
0.10
0.30
…
1.5/4
No, 2.41′
J2105.97508
J210606750921
21:06:05.61
75:09:20.94
4.7
2.21 0.93
0.14
0.55
…
8.1/4
Yes
J2159.64619
J215936461954
21:59:35.82
46:19:53.58
3.1
2.62 0.36
0.014
0.47
…
19.4/22
Yes
J2239.52439
J223928243945
22:39:28.48
24:39:44.91
8.1
2.08 0.27
0.015
0.74
…
42.8/30
Yes
Notes. designates the model fit did not yield well-constrained results. Therefore, the photon index was frozen at 2.00.
Name we designate for the sources detected by XRT.
X-ray photon index.
Galactic column density.
Unabsorbed flux in the 0.310 keV band ( erg cm s).
Radio Loudness, i.e., ratio of flux density at 5 GHz and flux density in B band.
Denotes only a lower limit for the B flux when calculating the radio loudness.
Left source in Figure 4.
Right source in Figure 4.
Distance from boundary of 3FHL 95% confidence region to center of X-ray source.
Inside 3FHL in Figure 5.
Outside 3FHL in Figure 5.