Bulk Fermi surfaces of the Dirac type-II semimetallic candidate NiTe2
Abstract
Here, we present a study on the Fermi-surface of the Dirac type-II semi-metallic candidate NiTe2 via the temperature and angular dependence of the de Haas-van Alphen (dHvA) effect measured in single-crystals grown through Te flux. In contrast to its isostructural compounds like PtSe2, band structure calculations predict NiTe2 to display a tilted Dirac node very close to its Fermi level that is located along the to A high symmetry direction within its first Brillouin zone (FBZ). The angular dependence of the dHvA frequencies is found to be in agreement with the first-principle calculations when the electronic bands are slightly shifted with respect to the Fermi level (), and therefore provide support for the existence of a Dirac type-II node in NiTe2. Nevertheless, we observed mild disagreements between experimental observations and density Functional theory calculations as, for example, nearly isotropic and light experimental effective masses. This indicates that the dispersion of the bands is not well captured by DFT. Despite the coexistence of Dirac-like fermions with topologically trivial carriers, samples of the highest quality display an anomalous and large, either linear or sub-linear magnetoresistivity. This suggests that Lorentz invariance breaking Dirac-like quasiparticles dominate the carrier transport in this compound.
I INTRODUCTION
In recent years, electronic topology has emerged as an important set of concepts shedding new light onto solid-state systems Review1 ; Review2 ; Review3 . Predictions for novel electronic behavior include topologically protected surface states in topological insulators Hsieh2008 ; Qian1344 , quasiparticles whose behavior is akin to relativistic Dirac fermions in graphene Novoselov2005 , or chiral Weyl fermions, as uncovered in the family of TaAs compounds Xu613 ; PhysRevX.5.031013 , and even Majorana like fermions PhysRevLett.100.096407 that are predicted to be relevant for quantum computation Majoranas .
Dirac type-I semimetallic systems are characterized by linearly dispersing electronic bands that touch at a point, the Dirac node. If these spin-degenerate bands crossed the Fermi level they would lead to near massless quasiparticles displaying high mobilities as in graphene. More recently, several transition metal dichalcogenide (TMD) compounds, including PdTe2, PtTe2 and PtSe2, were predicted and found to display tilted Dirac cones PtTe2 ; PdTe2 ; PhysRevB.96.041201 ; PhysRevB relative to their Fermi level. For these deemed Dirac type-II materials, the Hamiltonian consists of the type-I linear Hamiltonian plus an additional, momentum dependent, term that breaks Lorentz invariance and leads to quasiparticles displaying a momentum-energy relation that depends on the direction of travel.
In these TMDs the existence of symmetry protected Dirac type-II points in their electronic dispersion, was confirmed through angle-resolved photoemission spectroscopy (ARPES) PhysRevLett.120.156401 ; article ; article1; article2 ; PhysRevMaterials.1.074202 and also quantum oscillatory measurements PhysRevB.97.235154 ; PhysRevB.96.041201 ; Yang_2018 ; PhysRevB.97.245109 . However, not only their Dirac nodes are located relatively far from the Fermi level but the associated Dirac like quasiparticles coexist with topologically trivial carriers which hinders their potential for applications. Still, these compounds offer the possibility of displacing the Fermi level towards the valence bands, where the nodes are located, via chemical doping Fu_2019 ; Fei_2018 . However, this approach introduces disorder and may even affect the structural stability of these systems.
In contrast, NiTe2 was predicted to host a Dirac type-II point but very close to the Fermi levelZhang_2020 ; doi:10.1021/acs.chemmater.8b02132 . Recent publications claim to find experimental evidence for its existence via the mapping of its electronic band structure through ARPES measurements PhysRevB.100.195134 or extracting its Berry phase from magnetization measurements doi:10.1021/acs.chemmater.8b02132 . However, detailed information about the Fermi surface topography, extracted from the angular dependence of the quantum oscillations, along with a comparison with density functional theory (DFT) calculations is still lacking.
In NiTe2, superconductivity was found through the application of hydrostatic pressure displaying a maximum transition temperature at K li2019pressureinduced , which could be unconventional in character given the topological nature of NiTe2. And although this compound is not superconducting in the bulk, its monolayer was predicted to become superconducting with a K that might increase up to K upon Li intercalation in bilayers NiTe2SC . Notice that two-Dimensional NiTe2, i.e. down to a monolayer, can be synthesized via chemical vapor deposition doi:10.1021/jacs.8b08124 , which offers the possibility of studying unconventional and perhaps topological superconductivity in the monolayer limit.
Given that the precise knowledge of the electronic structure is crucial for unveiling the topological character of NiTe2, and also for predicting its superconducting pairing symmetry, here we report a detailed study on the topography of its Fermi surface through the angular dependence of the de Haas-van Alphen effect. The geometry of its Fermi surface is in broad agreement with Density functional theory calculations, albeit we also observe some mild discrepancies. Although High quality single-crystals grown through a Te flux method display relatively high transport mobilities, we conclude that it is not possible to extract a topologically non-trivial Berry phase from the detected dHvA orbits. Similar results, confined to lower fields and a restricted angular range for the field orientation, were published in Ref. doi:10.1021/acs.chemmater.8b02132, . This limited their ability to compare band structure calculations with their experimental results. Here, we provide additional information concerning, for example, the value and anisotropy of the Landé g-factor, the correct behavior of the magnetic susceptibility implying the absence of localized magnetic moments, and re-discuss the Berry phase for a specific orbit on the Fermi surface showing that it displays a topologically trivial value in contrast to the claims in Ref. doi:10.1021/acs.chemmater.8b02132, .
II Experimental results
Single crystals of NiTe2 were grown via Te flux: Ni powders (99.999% Alfa Aesar) and Te shots (99.999% Alfa Aesar) with an atomic ratio of 1:20 were sealed in an evacuated quartz ampule and subsequently heated up to 1000 ∘C and held at that temperature for 4 h. Then the ampule was slowly cooled to 525 ∘C at a rate of 1 ∘C/h and subsequently centrifuged. The as-harvested single crystals were annealed for a few days under a temperature gradient to remove the residual excess Te. The composition and phase purity of the as grown crystals were confirmed by powder and single-crystal x-ray diffraction, see Table S1 and also Fig. S1 SI . Single crystal x-ray diffraction reveals a small amount of interstitial Ni which should act as magnetic impurities. However, magnetic susceptibility measured in a commercial Squid magnetometer and in another crystal indicate that this compound is a Pauli paramagnet, see Fig. S2 SI . For this particular crystal, the absence of a Curie-Weiss tail at low temperatures suggests that not all crystals contain a sizeable fraction of interstitial Ni. This observation contrasts with the conclusions in Ref. doi:10.1021/acs.chemmater.8b02132, which claims that NiTe2 would display Curie-Weiss susceptibility and thus break time-reversal symmetry. Conventional magnetotransport experiments were performed in a physical property measurement system (PPMS) using a standard four-terminal method under magnetic fields up to = 9 T and temperatures as low as = 2 K. Measurements of the dHvA effect were performed in both a resistive Bitter magnet under continuous fields up to = 31 T and temperatures as low as 0.3 K, and a superconducting magnet coupled to a dilution fridge providing fields up to = 18 T. Measurements of the dHvA effect were performed via a torque magnetometry technique or by capacitively measuring the deflection of a Cu-Be cantilever with the sample attached to it. Band structure calculations were performed through the Wien2k implementation SCHWARZ200271 of Density Functional Theory, using the Perdew-Burke-Ernzerhof (PBE) exchange correlation functional PhysRevLett.77.3865 in combination with a dense -mesh of 2288 -points and a cutoff of 7.5. The Fermi surfaces were generated using a -point mesh of 515140 and were visualized using the XCrysden softwareKOKALJ1999176 . These calculations were replicated through the QuantumExpresso QE implementation of the DFT, finding minor shifts in the position of the bands i.e. in the order of meV. The angular dependence of the extremal cross-sectional areas of the Fermi surface, which are related to the observed de Haas-van Alphen frequencies through the Onsager relation, was calculated using the SKEAF codeROURKE2012324 .
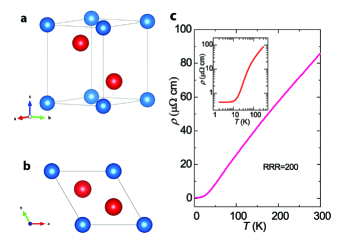
Similarly to PdTe2 and PtTe2, NiTe2 crystallizes in a centro-symmetric trigonal crystallographic structure with space-group , whose unit cell is depicted in Figs. 1(a) and 1(b). This structure is inversion symmetric hence the bands are Kramers degenerate. Resistivity as a function of the temperature for a NiTe2 single crystal in the absence of an external magnetic field is shown in the Fig. 1 (c). displays metallic behavior over the entire temperature range. The sample also shows a relatively large residual resistivity ratio (RRR) ( = 300K)/( = 2K) 200 and a small residual resistivity cm, which are comparable to values reported earlier doi:10.1021/acs.chemmater.8b02132 . Although this RRR value is not particularly high, when compared to other layered transition metal dichalcogenides like MoTe2PhysRevB.94.121101 or WTe21 , the resulting residual resistivities are slightly lower, which combined with the presence of quantum oscillations, confirms that these crystals are of high quality.
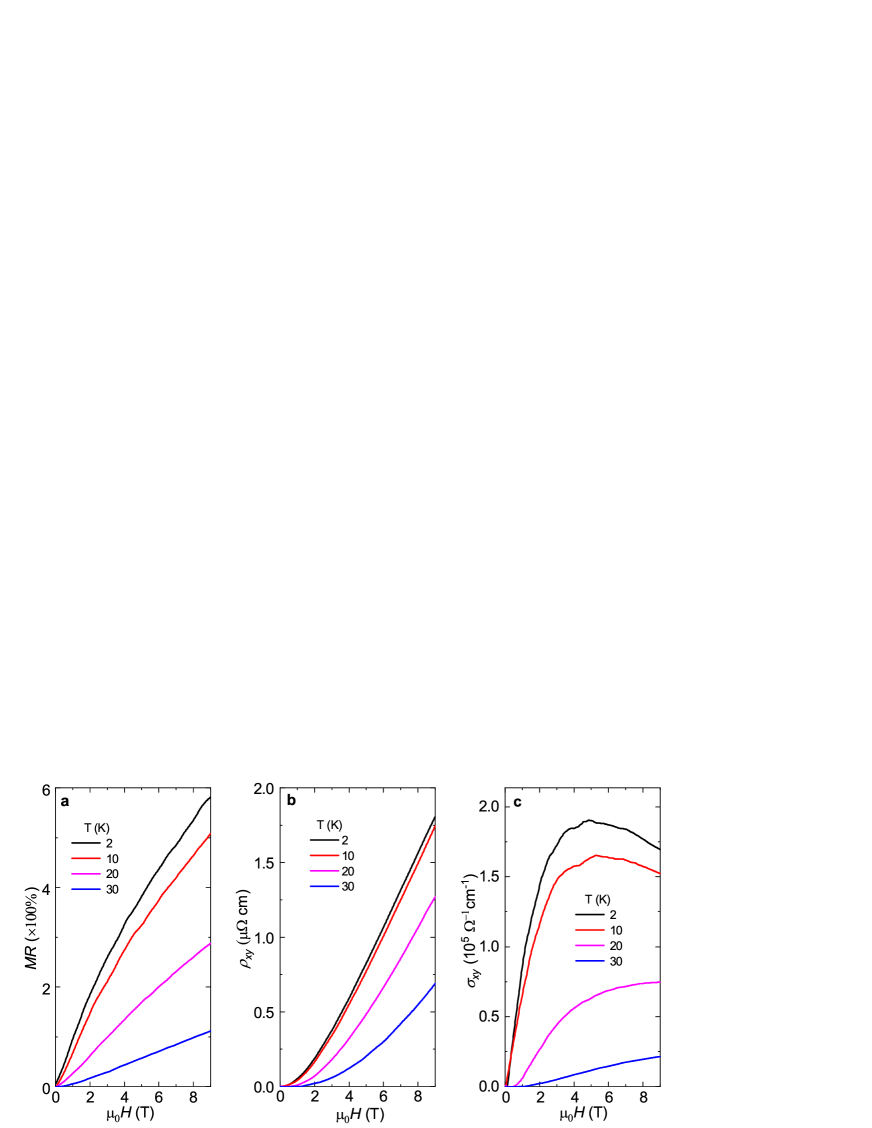
Under a transverse field ( c), the crystal shows sub-linear magnetoresistivity as seen in Fig. 2 (a), while linear magnetoresistance is observed in samples displaying low RRR (see, Figs. 2(a) and 2(b)). A large, linear, and positive magnetoresistivity was already reported decades ago for Ag based chalcogenides Ag_chalcogenides and subsequently explained by Abrikosov Abrikosov in terms of gapless semiconductors characterized by linearly dispersing quasiparticles analogous to those in Dirac systems. More recently, linear magnetoresistivity has been observed in the parent compounds of the Fe based superconductors Ba(FeAs)2 ; Terashima , which are predicted to display Dirac nodes in their electronic dispersion, and in Dirac semimetallic systems such as Cd3As2 Cd3As2 . The magnetoresistivity from Cd3As2 single crystals that display the highest mobilities do display deviations with respect to linearity Cd3As2 . However, one does not observe sub-linear behavior in field as seen here for the best NiTe2 single-crystals. To explain this effect, it would require a precise understanding on the scattering mechanisms dominating carrier transport in NiTe2.
Unlike the anomalously large magnetoresistivity reported for other topological semimetals, for NiTe2 it increases by merely 600 % at = 2 K under = 9 T, probably due to the comparatively large carrier density in this material. For samples displaying a lower RRR we observe no saturation in under fields all the way up to 31 T (see, Fig. S3(b) SI ).
To further evaluate the electrical transport properties of NiTe2, we conducted Hall-effect measurements under fields up to = 9 T and temperatures between 2 and 300 K. The results are displayed in Fig. 2(b). The Hall resistivity shows nonlinear behavior at low temperatures, especially at low fields, which is a clear indication for multi-band transport with contributions from the various electron and hole-like sheets of the Fermi surface. Given the linear or the sub-linear dependence of the magnetoresistivity with respect to magnetic field, it is not possible to estimate the carrier concentrations and their mobilities by simultaneously fitting the magnetoresistivy and the Hall-effect to a simple two-band model. However, this approach was used by Ref. doi:10.1021/acs.chemmater.8b02132, that fits only the Hall data to extract carrier mobilities and concentrations, when in reality conventional transport theory is clearly not applicable to this compound. Instead, we estimated the mean transport mobility in a plane perpendicular to the external field from the maximum in the Hall conductivity shown in Fig. 2(c), obtaining 2174 cm2V/s at = 2 K. This value is considerably higher than the mobilities reported in Ref. doi:10.1021/acs.chemmater.8b02132 from the aforementioned fittings. The observed linear or sub-linear magnetoresistivity when combined with the relatively high mobilities, suggests that Dirac-like quasiparticles dominate the transport properties of NiTe2, despite their coexistence with topologically trivial carriers.
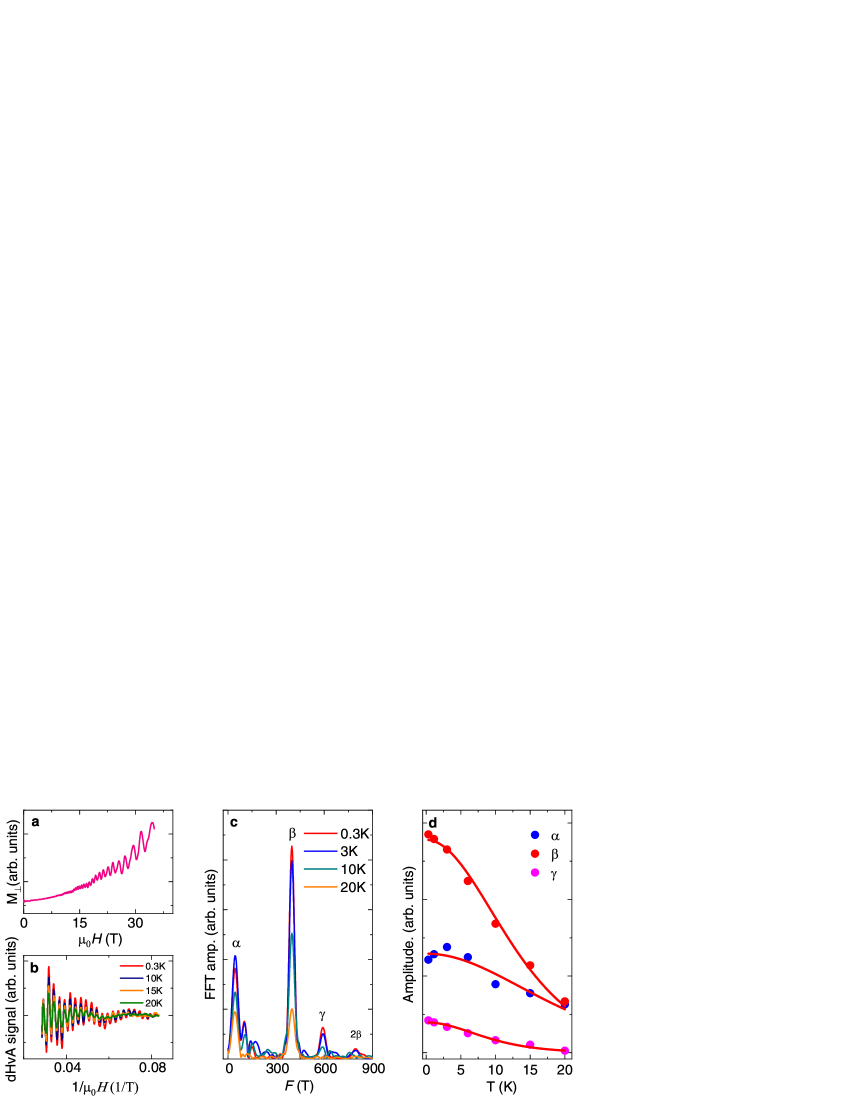
The magnetic torque , where represents the volume of the sample, is proportional to the component of the magnetization perpendicular to the external field (). Figure 3(a) displays a typical trace as a function of magnetic field, collected at K when , where = and correspond to fields along the c-axis and the ab-plane, respectively. The pure oscillatory or de Haas - van Alphen signal, obtained after subtracting the torque background is shown in Fig. 3(b). The fast Fourier transforms (FFT) of the dHvA signal superimposed onto are shown in Fig. 3(c). Several peaks are observable in the FFT spectra at frequencies between 0 and 900 T, each associated to a Fermi surface cross-sectional area according to the Onsager relation,
where is the reduced Planck constant and the electron charge. In Fig. 3(d), we plot the amplitude of the main peaks observed in Fig. 3(c) as a function of the temperature, where red lines are fits to the Lifshitz-Kosevich (LK)shoenberg_1984 temperature damping factor, or where and is the carrier effective mass in units of the free electron mass, from which we extract the effective masses associated to each frequency. We also measured the for NiTe2 as a function of for several s when , see all panels in Fig. S4 SI . The extracted effective masses for both field orientations are summarized in Table I. We extracted very light effective masses for both field orientations, i.e. ranging between 0.094 and 0.303 for those orbits characterized by frequencies inferior to 900 T. A higher frequency = 1962 T yielded an effective mass = 0.610 .
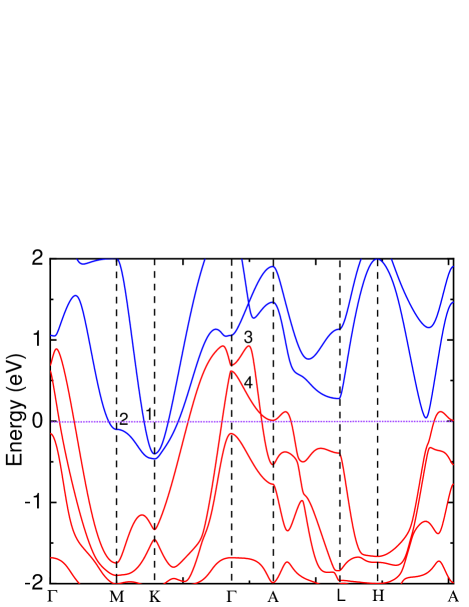
Figure 4 shows the electronic band structure of NiTe2 with the inclusion of spin orbital coupling. Four bands cross the Fermi level, the two electron-like bands are displayed in blue color, while the hole bands are plotted in red. Both hole bands intersect along the - A direction at energies slightly above , thus producing the Dirac type-II cone, which is located at the reciprocal lattice vectors doi:10.1021/acs.chemmater.8b02132 ; PhysRevB.100.195134 within the FBZ.
The goal of the this study is to compare the topography of the Fermi surface measured experimentally through the angular dependence of the dHvA-effect, with those predicted by the DFT calculations. A good agreement between both would validate these calculations, and hence support the existence of a tilted Dirac cone in NiTe2. Therefore, the FFT spectra of the oscillatory dHvA signal collected at K and for various angles is plotted in Fig. S5 SI . Oscillations in the torque data are observable over the entire angular range. Notice that it reveals two spin-zeros for the -orbit, or angles where the amplitude of the oscillations approaches zero due to the spin-dephasing factor in the Lifshitz-Kosevich formula shoenberg_1984 . The cosinusoidal term reaches zero value whenever . Here, is the effective mass in units of the free electron mass and the Landé -factor. If one assumed for the first spin-zero and for the second, one would obtain a large Landé -factor of 4.74 for and for implying a pronounced anisotropy by a factor of 3. The origin of such large values for the -factor remains to be understood, although we have observed similar values for the Dirac type-II candidates MAl3 Chen (where, V, Nb or Ta) suggesting perhaps a role for electronic correlations in these systems.
| Orbit | (T) | Orbit | (T) | Band | ||||
|---|---|---|---|---|---|---|---|---|
| 44 | 0.146 | 0.096 | 47 | 0.094 | 0.075 | 3 | ||
| 398 | 0.210 | 0.154 | 802 | 0.212 | 0.437 | 4 | ||
| 591 | 0.303 | 0.300 | 4 | |||||
| 706 | 0.202 | 0.265 | 2 | |||||
| 1962 | 0.610 | 1.121 | 1 | |||||
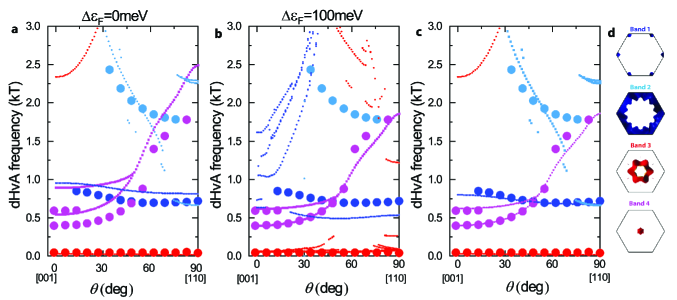
Now we proceed to our objective of comparing the angular dependence of the dHvA frequencies with that of the cross-sectional areas of the Fermi surface predicted by DFT, as illustrated by Fig. 5. The experimental frequencies are plotted through larger markers whereas the theoretically predicted ones are indicated by small markers. Figure 5(a) displays the DFT frequencies for the position of resulting from the DFT calculations. We observe mild as well as somewhat pronounced band dependent disagreements between calculations and experiments. However, if we followed the ARPES approach in Ref. PhysRevB.100.195134, and shifted by +100 meV one would achieve a perfect agreement between the DFT calculations and the experimental frequencies for band 4, see Fig. 5(b). However, as clearly seen such displacement intensifies the disagreement for the other bands. Therefore, we choose to displace individual bands with respect to to improve the agreement. This ad-hoc approach assumes that the exact position of the bands usually depends on the precise details of the DFT implementation, with these small displacements correcting for the inherent error of DFT. Moving band 1 downward by 60 meV with respect to (as shown in Fig. 5(c)) leads to a better match. Nevertheless, displacing all the bands by this same amount decreases the overall agreement. Therefore, in Fig. 5(d) the calculated bands 1 and 4 were displaced by -60 meV and 100 meV relative to respectively, leading to a very good agreement for the observed FS sheets. However, this independent band shift would lead to the suppression of the Dirac type-II nodes and hence would be inconsistent with the general good agreement between the band structure collected by ARPES PhysRevB.100.195134 and the calculations. A similar situation was observed for the Weyl type-II semi metallic candidate MoTe2 where the electronic bands had to be independently displaced to match both the ARPES and the dHvA data Daniel . Subsequent theoretical work PhysRevB.99.035123 , supported by an ARPES study xu, pointed to the relevant role played by electronic correlations which tend to renormalize the dispersion of the electronic bands. Perhaps, the deviations seen here might indicate that electronic correlations are relevant also to NiTe2 although these do not renormalize the carrier effective masses with respect to the band masses according to Table 1. Instead, correlations would seem to favor a renormalized Landé g-factor. Finally, Fig. 5(d) shows the corresponding Fermi surfaces resulting from the displaced bands. As shown in Fig 3(c), for magnetic fields oriented along the c-axis, there are three distinct frequencies: , and . Based on their angular dependence, the frequency can be assigned to the very small hole pockets resulting from band 3, while the and orbits would correspond to the minimum and maximum cross sectional areas of the hole pocket associated with band 4 (see, Fig. 6 (a)).
Given the possible presence of Dirac type-II points in NiTe2, one might expect to detect charge carriers characterized by topologically nontrivial Berry phases. The LK formulashoenberg_1984 describes the quantum oscillatory phenomena observed in the magnetization through:
where is the previously mentioned temperature damping factor, =exp is the Dingle damping factor, and is the spin dephasing factor. The phase factor , contains the Berry phase and an additional term that takes values of 0 or (the sign depends on the cross-sectional area, maxima or minima) for Fermi surfaces of two- or three-dimensional character, respectively. In order to extract the correct phase of the dHvA oscillations, one can use the magnetic susceptibility
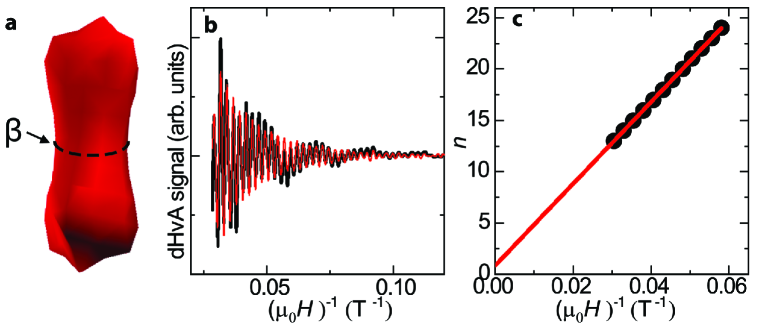
The Dirac node located along the - A direction, would touch the extreme tip or the extreme bottom of the hole Fermi surface resulting from band 4 depicted Fig. 6(a), if was precisely located at the energy of the Dirac type-II point.
As is shown in Fig. 6(a), the frequency corresponds to an orbit around the minimum cross-sectional area of the hole pocket centered around the -point. It displays the dominant peak in the FFT spectra seen in Fig. 3(c) for . It is also well-separated from the other frequencies making it a good candidate for the evaluation of the Berry-phase of NiTe2, as previously done in Ref. doi:10.1021/acs.chemmater.8b02132, . For example, one can apply a band pass filter to extract only the oscillations associated with the orbit ( = 398 T). The result of this procedure is shown in Fig. 6(b). The valleys in the oscillatory signal can be assigned to Landau indices n, which produces the Landau fan diagram shown in Fig. 6(c). The phase can be extracted from the intercept of the extrapolation of as a function of . For , we obtain , corresponding to a Berry phase of . Similar results are obtained for other two angles satisfying . However, for a Dirac system one would expect to extract a Berry phase of . This discrepancy is not at all surprising, given that the -orbit does not encircle the Dirac node due its position in the plane relative to the position of the Dirac Type-II node at . This relative position precludes this orbit from probing the texture of the Berry curvature around the Dirac node, as discussed in Ref. Chen, . In addition, and as previously mentioned, the spin-dephasing factor changes the sign of the amplitude of the oscillatory term as the sample is rotated with respect to the external field, thus affecting the proper extraction of the phase. There is however another frequency associated to band 4, the -orbit, that corresponds to the maximal cross sectional area on the FS sheet shown in Fig. 6(a) which is closer to the nodes. However, its weak amplitude in the FFT spectra makes it nearly impossible to reliably extract its Berry phase.
III Summary
In summary, we unveiled the Fermi surfaces of NiTe2 through measurements of the de Haas-van Alphen effect and compared it to band structure calculations.
The general trends of the detected Fermi surface sheets are relatively well captured by density functional theory calculations. However, the precise position of the
bands relative to the Fermi level had to be independently displaced to achieve an optimal agreement. The need for this ad-hoc procedure, in combination with
light and nearly isotropic experimental effective masses, indicates that density Functional theory fails to capture the finer details of the electronic band-structure
of NiTe2. The Landé -factor extracted for this system is observed to be large and anisotropic as previously observed in several topological semimetals,
pointing to either a possible role for correlations, or a large orbital angular momentum for these systems. The anomalous magnetoresistivity displayed by this system in combination with the relatively high mobilities, suggest that Dirac-like quasiparticles dominate its transport properties, despite their coexistence with topologically trivial carriers. It remains to be understood how these Lorentz invariance breaking quasiparticles might influence the superconductivity observed in this compound under pressure.
IV Acknowledgments
We acknowledge R. E. Baumbach for the assistance with the magnetic susceptibility measurements. This work was supported by DOE-BES through award DE-SC0002613. W.Z. was partially supported by NSF through NSF-DMR-1807969. The NHMFL is supported by NSF through NSF-DMR-1644779 and the State of Florida.
References
- (1) M. Z. Hasan and C. L. Kane, Rev. Mod. Phys. 82, 3045 (2010).
- (2) B. Yan and C. Felser, Annu. Rev. Condens. Matter Phys. 8, 337 (2017).
- (3) N. P. Armitage, E. J. Mele, and A. Vishwanath, Rev. Mod. Phys. 90, 015001 (2018).
- (4) D. Hsieh, D. Qian, L. Wray, Y. Xia, Y. S. Hor, R. J. Cava, and M. Z. Hasan, Nature 452, 970 (2008).
- (5) X. Qian, J. Liu, L. Fu, and J. Li, Science 346, 1344 (2014).
- (6) K. S. Novoselov, A. K. Geim, S. V. Morozov, D. Jiang, M. I. Katsnelson, I. V. Grigorieva, S. V. Dubonos, and A. A. Firsov, Nature 438, 197 (2005).
- (7) S.-Y. Xu, I. Belopolski, N. Alidoust, M. Neupane, G. Bian, C. Zhang, R. Sankar, G. Chang, Z. Yuan, C.-C. Lee, S.- M. Huang, H. Zheng, J. Ma, D. S. Sanchez, B. Wang, A. Bansil, F. Chou, P. P. Shibayev, H. Lin, S. Jia, and M. Z. Hasan, Science 349, 613 (2015).
- (8) B. Q. Lv, H. M. Weng, B. B. Fu, X. P. Wang, H. Miao, J. Ma, P. Richard, X. C. Huang, L. X. Zhao, G. F. Chen, Z. Fang, X. Dai, T. Qian, and H. Ding, Phys. Rev. X 5, 031013 (2015).
- (9) L. Fu and C. L. Kane, Phys. Rev. Lett. 100, 096407 (2008).
- (10) S. Das Sarma, M. Freedman, and C. Nayak, Npj Quantum Inf. 1, 15001 (2015).
- (11) M. Yan, H. Huang, K. Zhang, E. Wang, W. Yao, K. Deng, G. Wan, H. Zhang, M. Arita, H. Yang, Z. Sun, H. Yao, Y. Wu, S. Fan, D. W., and S. Zhou, Nature Commun. 8, 257 (2017).
- (12) H.-J. Noh, J. Jeong, E.-J. Cho, K. Kim, B. Min, and B.-G. Park, Phys. Rev. Lett. 119, 016401 (2017).
- (13) F. Fei, X. Bo, R. Wang, B. Wu, J. Jiang, D. Fu, M. Gao, H. Zheng, Y. Chen, X. Wang, H. Bu, F. Song, X. Wan, B. Wang, and G. Wang, Phys. Rev. B 96, 041201 (2017).
- (14) H. Huang, S. Zhou, and W. Duan, Phys. Rev. B 94, 121117 (2016).
- (15) O. J. Clark, M. J. Neat, K. Okawa, L. Bawden, I. Marković, F. Mazzola, J. Feng, V. Sunko, J. M. Riley, W. Meevasana, J. Fujii, I. Vobornik, T. K. Kim, M. Hoesch, T. Sasagawa, P. Wahl, M. S. Bahramy, and P. D. C. King, Phys. Rev. Lett. 120, 156401 (2018).
- (16) Y. Liu, J. Zhao, L. Yu, C. Lin, A. Liang, C. Hu, Y. Ding, Y. Xu, S. He, L. Zhao, G. Liu, X. Dong, J. Zhang, C. Chen, Z. Xu, H.Weng, X. Dai, Z. Fang, and X. Zhou, Chin. Phys. Lett. 32, 067303 (2015).
- (17) M. Bahramy, O. Clark, B.-J. Yang, J. Feng, L. Bawden, J. Riley, I. Marković, F. Mazzola, V. Sunko, D. Biswas, S. Cooil, M. Jorge, J. Wells, M. Leandersson, T. Balasubramanian, J. Fujii, I. Vobornik, J. E. Rault, T. Kim, M. Hoesch, K. Okawa, M. Asakawa, T. Sasagawa, T. Eknapakul, W. Meevasana, and P. King, Nat. Mater. 17, 257 (2018).
- (18) Y. Li, Y. Xia, S. A. Ekahana, N. Kumar, J. Jiang, L. Yang, C. Chen, C. Liu, B. Yan, C. Felser, G. Li, Z. Liu, and Y. Chen, Phys. Rev. Materials 1, 074202 (2017).
- (19) W. Zheng, R. Schönemann, N. Aryal, Q. Zhou, D. Rhodes, Y.-C. Chiu, K.-W. Chen, E. Kampert, T. Förster, T. J. Martin, G. T. McCandless, J. Y. Chan, E. Manousakis, and L. Balicas, Phys. Rev. B 97, 235154 (2018).
- (20) H. Yang, M. Schmidt, V. Süss, M. Chan, F. F. Balakirev, R. D. McDonald, S. S. P. Parkin, C. Felser, B. Yan, and P. J. W. Moll, New J. Phys. 20, 043008 (2018).
- (21) D. Fu, X. Bo, F. Fei, B.Wu, M. Gao, X.Wang, M. Naveed, S. A. Shah, H. Bu, B.Wang, L. Cao, W. Zou, X.Wan, and F. Song, Phys. Rev. B 97, 245109 (2018).
- (22) B.-B. Fu, C.-J. Yi, Z.-J. Wang, M. Yang, B.-Q. Lv, X. Gao, M. Li, Y.-B. Huang, H.-M. Weng, Y.-G. Shi, T. Qian, and H. Ding, Chin. Phys. B 28, 037103 (2019).
- (23) F. Fei, X. Bo, P. Wang, J. Ying, J. Li, K. Chen, Q. Dai, B. Chen, Z. Sun, M. Zhang, and et al., Adv. Mater. 30, 1801556 (2018).
- (24) J. Zhang and G. Q. Huang, J. Phys. Condens. Matter 32, 205702 (2020).
- (25) C. Xu, B. Li, W. Jiao, W. Zhou, B. Qian, R. Sankar, N. D. Zhigadlo, Y. Qi, D. Qian, F.-C. Chou, and X. Xu, Chem. Mater. 30, 4823 (2018).
- (26) B. Ghosh, D. Mondal, C.-N. Kuo, C. S. Lue, J. Nayak, J. Fujii, I. Vobornik, A. Politano, and A. Agarwal, Phys. Rev. B 100, 195134 (2019).
- (27) T. Li, K. Wang, C. Xu, Q. Hou, H. Wu, J.-Y. Ge, S. Cao, J. Zhang, W. Ren, X. Xu, N.-C. Yeh, B. Chen, and Z. Feng, (2019), arXiv:1911.07173.
- (28) F. Zheng, X.-B. Li, P. Tan, Y. Lin, L. Xiong, X. Chen, and J. Feng, Phys. Rev. B 101, 100505(R) (2020).
- (29) B. Zhao, W. Dang, Y. Liu, B. Li, J. Li, J. Luo, Z. Zhang, R. Wu, H. Ma, G. Sun, Y. Huang, X. Duan, and X. Duan, J. Am. Chem. Soc. 140, 14217 (2018).
- (30) See suplemental material at http://link.aps.org/supplemental for magnetoresistivity and hall-effect, resistivity as a function of the temperature for samples of varying quality, de haas-van alphen effect at an angle , and the de haas-van alphen effect as a function of field orientation.
- (31) K. Schwarz, P. Blaha, and G. K. H. Madsen, Comput. Phys. Commun. 147, 71 (2002).
- (32) J. P. Perdew, K. Burke, and M. Ernzerhof, Phys. Rev. Lett. 77, 3865 (1996).
- (33) A. Kokalj, J. Mol. Graph. 17, 176 (1999).
- (34) P. Giannozzi, S. Baroni, N. Bonini, M. Calandra, R. Car, C. Cavazzoni, D. Ceresoli, G. L. Chiarotti, M. Cococcioni, I. Dabo, A. Dal Corso, S. Fabris, G. Fratesi, S. de Gironcoli, R. Gebauer, U. Gerstmann, C. Gougoussis, A. Kokalj, M. Lazzeri, L. Martin-Samos, N. Marzari, F. Mauri, R. Mazzarello, S. Paolini, A. Pasquarello, L. Paulatto, C. Sbraccia, S. Scandolo, G. Sclauzero, A. P. Seitsonen, A. Smogunov, P. Umari, and R. M. Wentzcovitch, J. Phys.: Condens. Matter 21, 395502 (2009).
- (35) P. Rourke and S. Julian, Comput. Phys. Commun. 183, 324 (2012).
- (36) Q. Zhou, D. Rhodes, Q. R. Zhang, S. Tang, R. Schönemann, and L. Balicas, Phys. Rev. B 94, 121101 (2016).
- (37) M. N. Ali, J. Xiong, S. Flynn, J. Tao, Q. D. Gibson, T. Schoop, Leslie M.and Liang, N. Haldolaarachchige, M. Hirschberger, and R. J. Ong, N. P.and Cava, Nature 514 (2014).
- (38) R. Xu, A. Husmann, T. F. Rosenbaum, M.-L. Saboungi, J. E. Enderbya, and P. B. Littlewood, Nature (London) 390, 57 (1997).
- (39) A. A. Abrikosov, Phys. Rev. B 58, 2788 (1998).
- (40) K. K. Huynh, Y. Tanabe, and K. Tanigaki, Phys. Rev. Lett. 106, 217004 (2011).
- (41) T. Terashima, H. T. Hirose, D. Graf, Y. Ma, G. Mu, T. Hu, K. Suzuki, S. Uji, and H. Ikeda, Phys. Rev. X 8, 011014 (2018).
- (42) T. Liang, Q. Gibson, M. N. Ali, M. Liu, R. J. Cava, and N. P. Ong, Nat. Mater. 14, 280 (2014).
- (43) D. Shoenberg, Magnetic Oscillations in Metals, Cambridge Monographs on Physics (Cambridge University Press, 1984).
- (44) K. W. Chen, X. Lian, Y. Lai, N. Aryal, Y. C. Chiu, W. Lan, D. Graf, E. Manousakis, R. E. Baumbach, and L. Balicas, Phys. Rev. Lett. 120, 206401 (2018).
- (45) D. Rhodes, N. Schonemann, R. and; Aryal, Q. Zhou, Q. R. Zhang, E. Kampert, Y. C. Chiu, Y. Lai, Y. Shimura, G. T. McCandless, J. Y. Chan, D. W. Paley, J. Lee, A. D. Finke, J. P. C. Ru, S. Das, E. Manousakis, and L. Balicas, Phys. Rev. B 96, 165134 (2017).
- (46) N. Aryal and E. Manousakis, Phys. Rev. B 99, 035123 (2019).