Experimental and Computational Determination of Optimal Boron Content in Layered Superconductor Sc20C8-xBxC20
Abstract
It is generally difficult to quantify the amounts of light elements in materials because of their low X-ray-scattering power, as this means that they cannot be easily estimated via X-ray analyses. Meanwhile, the recently reported layered superconductor, Sc20C8-xBxC20, requires a small amount of boron, which is a light element, for its structural stability. In this context, here, we quantitatively evaluate the optimal value using both the experimental and computational approaches. Using the high-pressure synthesis approach that can maintain the starting composition even after sintering, we obtain the Sc20(C,B)8C20 phase by the reaction of the previously reported Sc15C19 and B (Sc15ByC19). Our experiments demonstrate that an increase in values promotes the phase formation of the Sc20(C,B)8C20 structure; however, there appears to be an upper limit to the nominal value to form this phase. The maximum is found to correspond with the actual value of under the assumption that the sample with the same as the reported value possesses the optimal amount. Moreover, we construct the energy convex hull diagram by calculating the formation enthalpy based on first principles. Our computational results indicate that the composition of Sc20C4B4C20 is the most thermodynamically stable, which is reasonably consistent with the experimentally obtained value.
+81 (0)29 8612312 AIST] National Institute of Advanced Industrial Science and Technology (AIST), Tsukuba, Ibaraki 305-8568, Japan AIST] National Institute of Advanced Industrial Science and Technology (AIST), Tsukuba, Ibaraki 305-8568, Japan \alsoaffiliation[TUS] Department of Physics, Graduate School of Science, Tokyo University of Science, Shinjuku, Tokyo 162-8601, Japan \alsoaffiliation[TUS] Department of Physics, Graduate School of Science, Tokyo University of Science, Shinjuku, Tokyo 162-8601, Japan AIST] National Institute of Advanced Industrial Science and Technology (AIST), Tsukuba, Ibaraki 305-8568, Japan AIST] National Institute of Advanced Industrial Science and Technology (AIST), Tsukuba, Ibaraki 305-8568, Japan \alsoaffiliation[IMRA] IMRA Material R&D Co., Ltd., Kariya, Aichi 448-0032, Japan AIST] National Institute of Advanced Industrial Science and Technology (AIST), Tsukuba, Ibaraki 305-8568, Japan
1 Introduction
High-frequency lattice vibrations are known as one of the key factors that enhance the superconducting critical temperature within the framework of the Bardeen–Cooper–Schrieffer (BCS) theory1, 2. Prime examples reflecting the effects of lattice vibrations include the observation of the highest in \ceMgB2 at normal pressure3, 4 and the discovery of nearly room temperature (RT) superconductivity in superhydride materials under exceedingly high pressures (HP)5, 6, 7.
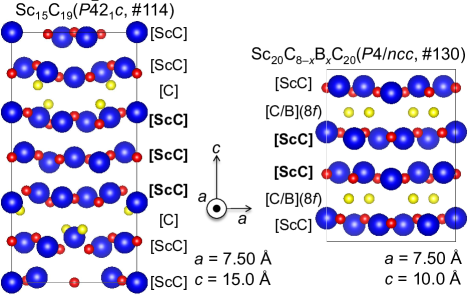
Meanwhile, our search for superconducting materials containing light elements has recently yielded scandium borocarbide \ceSc20C_8-xB_xC20, wherein the crystal structure is composed of alternately stacked \ceScC and \ceC/B layers8. This compound exhibits bulk superconductivity at with typical type-II behavior. In our studies, we found that a small amount of B is essential for phase stability although polycrystalline samples could be easily obtained by arc-melting each element. In this regard, in a previous study, when B was excluded from the starting ingredients, the authors observed the formation of the non-superconducting \ceSc15C19 phase with a similar crystal structure9. Figure 1 compares the structures of the two materials. Both compounds exhibit a tetragonal layered structure with similar -axis lengths and homogeneous atomic layers (ScC and C/B layers); however, there is a difference in their stacking sequence. In \ceSc15C19 with the space group , the C layer is separated by triple ScC layers; however, it can be observed that \ceSc15C19 exhibits an inexplicable buckling in each layer, particularly in the C layer. On the other hand, in \ceSc20(C,B)8C20 , double ScC layers are sandwiched between the C layers. Furthermore, using density functional theory (DFT) calculations for \ceSc20(C,B)8C20, we previously estimated that the structural model, wherein B is substituted into the site that forms the C layer, is the most stable configuration8.
When an equivalent crystallographic site is occupied by different light elements, as in the formation of a solid-solution state, it is generally difficult to quantitatively analyze their concentrations. This is because the lighter elements are relatively insensitive to direct-composition X-ray analysis techniques such as energy-dispersive X-ray spectroscopy (EDS) and electron probe microanalysis (EPMA). Indeed, an optimal amount of in \ceSc20C_8-xB_xC20 remains unknown because there is a slight discrepancy between the starting and actual compositions due to the evaporation of C and B during the melting and the formation of a secondary phase. As reported in the literature8, considering the optimized starting composition, has been empirically assumed to be 1 or 2 at most; moreover, the value of the as-melted sample hardly depends on the nominal B content. This implies that the arc-melting is unsuitable for precise composition tuning, which conversely suggests that the samples obtained by this method almost always have an unknown optimal content of B.
In this study, we report the successful synthesis of \ceSc20(C,B)8C20 via a solid-state reaction under HP. Although the reaction of the stoichiometric mixture of elemental Sc, B, and C powders yields no \ceSc20(C,B)8C20, we demonstrate that this phase can be obtained by the reaction of \ceSc15C19 with the addition of B. Because the starting composition is maintained during the HP synthetic process, this technique allows us to finely control the target composition. Taking advantage of the benefits of HP synthesis in terms of high sealability of the sample, we attempt to estimate an optimal value in \ceSc20C_8-xB_xC20. Furthermore, to investigate the thermodynamic stability of the crystal structure as a function of , we perform first-principles DFT calculations based on the convex hull approach11.
2 Experimental and computational methods
2.1 Sample preparation
Polycrystalline samples with a nominal composition of \ceSc15B_yC19 were synthesized by means of the conventional solid-state reaction under pressures realized with the use of a cubic-anvil-type HP apparatus (CAP-07, Riken). The starting materials, powders of \ceSc15C19 and amorphous B, were weighed in a molar ratio of , and then mixed using a zirconia mortar in a dry-nitrogen-filled glovebox. The precursor \ceSc15C19 was obtained by arc-melting Sc metal and graphite with a starting composition of on a water-cooled copper hearth. The mixture of was pressed into a pellet and encapsulated in a platinum crucible to avoid external contamination. The sample, assembled in an HP cell with pyrophyllite as the pressure-transmitting medium, was sintered at for under a pressure of and subsequently quenched to room temperature .
2.2 Characterization
The phase purity of the obtained samples was confirmed by means of powder X-ray diffraction (XRD) with \ceCu- radiation at approximately . The intensity data were collected by using a diffractometer (Ultima-IV, Rigaku) equipped with a high-speed X-ray detector (D/teX Ultra, Rigaku). For the refinement of the crystal structure of \ceSc15C19, we performed the Rietveld analysis of the data of the as-melted sample using the BIOVIA Materials Studio Reflex software package (version 2018 R2)12. Single-phase analysis was adopted in this study.
We examined the sample superconductivity and by means of magnetization measurements using a commercial SQUID magnetometer (MPMS-XL, Quantum Design), with the temperature ranging from to under a magnetic field of . The relevant data were acquired for both the zero-field cooling and field cooling processes.
2.3 Enthalpy calculations
To construct the convex hull diagram, we performed structural optimization for each value of \ceSc20C_8-xB_xC20 using density functional theory (DFT) calculations and estimated the enthalpy of formation. We used the on-the-fly ultrasoft pseudopotentials13 generated by the CASTEP code14 along with GGA-PBE exchange-correlation functionals15. The cut-off energy for the plane-wave basis set was for these calculations. The -space was sampled by a Monkhorst-Pack grid16. In this study, we created structural models in which the C atoms at the site are selectively replaced by B atoms, and therefore, we removed the constraints of the space group (#130) and set it to (#1).
3 Results
3.1 Material synthesis and phase identification
3.1.1 Reexamination of crystal structure of \ceSc15C19
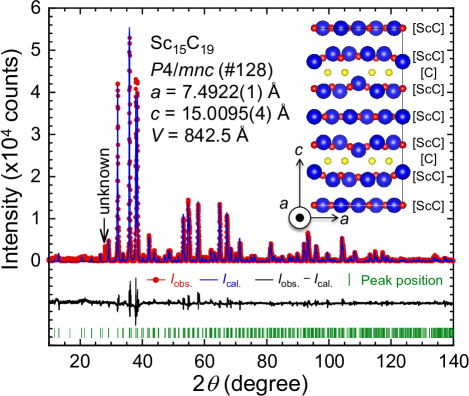
In the next section, we show that the \ceSc20C_8-xB_xC20 phase was indeed obtained by the HP synthesis of the mixture of \ceSc15C19 and B powders. In this study, before the HP synthesis, we reexamined the X-ray structure of \ceSc15C19. First, the structural optimization of the previous model was performed by using DFT calculations, which resulted in a large decrease in the formation enthalpy per unit cell from to . From the inset of Fig. 2, it can be observed that the degree of buckling in the C layer clearly reduces in the obtained model with the higher symmetry of (#128). The enthalpy difference of about between two structural models might be due to the close proximity between the C atoms in the C and ScC layers in the originally reported structure, as can be seen from the left panel of Fig. 1. Figure 2 shows the result of the Rietveld analysis applied to \ceSc15C19. The experimental XRD pattern is well-fitted by the model, which yields a weighted-profile factor and expected reliability factor of and , respectively. These values correspond to a goodness-of-fit indicator of , thereby confirming the appropriateness of the analysis. The fractional coordinates are summarized in Table 1. Additionally, as indicated by the arrow in Fig. 2, a non-negligible peak originating from a certain secondary phase is observed at around ; however, we found that the origin of this reflection cannot be explained even by the originally reported model.
| Site |
|
x | y | z | a | ||
|---|---|---|---|---|---|---|---|
| Sc1 | 0.2108(4) | 0.3956(4) | 0.1447(2) | 0.013(1) | |||
| Sc2 | 0 | 0 | 0.1886(5) | 0.013 | |||
| Sc3 | 0.3020(6) | 0.0955(7) | 0 | 0.013 | |||
| Sc4 | 1/2 | 1/2 | 0 | 0.013 | |||
| C1 | 0.3005(16) | 0.0961(16) | 0.1684(5) | 0.013 | |||
| C2 | 1/2 | 1/2 | 0.1591(16) | 0.013 | |||
| C3 | 0.1931(21) | 0.3781(22) | 0 | 0.013 | |||
| C4 | 0 | 0 | 0 | 0.013 | |||
| C5 | 0.3459(20) | 0.1541(20) | 1/4 | 0.013 |
a A global factor was employed for all crystallographic sites.
3.1.2 High-pressure synthesis of \ceSc15B_yC19
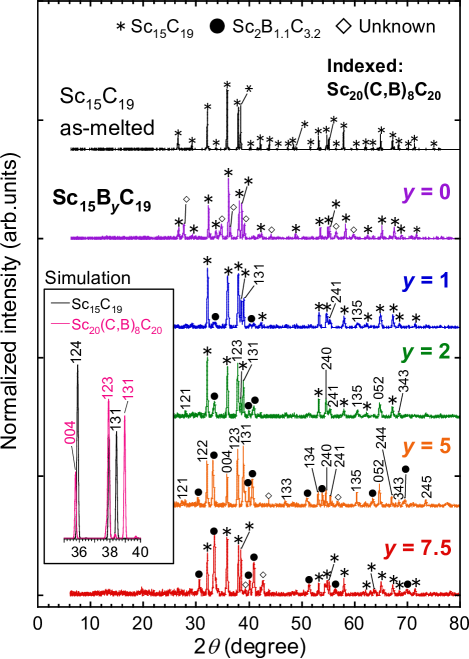
Figure 3 depicts the XRD measurement results of \ceSc15B_yC19 . For comparison, the data of the as-melted \ceSc15C19 before HP synthesis are also shown. The pattern of the sample sintered under HP without B, i.e., the specimen, is found to originate from the \ceSc15C19-type structure, although a few unknown peaks are observed. The peak positions, which were labeled by the \ceSc15C19 phase in the sample, are uniformly shifted slightly to the wide-angle side relative to those of the as-melted compound, corresponding to a 1.4% lattice shrinkage. The addition of B to \ceSc15C19, namely, increasing , affords a gradual change in the XRD pattern. In the samples with , the XRD peaks originating from the \ceSc20(C,B)8C20 structure are observed. Because of the structural similarity between \ceSc15C19 and \ceSc20(C,B)8C20, their XRD patterns are quite similar. To examine the distinctions between the two patterns, we present the enlarged view around the main peak in the inset of Fig. 3. The most significant difference is the position of the (131) peak, which is observed around . In comparison with the case of \ceSc15C19, this peak from the \ceSc20(C,B)8C20 structure shifts to a wider angle. Furthermore, the maximum peak of \ceSc15C19 appears at (124 peak), whereas that of \ceSc20(C,B)8C20 is observed at (123 peak). As increases, the peak intensity of \ceSc20(C,B)8C20 increases relative to that of \ceSc15C19; furthermore, peaks derived from another non-superconducting impurity \ceSc2B_1.1C_3.217 exhibit a gradual strengthening in intensity. At , all of the peaks originating from the \ceSc20(C,B)8C20 structure suddenly disappear, and the XRD pattern can be assigned by \ceSc15C19, \ceSc2B_1.1C_3.2, and unknown phases.
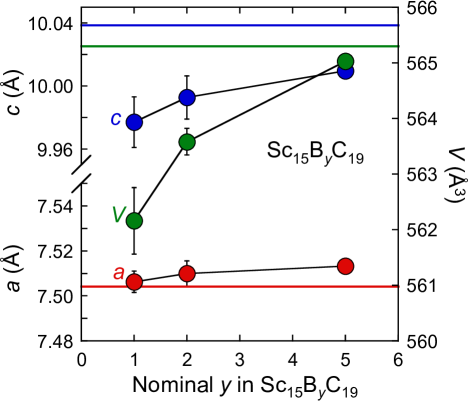
Figure 4 shows the evolution of the cell parameters of \ceSc15B_yC19 as functions of . In the study, the lattice constants were calculated by means of the least-squares method by employing the peaks characterized by the \ceSc20(C,B)8C20 structure. As the nominal increases, the - and -axis lengths are extended slightly by and , respectively, resulting in a expansion of the cell volume . This indicates an increase in the B content in the \ceSc20(C,B)8C20 structure, and the expansion of can be attributed to the difference between the atomic radii of \ceB and \ceC. The cell volume of the sample is comparable with that obtained by arc-melting8.
3.2 Superconductivity
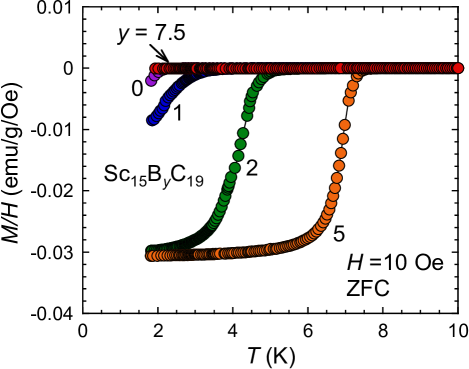
The magnetic susceptibility vs. data are plotted in Fig. 5. A trace of superconductivity is observed at the onset of even in the sample with . This result suggests the formation of the \ceSc20(C,B)8C20 phase devoid of B; however, the origin of this superconductivity is currently unclear, because there is no reproducibility in the presence or absence of superconductivity of the B-free samples. With increase in , increases gradually, and the diamagnetic signal corresponding to the superconducting transition becomes sharper. The maximum of is observed for the specimen, and this value closely agrees with that for the arc-melted \ceSc20(C,B)8C208. For , the curve shows no anomalies down to . Considering that no XRD peaks attributed to the \ceSc20(C,B)8C20 structure are observed, as illustrated in Fig. 3, the superconductivity confirmed in the other samples does not originate from \ceSc15C19, \ceSc2B_1.1C_3.2, nor the unknown phases observed in the XRD data of the sample.
3.3 Structural optimization and enthalpy evaluations
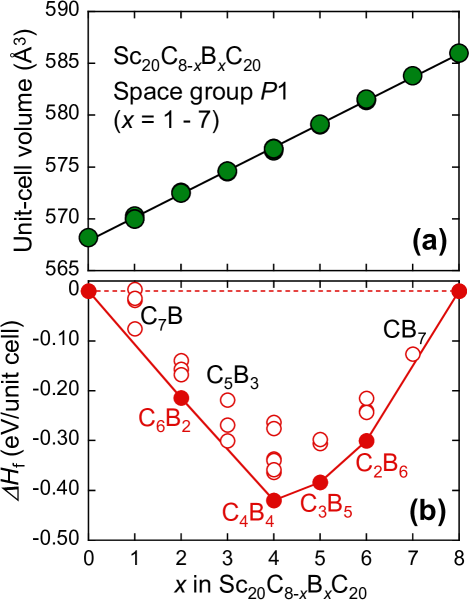
To optimize the \ceSc20C_8-xB_xC20 structure for various values from the computational point of view, we performed ab initio DFT calculations for in increments of one unit. For , the symmetry was intentionally lowered to without changing the basic lattice structure; we employed the structural model where, one by one, C atoms at the site are replaced by B. Figures 6(a) and (b) illustrate the resultant cell volume and the corresponding formation enthalpies per unit cell for each value, respectively. The enthalpy data are plotted as the difference on the basis of those for . Generally, such a plot is referred to as the energy convex hull diagram18, 19. For example, this technique allows us to discuss the phase stability with respect to differences in the content between each in multi-component systems20, 21, 22. In this paper, we examined the most stable B composition in \ceSc20(C,B)8C20 assuming the B-C replacement in the C layer. As plotted in Fig. 6(a), the cell volume expands linearly with increasing , which is qualitatively consistent with the experimental behavior shown in Fig. 4. Meanwhile, in Fig. 6(b), the compositions corresponding and 6 on the convex hull are thermodynamically stable at zero temperature, which means that and 7 affords a relatively metastable or unstable compound. Among these compounds, \ceSc20C4B4C20 with the lowest was considered to be the most stable in this system. Our model construction implies that upon viewing the structure from the -axis, the formation enthalpy becomes higher when the B atoms in the C layer at and 0.75 show a tendency to overlap with each other. This result is probably due to the local stress in the -axis direction arising from the atomic size difference between B and C atoms.
4 Discussion
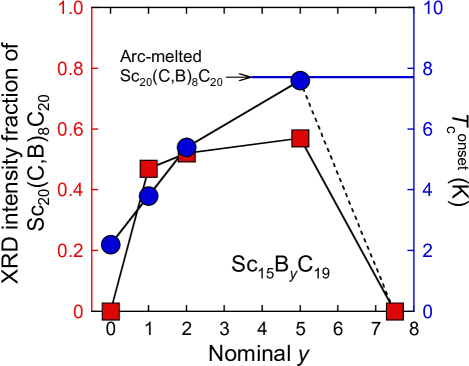
We demonstrated that the \ceSc20C_8-xB_xC20 phase is obtained from with the precise control of using the HP synthesis approach. Although an increase in the nominal value yielded the impurity \ceSc2B_1.1C_3.2, the XRD peak intensity of \ceSc20(C,B)8C20 increased relative to that of \ceSc15C19. Figure 7 depicts the XRD intensity fraction of \ceSc20(C,B)8C20 in the various \ceSc15B_yC19 samples, which was defined by calculating where and represent the (131) peak intensities from \ceSc20(C,B)8C20 and \ceSc15C19, respectively, and corresponds to the maximum peak intensity of the \ceSc2B_1.1C_3.2 phase at around in Fig. 3. The confirmed is also plotted in the figure. Here, it is noteworthy that the nominal on the horizontal axis does not necessarily correspond to in \ceSc20C_8-xB_xC20 because the samples with contain the B-containing secondary phase originating from \ceSc2B_1.1C_3.2. As increases, the fraction and exhibit qualitatively similar trends. At , at which the fraction reaches its maximal value, also exhibits a maximum of . No \ceSc20(C,B)8C20 phase is confirmed in the sample with , which implies the existence of an upper limit value for the formation of this structure.
As mentioned in the introduction, we previously reported that the arc-melted sample may always contain an optimal B content8, because its value does not depend significantly on the starting composition of B. This means that it is reasonable to assume that a sample with similar cell volume and to the arc-melted sample has the optimal value in \ceSc20C_8-xB_xC20. Among the obtained samples in this study, only the sample is found to satisfy this assumption, as depicted in Figs. 4 and 7. When , the resultant XRD pattern nearly conforms with those of the \ceSc20(C,B)8C20 and \ceSc2B_1.1C_3.2 phases, as shown in Fig. 3, which indicates that the reaction between \ceSc15C19 and B with the nominal molar ratio of under HP resulted in these two compounds. Moreover, given the loss-free nature of the starting materials before/after HP synthesis, we can construct the following chemical reaction:
wherein crystal defects such as atomic vacancies are not taken into account. Note that the value and the molar ratio of the products are uniquely calculated, as shown in the above formula. The obtained ratio between \ceSc20C_2.9B_5.1C20 and \ceSc2B_1.1C_3.2 corresponds to a mass ratio of upon applying the molar weight of these compounds, which is roughly compatible with the XRD intensity ratio between and in the sample, as depicted in Fig. 3. Furthermore, regardless of the existence ratio of \ceSc20C_8-xB_xC20 and \ceSc2B_1.1C_3.2, the atomic ratio between Sc and C needs to be maintained throughout the HP synthesis. This presupposition indicates that the value should be in order to coexist with the C-rich impurities, because the C/Sc ratio before the reaction is fixed at , which supports the result of our estimation . Therefore, the actual value in \ceSc20C_8-xB_xC20 was estimated to be about 5; this result moderately agrees with that determined as per the convex hull diagram in Fig. 6. From the optimized starting composition adopted in the arc-melting process, the content of was empirically verified to be less than 28; however, we found that nearly half the B amount was substituted into the C layer ( site).
For the samples with , as shown in Figs. 4 and 5, we observed a systematic decrease both in and values. Although these results suggest the formation of a solid-solution state at the site, we previously reported that is difficult to control even by tuning the nominal B content using the arc-melting method8. From the susceptibility data in Fig. 5, we can confirm the broadening of the superconducting transition with decreasing values, which implies that the decrease in and can be attributed to the formation of an unexpected B-deficient \ceSc20(C,B)8C20 structure stabilized forcibly under HP. To clarify this issue more clearly, further structural studies based on techniques other than X-ray investigations are required.
5 Conclusion
By sintering \ceSc15B_yC19 at high temperature and pressure, we succeeded in synthesizing the \ceSc20C_8-xB_xC20 phase together with \ceSc2B_1.1C_3.2, and we obtained the residual \ceSc15C19 as impurities. Although an increase in up to led to the phase formation of \ceSc20(C,B)8C20 becoming predominant relative to that of \ceSc15C19, the \ceSc20(C,B)8C20 phase suddenly disappeared at , which suggests the existence of an upper limit. Our structural optimization obtained based on DFT calculations afforded a monotonic lattice expansion with increasing , which qualitatively agreed with the experimental behavior. To determine an optimal amount of in \ceSc20C_8-xB_xC20, we assumed that the arc-melted sample contains the optimal value. Our experiments demonstrated that the cell volume and values of the sample are almost equal to those of the melted sample, strongly suggesting that these compounds possess an almost identical chemical composition. We also constructed the chemical reaction scheme of the sample, which revealed that HP synthesis of \ceSc15C19 + 5B yields the \ceSc20C_8-xB_xC20 and \ceSc2B_1.1C_3.2 phases with a molar ratio of . This result is comparable with the existence ratio expected from the experimental XRD pattern. Furthermore, our evaluation of the energy convex hull depending on revealed that the composition of \ceSc20C4B4C20 is the most thermodynamically stable, which is again compatible with the experimentally evaluated .
The authors thank Editage (\urlhttp://www.editage.com) for their English-language editing and reviewing of this manuscript. This work was supported by a Grant-in-Aid for Scientific Research on Innovative Areas “Quantum Liquid Crystals” (KAKENHI Grant No. JP19H05823) from JSPS of Japan.
References
- Bardeen et al. 1957 Bardeen, J.; Cooper, L. N.; Schrieffer, J. R. Theory of Superconductivity. Phys. Rev. 1957, 108, 1175–1204, DOI: 10.1103/PhysRev.108.1175
- Ginzburg 1992 Ginzburg, V. L. Once again about high-temperature superconductivity. Contemp. Phys. 1992, 33, 15–23, DOI: 10.1080/00107519208219137
- Nagamatsu et al. 2001 Nagamatsu, J.; Nakagawa, N.; Muranaka, T.; Zenitani, Y.; Akimitsu, J. Superconductivity at 39 K in magnesium diboride. Nature 2001, 410, 63–64, DOI: 10.1038/35065039
- Kortus et al. 2001 Kortus, J.; Mazin, I. I.; Belashchenko, K. D.; Antropov, V. P.; Boyer, L. L. Superconductivity of Metallic Boron in . Phys. Rev. Lett. 2001, 86, 4656–4659, DOI: 10.1103/PhysRevLett.86.4656
- Drozdov et al. 2015 Drozdov, A. P.; Eremets, M. I.; Troyan, I. A.; Ksenofontov, V.; Shylin, S. I. Conventional superconductivity at 203 kelvin at high pressures in the sulfur hydride system. Nature 2015, 525, 73
- Drozdov et al. 2019 Drozdov, A. P.; Kong, P. P.; Minkov, V. S.; Besedin, S. P.; Kuzovnikov, M. A.; Mozaffari, S.; Balicas, L.; Balakirev, F. F.; Graf, D. E.; Prakapenka, V. B.; Greenberg, E.; Knyazev, D. A.; Tkacz, M.; Eremets, M. I. Superconductivity at 250 K in lanthanum hydride under high pressures. Nature 2019, 569, 528–531, DOI: 10.1038/s41586-019-1201-8
- Somayazulu et al. 2019 Somayazulu, M.; Ahart, M.; Mishra, A. K.; Geballe, Z. M.; Baldini, M.; Meng, Y.; Struzhkin, V. V.; Hemley, R. J. Evidence for Superconductivity above 260 K in Lanthanum Superhydride at Megabar Pressures. Phys. Rev. Lett. 2019, 122, 027001, DOI: 10.1103/PhysRevLett.122.027001
- Ninomiya et al. 2019 Ninomiya, H.; Oka, K.; Hase, I.; Kawashima, K.; Fujihisa, H.; Gotoh, Y.; Ishida, S.; Ogino, H.; Iyo, A.; Yoshida, Y.; Eisaki, H. Superconductivity in a Scandium Borocarbide with a Layered Crystal Structure. Inorg. Chem. 2019, 58, 15629–15636, DOI: 10.1021/acs.inorgchem.9b02709
- Jedlicka et al. 1971 Jedlicka, H.; Nowotny, H.; Benesovsky, F. Zum System Scandium-Kohlenstoff, 2. Mitt.: Kristallstruktur des C-reichen Carbids. Monatsh. Chem. 1971, 102, 389–403, DOI: 10.1007/BF00909332
- Momma and Izumi 2011 Momma, K.; Izumi, F. VESTA3 for three-dimensional visualization of crystal, volumetric and morphology data. J. Appl. Cryst. 2011, 44, 1272–1276, DOI: 10.1107/S0021889811038970
- Sluiter et al. 2006 Sluiter, M. H. F.; Colinet, C.; Pasturel, A. Ab initio calculation of the phase stability in Au-Pd and Ag-Pt alloys. Phys. Rev. B 2006, 73, 174204, DOI: 10.1103/PhysRevB.73.174204
- 12 Dassault Systèmes Americas Corp., BIOVIA Materials Studio Reflex website. \urlhttps://www.3dsbiovia.com/products/collaborative-science/biovia-materials-studio/analytical-and-crystallization-software.html, (accessed 4 June, 2020)
- Vanderbilt 1990 Vanderbilt, D. Soft self-consistent pseudopotentials in a generalized eigenvalue formalism. Phys. Rev. B 1990, 41, 7892–7895, DOI: 10.1103/PhysRevB.41.7892
- Clark et al. 2005 Clark, S.; Segall, M.; Pickard, C.; Hasnip, P.; Probert, M.; Refson, K.; Payne, M. First principles methods using CASTEP. Z. Kristallogr. 2005, 220, 567, DOI: 10.1524/zkri.220.5.567.65075
- Perdew et al. 1996 Perdew, J. P.; Burke, K.; Ernzerhof, M. Generalized Gradient Approximation Made Simple. Phys. Rev. Lett. 1996, 77, 3865–3868, DOI: 10.1103/PhysRevLett.77.3865
- Monkhorst and Pack 1976 Monkhorst, H. J.; Pack, J. D. Special points for Brillouin-zone integrations. Phys. Rev. B 1976, 13, 5188–5192, DOI: 10.1103/PhysRevB.13.5188
- Shi et al. 1999 Shi, Y.; Leithe-Jasper, A.; Bourgeois, L.; Bando, Y.; Tanaka, T. Sc2B1.1C3.2, a New Rare-Earth Boron Carbide with Graphite-like Layers. J. Solid State Chem. 1999, 148, 442 – 449, DOI: https://doi.org/10.1006/jssc.1999.8477
- Joseph et al. 2017 Joseph, A.; Sands, C. M.; Hicks, P. D.; Chandler, H. W. Convex hull method for the determination of vapour-liquid equilibria (VLE) phase diagrams for binary and ternary systems. Fluid Phase Equilib. 2017, 431, 34 – 47, DOI: https://doi.org/10.1016/j.fluid.2016.09.024
- Schawe et al. 2017 Schawe, H.; Hartmann, A. K.; Majumdar, S. N. Convex hulls of random walks in higher dimensions: A large-deviation study. Phys. Rev. E 2017, 96, 062101, DOI: 10.1103/PhysRevE.96.062101
- Burton and Walsh 2012 Burton, L. A.; Walsh, A. Phase Stability of the Earth-Abundant Tin Sulfides SnS, SnS2, and Sn2S3. J. Phys, Chem. C 2012, 116, 24262–24267, DOI: 10.1021/jp309154s
- Troparevsky et al. 2015 Troparevsky, M. C.; Morris, J. R.; Kent, P. R. C.; Lupini, A. R.; Stocks, G. M. Criteria for Predicting the Formation of Single-Phase High-Entropy Alloys. Phys. Rev. X 2015, 5, 011041, DOI: 10.1103/PhysRevX.5.011041
- Flores-Livas et al. 2016 Flores-Livas, J. A.; Amsler, M.; Heil, C.; Sanna, A.; Boeri, L.; Profeta, G.; Wolverton, C.; Goedecker, S.; Gross, E. K. U. Superconductivity in metastable phases of phosphorus-hydride compounds under high pressure. Phys. Rev. B 2016, 93, 020508, DOI: 10.1103/PhysRevB.93.020508