A revision of the vdB 130 cluster stellar content based on GAIA DR2 Data. Interstellar extinction toward the Cyg OB1 supershell.
Abstract
Two star-forming regions are studied: the young embedded open cluster vdB 130 and the protocluster neighbourhood observed in the head and tail of the cometary molecular cloud located in the wall of the expanding supershell surrounding the Cyg OB1 association. The GAIA DR2 catalogue is employed to verify the stellar composition of the vdB 130 cluster whose members were earlier selected using the UCAC4 catalogue. The new sample of vdB 130 members contains 68 stars with close proper motions (within 1 mas yr-1) and close trigonometric parallaxes (ranging from 0.50 to 0.70 mas). The relative parallax error is shown to increase with distance to objects and depend on their magnitude. At a distance of 1.5–2 kpc it is of about 3–7 per cent and 20–30 per cent for bright and faint stars, respectively. The cluster is not older than 10 Myr. New spectroscopic and photometric observations carried out on Russian telescopes are combined with GAIA DR2 to search for optical components in the protocluster region – a new starburst. An analysis of 20 stars in the vicinity of the protocluster revealed no concentration of either proper motions or parallaxes. According to spectroscopic, photometric, and trigonometric estimates, the distances to these stars range from 0.4 to 2.5 kpc, and colour excess is shown to increase with a distance (kpc) in accordance with the law: mag.
keywords:
open clusters and associations: individual: vdB 130 – dust, extinction – stars: distances – ISM: clouds – infrared: ISM reddening – stars: protostars1 Introduction
Nowadays it is well established that star formation could be regulated by many factors like turbulence, feedback from outflows, supernova explosions and expanding Hii regions (e.g., see review by Elmegreen, 1998, 2010). These and other factors work together sculpting a fine structure of molecular clouds with filaments, pillars, blobs, peppered with young stellar objects (YSOs) in the rims of expanding bubbles. A growing number of observational works supports the idea of sequential and triggering star formation on both local and global scales (e.g., , 2006; Deharveng et al., 2010; Dale et al., 2015; Egorov et al., 2017, among many others). Given complexity of the process, along with large-scale studies, a detailed look at some specific objects and regions can be useful for distinguishing between general and particular features of the star formation process.
The aim of this work is to continue the study of star formation regions in the walls of an expanding supershell formed by the wind and the UV radiation of stars in the Cyg OB1 association. We present an investigation of the stellar content of the cluster vdB 130 and of optical counterparts of the protocluster using the new catalogue GAIA DR2 (Gaia Collaboration 2018111VizieR On-line Data catalogue:I/345/gaia2)
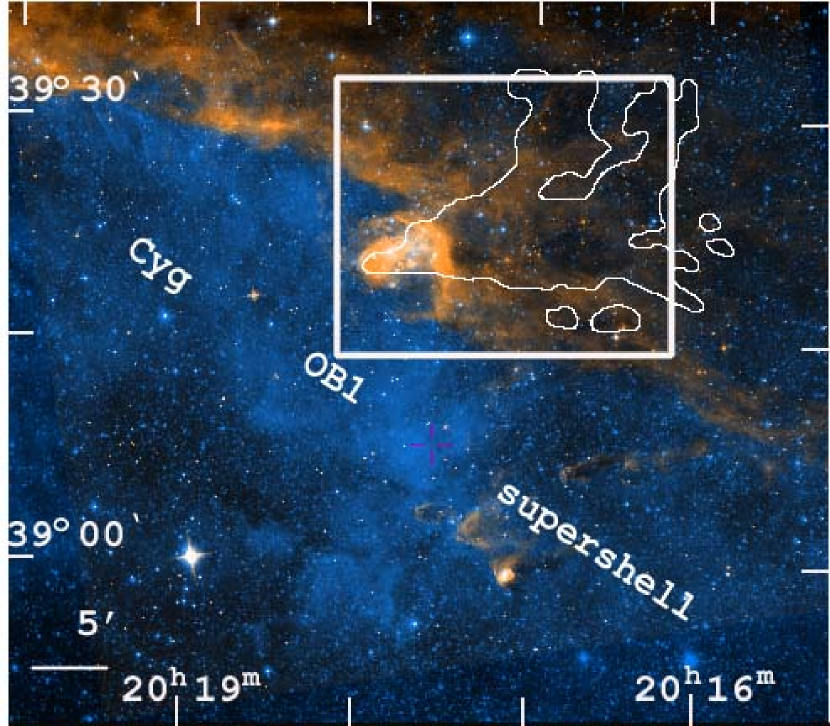
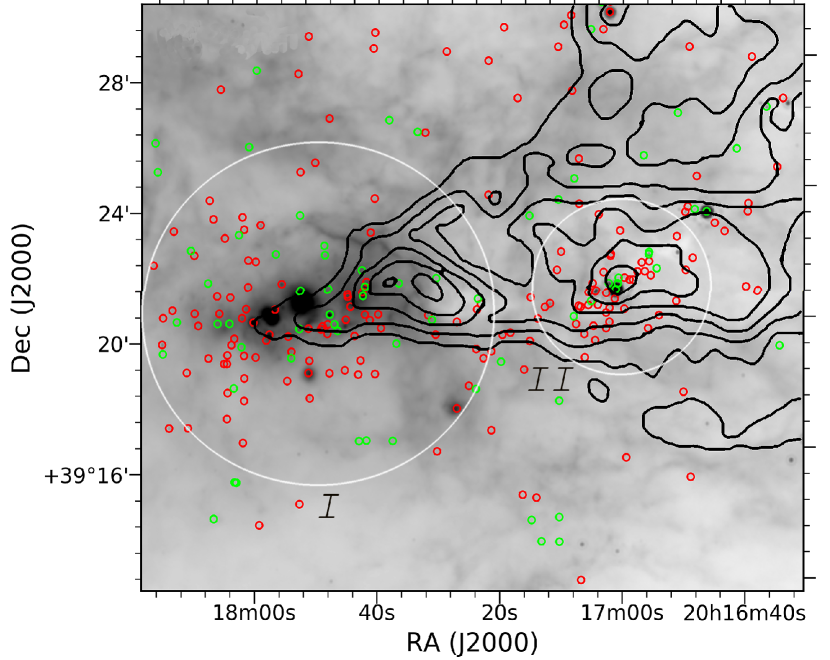
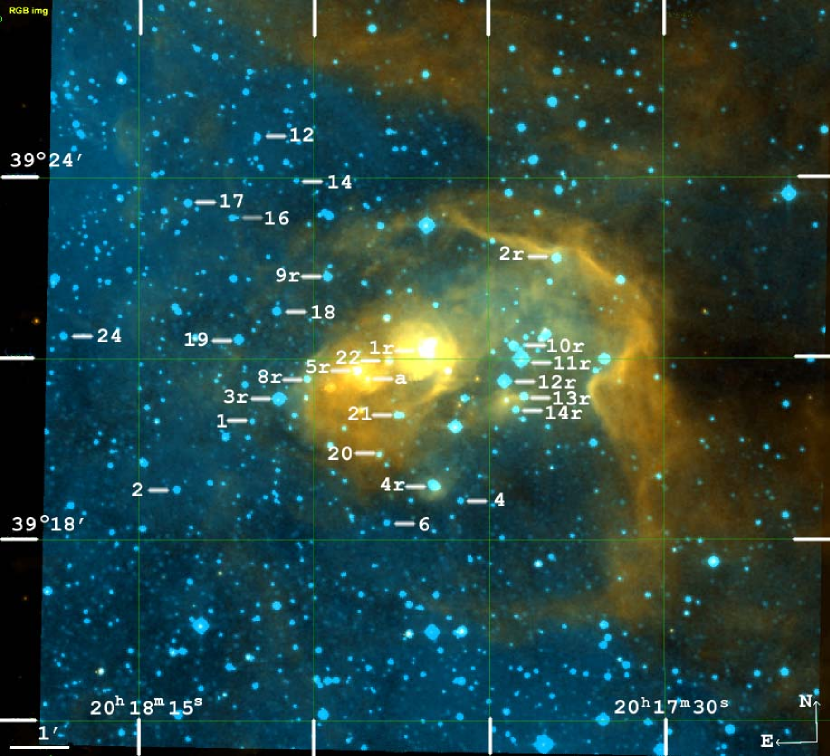
We have already partially studied the region of ongoing star formation in the supershell related to the cometary molecular cloud (pillar)(Sitnik et al. 2015, 2019, hereinafter referred to as Paper I and Paper II, and 2016). This region () resides in the wall of the expanding supershell surrounding the Cyg OB1 stellar association (Fig.1,top). The Cyg OB1 association includes at least 50 OB stars (Humpreys & McElroy, 1984). The size of the supershell driven by this association is . In the supershell region mentioned above a cometary molecular cloud is observed (Schneider et al., 2007). It is associated with two sites of star formation: the young embedded cluster vdB 130 in the head and a compact protocluster in the tail (Fig.1, bottom). We found this protocluster in a dense condensation of the cloud and described it in Paper II (see fig. 11 in Paper II). The cloud is extended toward the illuminating source, i.e., toward the nearest OB stars of the Cyg OB1 association. The molecular cloud has a size of 0.4 degrees or 12 pc at the adopted distance of kpc to the cluster and association. The vdB 130 cluster has 44 members selected based on UCAC4 proper motions. They are listed in table 2 in Paper I. The physical connection of the Cyg OB1 association, supershell, and vdB 130 cluster, and the cloud follows from the distance estimates, measured radial velocities, and a number of indirect factors (Paper I). The age of vdB 130 was estimated as 5–10 Myr. According to near-IR data, the true distance modulus to the cluster, its minimum colour excess, and distance are equal to mag, mag, and about 1.8 kpc, respectively. The interstellar extinction law inside the cluster region differs significantly from the normal law, with reaching values of . On the other hand, the normal law is valid in front of the cluster (, 2016). Some cluster stars are located in the centres of dust clumps inside the IR shell.
We use the data from GAIA DR2 (Gaia Collaboration 2018)to analyse the star membership in two groupings in the supershell surrounding the Cyg OB1 association – in the cluster vdB 130 and in the protocluster. The embedded cluster vdB 130 was initially identified by Racine (1974) as a group of 14 B-type stars. We added another 30 stars with close proper motions from the UCAC4 catalogue (in terms of the accuracy of the UCAC4 catalogue) (Paper I). However, the GAIA DR2 catalogue allows us to appreciably refine the selection of stars both by proper motions and distances. It is especially important for objects observed toward the Cygnus arm, because the proper motions due to the differential rotation of the Galaxy vary slightly with distance.
We also performed optical and infrared photometric and spectroscopic observations on Russian telescopes in order to clarify the spectral classification of stars, study the spectral energy distribution, and estimated the value of interstellar extinction.
In this paper we use new observational data, as well as archival data from the GAIA DR2 catalogue in order to verify the vdB 130 cluster earlier studied using UCAC4 proper motions and search for possible optically visible member stars of the protocluster. We use our data to study interstellar extinction toward the supershell formed by Cyg OB1 stars. Section 2 describes the instruments and data reduction process employed for spectroscopic and photometric observations. Section 3 analyses the line-of-sight distribution of vdB 130 stars and potential members of the optical component of the protocluster (using GAIA DR2 catalogue). In the same section we estimated the age of the cluster using stars with a known spectral classification (, 2016). Section 4 presents the results of the spectral classification of stars seen toward the protocluster and colour excess estimates. In section 5 interstellar extinction toward the cometary molecular cloud is analysed using GAIA DR2 results among other data. Section 6 summarizes the results of the study.
2 Observations and data reduction.
This study is based on optical and near-IR observations performed with the 6-m telescope of Special Astrophysical Observatory of Russian Academy of Sciences (SAO RAS), 2.5-m telescope of Caucasian Mountain Observatory of Sternberg Astronomical Institute of M.V. Lomonosov Moscow State University (SAI MSU) and 60-cm telescope of the Crimean Astronomical Station of SAI MSU. The archival data obtained with Spitzer and GAIA (DR2) space observatories were also used. Below we present a description of the observations and data reduction. The log of our observations is given in Table 1, where the exposure time, , the field of view (FOV), the final angular resolution, , the final spectral resolution, , and the bandwidth (FWHM) of the used filter are indicated.
| Instrument | Slit/filters (stars) | Date | ,′′ | |
|---|---|---|---|---|
| SCORPIO | #1 (6, 7, 12, 23) | 2017 Jul 28 | 180 | 1.8 |
| SCORPIO | #2 (2,9,17, 22) | 2017 Jul 28 | 240 | 1.8 |
| SCORPIO | #3 (5, 13) | 2017 Jul 28 | 180 | 1.5 |
| SCORPIO | #4 (3, 8, 10) | 2017 Jul 28 | 1320 | 1.5 |
| SCORPIO | #5 (15, 19, 21) | 2017 Jul 30 | 1800 | 3.0 |
| SCORPIO | #6 (11, 18) | 2017 Jul 31 | 1200 | 3.0 |
| SCORPIO | #7 (13, 14, 20) | 2017 Jul 31 | 791 | 3.0 |
| ASTRONIRCAM | 2016 Sep 17 | 40 | 0.8 | |
| CCD photometer | 2018 Aug 05 | 600 | 1.2 |
2.1 Spectroscopic observations and data reduction.
Spectroscopic observations on the 6-m telescope of SAO RAS were performed using SCORPIO multimode focal reducer (Afanasiev & Moiseev, 2005) operating in the long-slit spectroscopy mode. We used the slit of the 1 arcsec width and 6.1 arcmin length. The scale along the slit was 0.36 arcsec per pixel. The spectra were registered with EEV 42-40 CCD using VPHG550G prism as the dispersing element, which provided a spectroscopic resolution of Å (measured as FWHM of the air-glow lines) in the Å wavelength interval. We acquired spectra of stars and of the surrounding interstellar medium in the protocluster region at seven different slit positions; the information about all the obtained data is summarized in Table 1. Each slit passed through 2–4 stars of our interest (their names according to Fig 2 are given in parenthesis near the slit’s number). The observations with first three slit positions were performed with short exposures because the stars crossed by the slit were bright. We reduced the data using standard procedures realized in idl pipeline developed at the SAO RAS for analysing the data acquired with SCORPIO spectrograph. The data reduction included bias subtraction, flat-field and line-curvature correction, wavelength calibration, and subtraction of night sky lines. A He-Ne-Ar lamp served as the source of the comparison spectrum for deriving the dispersion curve, and the spectrophotometric standard stars BD+25d4655 and BD+33d2642 observed at similar zenith angles before and after the object were used to calibrate the spectra. Unfortunately, spectrophotometric standard for slits 6 and 7 (stars 11, 13, 14, 18 and 20, see Fig 2) could not be observed because of weather conditions during the last night. In current analysis we were interested in relative flux calibration only, so for these spectra we used the sensitivity curve based on the data obtained during the previous night.
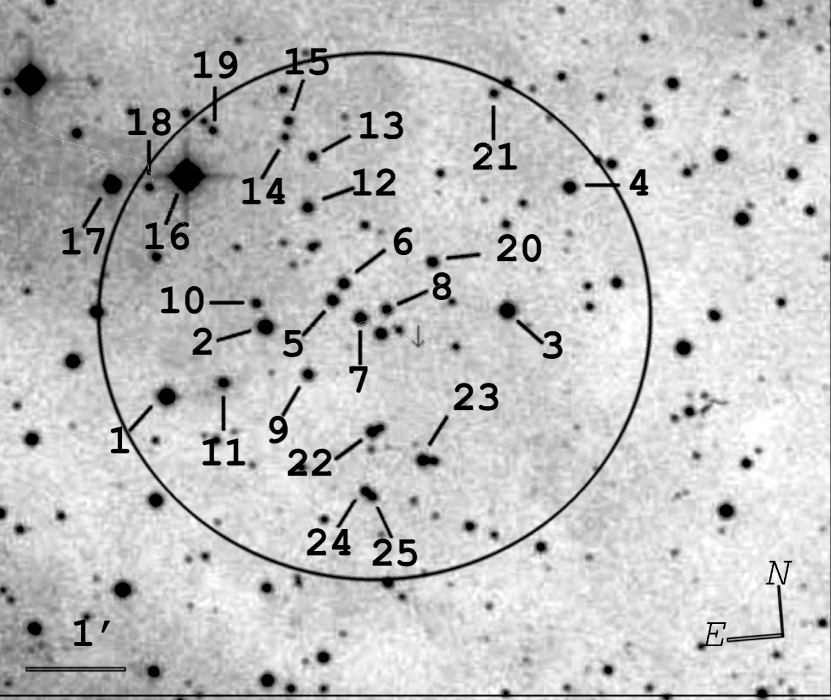
We analysed the spectra of stars observed in the neighbourhood of the protocluster (Fig.2) in order to determine their spectral types and, in some cases, also the luminosity classes . The procedure of the determination of stellar parameters consisted of three stages. At the first stage the spectral types of stars were estimated using the methods described by Gray & Corbally (2009). We used continuum-normalized spectra of MK standards from the same source. We divided the spectrum by a fifth-degree polynomial describing the form of the continuum spectrum of the object. Then we compared it with the spectra of MK standards. However, in the case of late- (M and K) type stars, whose spectra exhibit strong molecular bands, we compared the spectrum of the object with that of the standard directly without normalizing the object spectrum to the continuum. Our spectroscopic data do not allow the luminosity class to be estimated with sufficient precision except for late-type stars. Therefore we assumed, to a first approximation, that the stars studied are of luminosity class V except for star 17 (Fig.2, see also Section 4), which can be already classified as having luminosity class III. (We will later verify the luminosity class using photometric data and the distances inferred from GAIA DR2 trigonometric parallaxes.) The low spectral resolution and low signal-to-noise ratio of our observations make it also impossible to study the peculiarities of the chemical composition. We assumed in all cases that the objects studied match standard stars with no chemical anomalies. The only exceptions are stars 12 and 14 ( Fig.2, see also Section 4). Thus the Ca ii line in the spectrum of star 12 is significantly weaker than expected for stars of the same spectral type, whereas the spectrum of star 14 exhibits bright Eu ii 6049.5 Å line (see below).
At the second stage we determined the colour excess based on the spectral type estimated at the previous stage and the observed colour index . We adopt the intrinsic optical and IR colour indices from Straizys (1992) and used the intrinsic colour index to calculate the colour index assuming normal interstellar extinction law. If all the assumptions are true then the calculated colour index must coincide with the observed colour index .
| Star # | , mag | , mag | , mag | , mag | , mag | , mag | plx, mas | D, kpc | , mas/yr | , mas/yr |
|---|---|---|---|---|---|---|---|---|---|---|
| 1 | 12.418 | 11.445 | 11.268 | 11.209 | ||||||
| 2 | 13.201 | 12.118 | 11.896 | 11.762 | ||||||
| 3 | 12.940 | 12.203 | 11.939 | |||||||
| 4 | 14.314 | 13.110 | 12.683 | |||||||
| 5 | 14.676 | 13.562 | 13.199 | 13.111 | ||||||
| 6 | 14.884 | 13.500 | 12.973 | 12.839 | ||||||
| 7 | 14.391 | 13.350 | 13.029 | 12.926 | ||||||
| 8 | 15.466 | 14.017 | 13.623 | 13.447 | ||||||
| 9 | 15.266 | 14.084 | 13.717 | 13.663 | ||||||
| 10 | 15.901 | 14.286 | 13.913 | 13.725 | ||||||
| 11 | 15.427 | 12.356 | 11.440 | 10.804 | ||||||
| 12 | 15.240 | 13.726 | 13.390 | 13.238 | ||||||
| 13 | 15.920 | 14.481 | 14.093 | 13.966 | ||||||
| 14 | 16.891 | 13.434 | 12.707 | 12.228 | ||||||
| 15 | 15.966 | 13.905 | 13.262 | 13.020 | ||||||
| 16 | 10.304 | |||||||||
| 17 | 12.364 | 9.849 | ||||||||
| 18 | 16.216 | 14.661 | 14.210 | 14.042 | ||||||
| 19 | 16.436 | 14.204 | 13.570 | 13.337 | ||||||
| 20 | 15.142 | 13.787 | 13.341 | 13.176 | ||||||
| 21 | 16.530 | 14.854 | 14.237 | |||||||
| 22 | 14.893 | 13.414 | 12.949 | |||||||
| 23 | 14.627 | 13.536 | 13.183 | |||||||
| 24 | 15.633 | 14.166 | 13.710 | |||||||
| 25 | 15.587 | 14.461 | 14.038 |
2.2 Photometric observations.
We carried out BVRc photometry observations of 25 stars in the protocluster region (Fig.2) with Apogee Aspen CG-42 camera (image scale 0.37 arcsec pix-1, field of view 12.6 arcmin) attached to the 60-cm telescope of the Crimean Astronomical Station of SAI MSU. The standards employed were 11–15 mag field stars with photometry errors smaller than 0.05 mag. We adopted the B, V, g’, r’, and i’-band magnitudes of these stars from the APASS catalogue222VizieR On-line Data catalogue:II/336 and used the colour equations from Jordi et al. (2006) to transform APASS data to the -band filter. We performed the relative photometry of all selected standard stars with respect to each other. The accuracy of the resulting mutual calibration is better than 0.01 mag.
To obtain -band data in the Mauna Kea Observatory (MKO) system, we observed our stars with ASTRONIRCAM IR camera of the 2.5-m telescope of the Caucasian Mountain Observatory of SAI MSU (, 2017). The field of view of the camera has a size of 4.6 arcmin and the image scale is 0.27 arcsec pix-1. The standards employed were field stars fainter than 10 mag whose 2MASS magnitudes have errors smaller than 0.05 mag. We transformed the 2MASS data to MKO magnitudes using the colour equations from Leggett et al. (2006). Observations were performed using the dithering method, with the telescope shifting between individual frames by arcsec. Each frame was corrected for non-linearity, dark current and flat field. We reduced both optical and IR frames using aperture photometry technique and standard astrometry.net (Lang et al., 2010) and photutils333https://photutils.readthedocs.io/en/stable/ software suites. We chose the aperture size to be FWHM ( arcsec). In Table 2 (columns 2–7) we present the results of our photometry of the stars marked in Fig.2. The accuracy of -band photometry is better than 0.03 mag for stars brighter than 17.5 mag with the error amounting to 0.1 mag for 19-mag stars. The accuracy of -band photometry is better than 0.02 mag. Stars 16 and 17 (see Section 4) proved to be too bright for ASTRONIRCAM, and we therefore use transformed 2MASS data for these objects. We could not acquire -band photometry for some of the stars. In these cases we also used transformed 2MASS data (marked by subscript index ‘2’ in the Table 2). Columns 8–11 give the trigonometric parallaxes of the stars, the corresponding distances, and the proper motions of stars according to GAIA DR2 data.
2.3 Archival data
In this study we also use G, BP and RP band photometric data, colour excesses , trigonometric parallaxes, and proper motions from GAIA DR2 catalogue. We also applied the systematic correction to trigonometric parallaxes, which we assumed to be equal to +45 microarcseconds as estimated, e.g., from open clusters (2018; see also Groenewegen 2018). The exact value of this correction is not very important for the distances considered, 1.5–2 kpc: its relative contribution does not exceed 8–10 per cent.
3 Analysis of GAIA DR2 data for stars seen toward the molecular cloud.
We use the data of GAIA DR2 catalogue to study optical objects in star-forming regions located in the cometary molecular cloud, namely, in the region of vdB 130 cluster and the protocluster (Fig.1, bottom).
3.1 The open cluster vdB 130.
The vdB 130 cluster was initially identified by Racine (1968, 1974) as a compact group of B-type stars with a size of about 6 arcmin. In Paper I we analysed UCAC4 proper motions of stars in this region and found that the proper motions of 44 of 175 stars located inside the 6-arcmin radius region centred on , differ by less than 6 mas yr-1 (see fig. 3 and table 2 in Paper I). However, recall that vdB 130 is located in the Cygnus arm and is observed in the direction of Galactic longitude of . Therefore the stellar proper motions due to differential rotation of the Galaxy vary slightly with distance. That is why we decided to identify cluster members based on the proximity of not only the GAIA DR2 proper motions but also of GAIA DR2 trigonometric parallaxes.
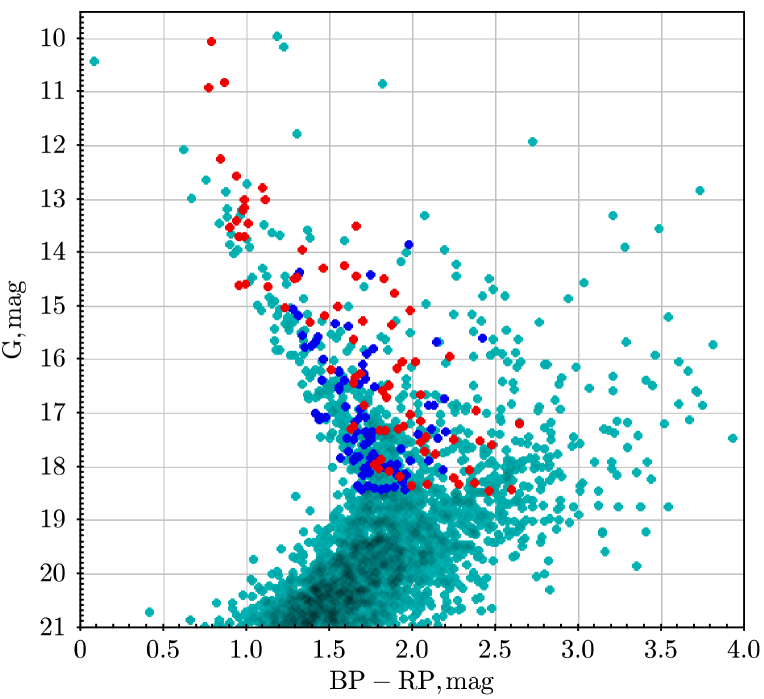
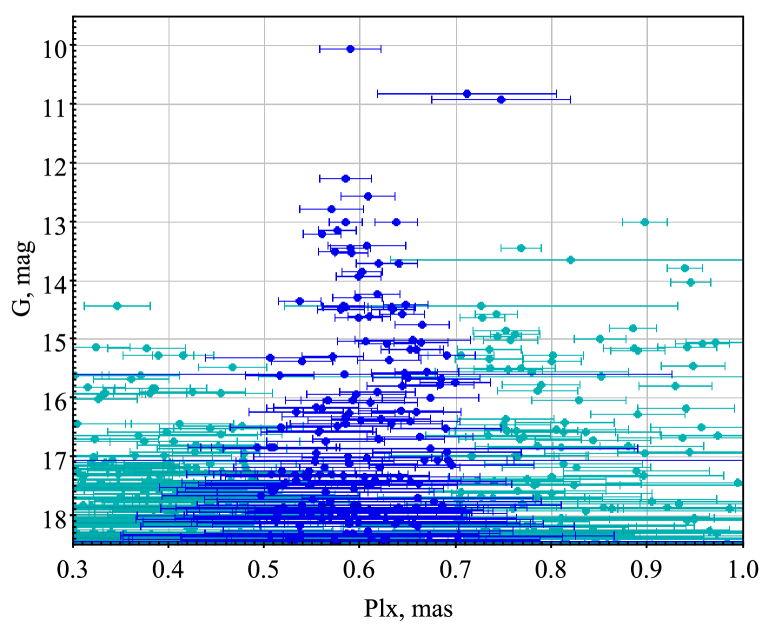
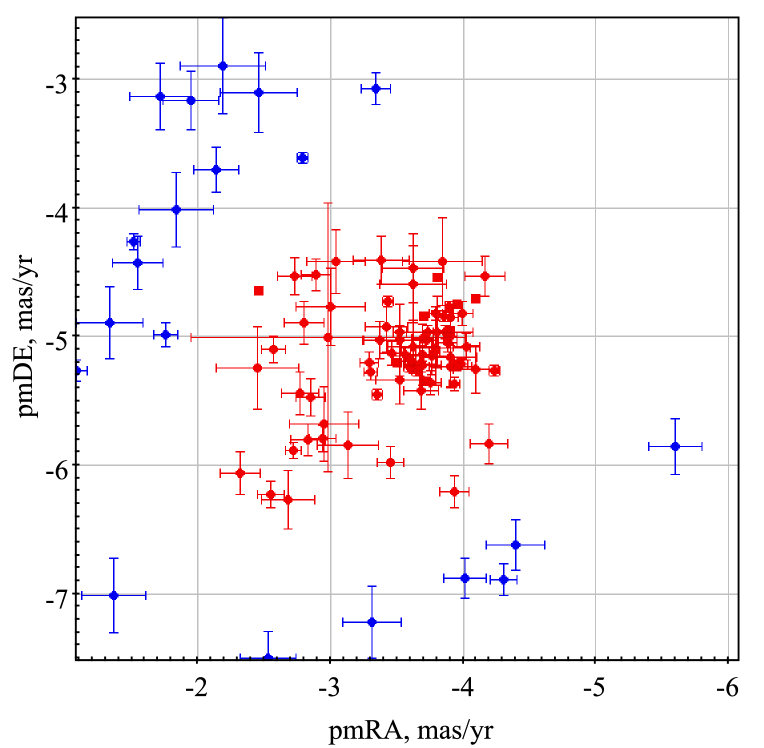
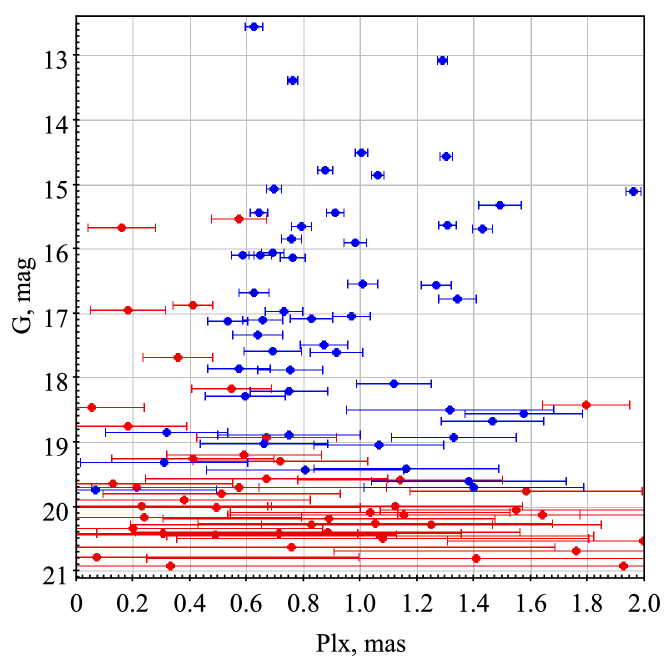
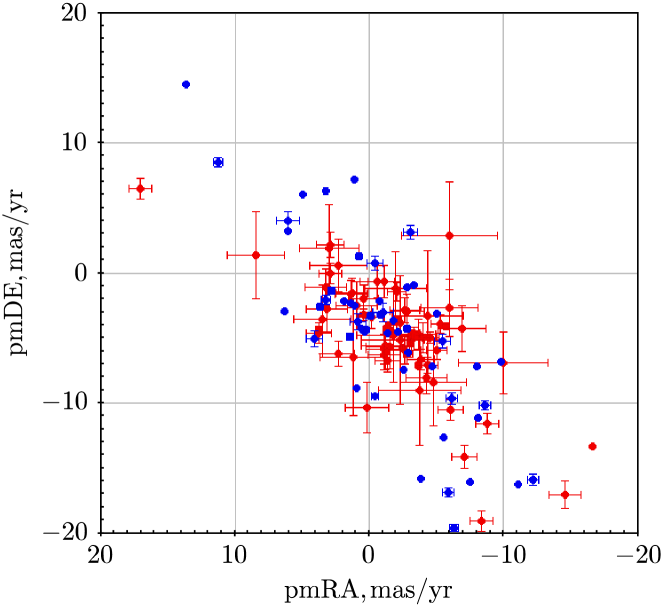
Top panel in Fig. 3 show the CMD (BP-RP) – G for all stars in the 6-arcmin cone region (see Paper I) centred on , . In this region there are 3370 GAIA DR2 stars. However, stars of the Cyg OB1 association also project onto this area. Central panel on Fig. 3 shows GAIA DR2 parallaxes vs. G-band magnitudes for all stars observed in this area. The stars in the narrow parallax interval from 0.5 to 0.7 mas (i.e., with distances ranging from 1.5 to 2.0 kpc) are marked by dark blue dots, with appropriate error bars. The bottom panel in Fig. 3 shows the two-dimensional proper-motion diagram for selected stars with close parallaxes. Probable cluster members with close parallax and proper motion values are marked by red dots; proper motions errors are also shown. Note that the proper motions differ by no more than 1 mas yr-1 from the centroid of proper motions. Probable cluster members and stars with close parallaxes are also shown on top panel of Fig. 3.
The parallax interval selected above corresponds to the distance interval from 1.5 to 2 kpc, which agrees well with the IR-data based cluster distance estimate reported in Paper I. In Fig. 3, bottom concentration of proper motions to the centroid with mas yr-1 is immediately apparent, and this agrees well with our results based on UCAC4 catalogue (Paper I) and on an appreciably smaller number of stars.
The proper-motion centroid in the Galactic coordinate system is located at mas yr-1. The cluster obviously moves predominantly along the Galactic plane with residual velocity of about km s-1, i.e., toward the Galactic center (after subtracting the contribution of differential rotation and solar motion in accordance with the rotation curve based on maser sources, see Rastorguev et al. 2017). Note that stars which were selected based on the proximity of their parallaxes and proper-motion components lie along the apparent main sequence in the colour–magnitude diagram (CMD) (Fig. 3, top). Thus this fact further corroborates the existence of a stellar cluster in this region.
| Source ID | RA (J2000) | DEC (J2000) | Plx | e_Plx | pmRA | e_pmRA | pmDE | e_pmDE | G | BP-RP | Dist | N |
|---|---|---|---|---|---|---|---|---|---|---|---|---|
| mas | mas | mas/yr | mas/yr | mas/yr | mas/yr | mag | mag | kpc | ||||
| 2061381510912036736 | 20 17 45.3942 | 39 22 50 | 0.4611 | 0.1158 | -3.380 | 0.206 | -4.408 | 0.191 | 17.520 | 2.412 | 2.07 | 37 |
| 2061377014100944000 | 20 18 00.4084 | 39 17 21 | 0.4658 | 0.1457 | -3.628 | 0.229 | -4.465 | 0.272 | 18.078 | 1.858 | 2.06 | 38 |
| 2061474591441143552 | 20 18 13.7550 | 39 24 57 | 0.4660 | 0.0937 | -3.426 | 0.161 | -4.922 | 0.192 | 17.548 | 2.051 | 2.04 | 39 |
| 2061471159769307008 | 20 18 20.1225 | 39 20 49 | 0.4739 | 0.0768 | -2.728 | 0.131 | -4.533 | 0.143 | 17.245 | 1.651 | 2.00 | 40 |
| 2061380484434531072 | 20 18 02.3379 | 39 20 30 | 0.4766 | 0.1087 | -4.098 | 0.170 | -5.257 | 0.183 | 17.450 | 2.081 | 2.00 | 41 |
| 2061474801901596928 | 20 18 10.9328 | 39 25 22 | 0.4865 | 0.0854 | -4.195 | 0.143 | -5.833 | 0.152 | 17.310 | 1.804 | 1.96 | 42 |
| 2061380686280218240 | 20 17 52.6544 | 39 21 09 | 0.4919 | 0.1657 | -3.806 | 0.275 | -4.964 | 0.276 | 18.196 | 2.253 | 1.98 | 43 |
| 2061380170883177472 | 20 17 43.5947 | 39 19 41 | 0.4936 | 0.1857 | -3.849 | 0.299 | -4.419 | 0.343 | 18.324 | 2.091 | 1.99 | 44 |
| 2061474355224990080 | 20 18 09.9918 | 39 22 23 | 0.5014 | 0.0762 | -3.369 | 0.133 | -5.029 | 0.143 | 17.236 | 1.948 | 1.90 | 45 |
| 2061380621873493376 | 20 17 55.3558 | 39 20 37 | 0.5088 | 0.0790 | -3.684 | 0.127 | -5.422 | 0.141 | 16.946 | 2.386 | 1.87 | a |
| 2061471430341784704 | 20 18 15.8012 | 39 22 27 | 0.5095 | 0.0444 | -3.293 | 0.071 | -5.200 | 0.081 | 16.158 | 1.912 | 1.86 | 46 |
| 2061381034190368256 | 20 17 41.9580 | 39 20 21 | 0.5156 | 0.0201 | -3.951 | 0.030 | -4.747 | 0.031 | 13.204 | 0.981 | 1.84 | 13r |
| 2061474561383424000 | 20 18 12.7681 | 39 24 14 | 0.5158 | 0.1534 | -3.523 | 0.275 | -5.025 | 0.275 | 18.056 | 2.347 | 1.89 | 47 |
| 2061380415715060352 | 20 17 55.9067 | 39 20 07 | 0.5176 | 0.0942 | -4.163 | 0.147 | -4.529 | 0.153 | 17.194 | 2.645 | 1.85 | 48 |
| 2061380617558827520 | 20 17 53.1780 | 39 20 17 | 0.5190 | 0.1136 | -3.527 | 0.179 | -5.334 | 0.187 | 17.597 | 2.481 | 1.86 | 49 |
| 2061380003398199424 | 20 17 49.7267 | 39 18 07 | 0.5208 | 0.0439 | -3.887 | 0.072 | -5.052 | 0.077 | 16.031 | 1.944 | 1.82 | 50 |
| 2061380553146297728 | 20 18 01.4642 | 39 20 54 | 0.5243 | 0.1177 | -3.620 | 0.189 | -5.081 | 0.203 | 17.772 | 2.138 | 1.84 | 51 |
| 2061381102909847424 | 20 17 42.8620 | 39 21 11 | 0.5256 | 0.0331 | -3.794 | 0.053 | -4.819 | 0.053 | 12.776 | 1.099 | 1.81 | 10r |
| 2061380381355314432 | 20 18 01.6577 | 39 20 02 | 0.5258 | 0.0324 | -3.900 | 0.050 | -5.001 | 0.053 | 15.291 | 1.389 | 1.81 | 52 |
| 2061381613991824256 | 20 17 56.7649 | 39 23 28 | 0.5303 | 0.6052 | -2.980 | 1.030 | -5.007 | 1.049 | 18.443 | 2.464 | 2.16 | 53 |
| 2061381343428026112 | 20 17 39.2038 | 39 22 38 | 0.5307 | 0.0194 | -3.803 | 0.034 | -4.538 | 0.031 | 13.145 | 0.990 | 1.79 | 2r |
| 2061380037757937280 | 20 17 53.7773 | 39 19 13 | 0.5312 | 0.0532 | -3.458 | 0.092 | -5.131 | 0.097 | 16.479 | 1.862 | 1.79 | 54 |
| 2061381034190366208 | 20 17 42.6727 | 39 20 07 | 0.5346 | 0.0243 | -3.981 | 0.050 | -5.212 | 0.041 | 14.494 | 1.289 | 1.78 | 14r |
| 2061471469006956032 | 20 18 20.3443 | 39 21 58 | 0.5368 | 0.0901 | -2.800 | 0.153 | -4.895 | 0.168 | 17.325 | 1.839 | 1.79 | 55 |
| 2061380656233230848 | 20 17 56.1791 | 39 20 46 | 0.5392 | 0.0237 | -3.857 | 0.037 | -4.843 | 0.041 | 14.443 | 1.664 | 1.76 | 5r |
| 2061380514477932928 | 20 18 06.4481 | 39 21 17 | 0.5395 | 0.0269 | -3.562 | 0.043 | -5.140 | 0.047 | 12.252 | 0.845 | 1.76 | 19 |
| 2061380587513749888 | 20 18 03.2004 | 39 21 45 | 0.5404 | 0.0176 | -3.501 | 0.028 | -5.208 | 0.031 | 13.013 | 0.988 | 1.76 | 18 |
| 2061379964723777024 | 20 17 55.7345 | 39 18 18 | 0.5409 | 0.1486 | -3.794 | 0.263 | -5.090 | 0.293 | 18.310 | 2.380 | 1.81 | 56 |
| 2061380342680907136 | 20 17 57.3517 | 39 18 57 | 0.5432 | 0.0476 | -3.750 | 0.078 | -5.356 | 0.092 | 16.255 | 1.690 | 1.75 | 57 |
| 2061380312635856256 | 20 17 47.0403 | 39 20 19 | 0.5447 | 0.0204 | -3.700 | 0.030 | -4.843 | 0.036 | 13.449 | 1.009 | 1.74 | 58 |
| 2061381102909847296 | 20 17 42.1893 | 39 20 58 | 0.5452 | 0.0314 | -3.865 | 0.047 | -4.96 | 0.050 | 10.052 | 0.788 | 1.74 | 11r |
| 2061474458304208512 | 20 18 10.8129 | 39 23 33 | 0.5456 | 0.0168 | -3.637 | 0.028 | -5.231 | 0.030 | 13.523 | 0.901 | 1.74 | 17 |
| 2061381068550105984 | 20 17 44.6201 | 39 21 05 | 0.5473 | 0.0538 | -3.693 | 0.085 | -5.013 | 0.109 | 16.046 | 2.022 | 1.74 | 59 |
| 2061381613991258880 | 20 17 57.4966 | 39 24 00 | 0.5474 | 0.1533 | -3.619 | 0.253 | -4.596 | 0.297 | 18.319 | 2.280 | 1.79 | 60 |
| 2061471400287485184 | 20 18 12.9841 | 39 21 36 | 0.5479 | 0.1228 | -3.043 | 0.220 | -4.412 | 0.248 | 17.949 | 1.772 | 1.77 | 61 |
| 2061380931111151360 | 20 17 42.0249 | 39 19 58 | 0.5506 | 0.0514 | -3.998 | 0.082 | -4.824 | 0.088 | 15.935 | 2.225 | 1.73 | 62 |
| 2061380450074795392 | 20 18 00.5606 | 39 20 38 | 0.5523 | 0.0256 | -3.437 | 0.038 | -4.731 | 0.045 | 14.286 | 1.465 | 1.72 | 8r |
| 2061380243916371712 | 20 17 52.8373 | 39 20 02 | 0.5533 | 0.0233 | -4.097 | 0.035 | -4.704 | 0.036 | 13.935 | 1.337 | 1.72 | 21 |
| 2061379934678718976 | 20 17 53.7659 | 39 18 15 | 0.5539 | 0.0250 | -4.239 | 0.041 | -5.268 | 0.042 | 14.627 | 1.130 | 1.72 | 6 |
| 2061377529497025024 | 20 18 05.2786 | 39 19 56 | 0.5604 | 0.0290 | -3.931 | 0.045 | -5.373 | 0.050 | 15.027 | 1.235 | 1.70 | 1 |
| 2061474831956073088 | 20 18 06.8633 | 39 25 08 | 0.5620 | 0.0680 | -3.678 | 0.118 | -5.212 | 0.129 | 17.031 | 1.988 | 1.70 | 63 |
| 2061377254619104640 | 20 18 11.7472 | 39 18 48 | 0.5621 | 0.0402 | -3.909 | 0.063 | -4.847 | 0.071 | 13.411 | 0.940 | 1.70 | 2 |
| 2061380759312448384 | 20 17 58.8207 | 39 22 19 | 0.5631 | 0.0287 | -3.730 | 0.044 | -4.961 | 0.053 | 12.567 | 0.942 | 1.69 | 9r |
| 2061381343428026496 | 20 17 40.8205 | 39 23 23 | 0.5641 | 0.0225 | -3.606 | 0.036 | -5.180 | 0.038 | 14.620 | 0.954 | 1.69 | 64 |
| 2061380553154011008 | 20 18 02.0406 | 39 21 18 | 0.5655 | 0.0911 | -3.900 | 0.158 | -5.233 | 0.169 | 17.479 | 2.250 | 1.70 | 65 |
| 2061380690592977280 | 20 17 50.3958 | 39 21 05 | 0.5732 | 0.0231 | -3.894 | 0.035 | -4.772 | 0.039 | 14.234 | 1.593 | 1.66 | 1r |
| 2061376739215221888 | 20 18 4.8007 | 39 16 10 | 0.5737 | 0.0683 | -2.854 | 0.114 | -5.477 | 0.141 | 16.705 | 1.842 | 1.67 | 66 |
| 2061471258541187840 | 20 18 21.4792 | 39 21 21 | 0.5738 | 0.0237 | -3.654 | 0.039 | -5.264 | 0.042 | 13.709 | 0.986 | 1.66 | 24 |
| 2061377495137275520 | 20 18 13.4588 | 39 19 56 | 0.5827 | 0.0297 | -3.518 | 0.046 | -4.966 | 0.051 | 15.078 | 1.991 | 1.64 | 67 |
| 2061380858078916608 | 20 17 59.0624 | 39 23 24 | 0.5857 | 0.0334 | -3.726 | 0.053 | -5.022 | 0.058 | 15.355 | 1.873 | 1.63 | 68 |
| 2061380106477418880 | 20 17 47.4214 | 39 18 37 | 0.5874 | 0.0241 | -3.353 | 0.038 | -5.456 | 0.042 | 14.453 | 1.310 | 1.62 | 4 |
| 2061474733182122240 | 20 18 04.8118 | 39 24 38 | 0.5886 | 0.0220 | -3.780 | 0.036 | -5.118 | 0.039 | 14.492 | 1.825 | 1.62 | 12 |
| 2061380205240289152 | 20 17 49.7836 | 39 18 53 | 0.5924 | 0.0226 | -3.955 | 0.035 | -5.222 | 0.043 | 13.000 | 1.119 | 1.61 | 4r |
| 2061377288978841472 | 20 18 14.5332 | 39 19 14 | 0.5950 | 0.0202 | -3.727 | 0.030 | -5.344 | 0.034 | 13.706 | 0.955 | 1.60 | 69 |
| 2061474423944472960 | 20 18 07.0185 | 39 23 18 | 0.5985 | 0.0230 | -3.596 | 0.039 | -5.232 | 0.042 | 14.574 | 0.993 | 1.59 | 16 |
| 2061380037757937152 | 20 17 54.3807 | 39 19 23 | 0.6077 | 0.0309 | -3.298 | 0.048 | -5.274 | 0.057 | 15.179 | 1.472 | 1.57 | 20 |
| 2061471121103942016 | 20 18 16.4107 | 39 19 42 | 0.6143 | 0.1642 | -3.003 | 0.258 | -4.766 | 0.296 | 18.183 | 1.927 | 1.62 | 70 |
| 2061380651920483712 | 20 17 56.4076 | 39 20 43 | 0.6153 | 0.1200 | -3.901 | 0.199 | -5.158 | 0.224 | 17.711 | 2.074 | 1.59 | 5r |
| 2061380995516899584 | 20 17 37.6178 | 39 20 11 | 0.6161 | 0.1738 | -3.683 | 0.311 | -4.995 | 0.305 | 18.464 | 2.387 | 1.62 | 71 |
| 2061380518794267776 | 20 18 07.0410 | 39 21 41 | 0.6175 | 0.0556 | -4.027 | 0.096 | -5.075 | 0.105 | 16.653 | 2.049 | 1.55 | 72 |
| 2061378663368413440 | 20 17 39.6536 | 39 17 41 | 0.6197 | 0.0282 | -3.897 | 0.044 | -4.966 | 0.046 | 14.759 | 1.890 | 1.54 | 73 |
| 2061381751430215040 | 20 17 44.0534 | 39 24 13 | 0.6274 | 0.1520 | -2.946 | 0.257 | -5.679 | 0.290 | 18.352 | 1.999 | 1.58 | 74 |
| 2061474698822384256 | 20 18 01.4864 | 39 23 55 | 0.6461 | 0.0300 | -3.691 | 0.052 | -5.138 | 0.053 | 15.282 | 1.702 | 1.48 | 14 |
| 2061381137269590016 | 20 17 42.6726 | 39 21 53 | 0.6503 | 0.0863 | -3.766 | 0.136 | -5.149 | 0.146 | 17.142 | 2.048 | 1.49 | 75 |
| 2061381137261972992 | 20 17 43.6988 | 39 21 47 | 0.6604 | 0.1344 | -4.274 | 0.209 | -4.525 | 0.216 | 17.734 | 2.189 | 1.49 | 76 |
| 2061380484434528384 | 20 18 03.0200 | 39 20 18 | 0.6671 | 0.0934 | -3.698 | 0.145 | -5.220 | 0.150 | 10.819 | 0.870 | 1.46 | 3r |
| 2061381029874009088 | 20 17 43.6459 | 39 20 36 | 0.7016 | 0.0722 | -2.887 | 0.111 | -4.517 | 0.126 | 10.923 | 0.772 | 1.38 | 12r |
| 2061380621873495424 | 20 17 53.5368 | 39 20 56 | 0.6549 | 0.0605 | -2.941 | 0.098 | -5.793 | 0.102 | 15.008 | 1.554 | 1.53 | 22 |
These 68 stars can be considered to be probable members of vdB 130 cluster inside a 12-arcmin sized area centred at the location mentioned above (see Table 3). These stars are identified using GAIA DR2 data based on their positions on the CMD, closeness of their proper motions (within 1 mas yr-1 of the mean value compared to 3 mas yr-1 when identified using UCAC4 catalogue) and parallaxes (lying in the interval from 0.50 to 0.70 mas). Note that new population of the cluster contains 12 out of 14 stars (except 6r and 7r) initially identified Racine (1974) based exclusively on analysis of their spectra and photometry. These stars are marked by the letter ‘r’. Only 15 out of the remaining 36 stars from table 2 in Paper I met the parallax proximity selection criterion. The missing numbers in the interval from 1 to 36 correspond to the UCAC4 stars that failed to meet the selection criterion based on GAIA DR2 data. The remaining stars are identified based on GAIA DR2 data exclusively and have numbers ranging from 37 to 72. In Fig.4 are marked all stars that meet all the selection criteria based on both catalogues. The 68 GAIA DR2 stars mentioned above are most likely members of the rather compact young cluster vdB 130 with a sky-plane diameter of about 6 pc.
In Table 3 we provide a new list of cluster members extended mostly by including faint objects. Columns 1 gives source identifier in GAIA DR2 catalogue; columns 2–3 give the J2000.0 equatorial coordinates; columns 4–5, the parallaxes, uncorrected for systematical error, and appropriate random errors; columns 6–9, the proper-motion components along both coordinates with their errors; column 10, the -band magnitudes; column 11, the colour indices, column 12, the corresponding distances and the last column, the star numbers in the cluster. Magnitudes and colour indices are rounded to reflect real photometric precision.
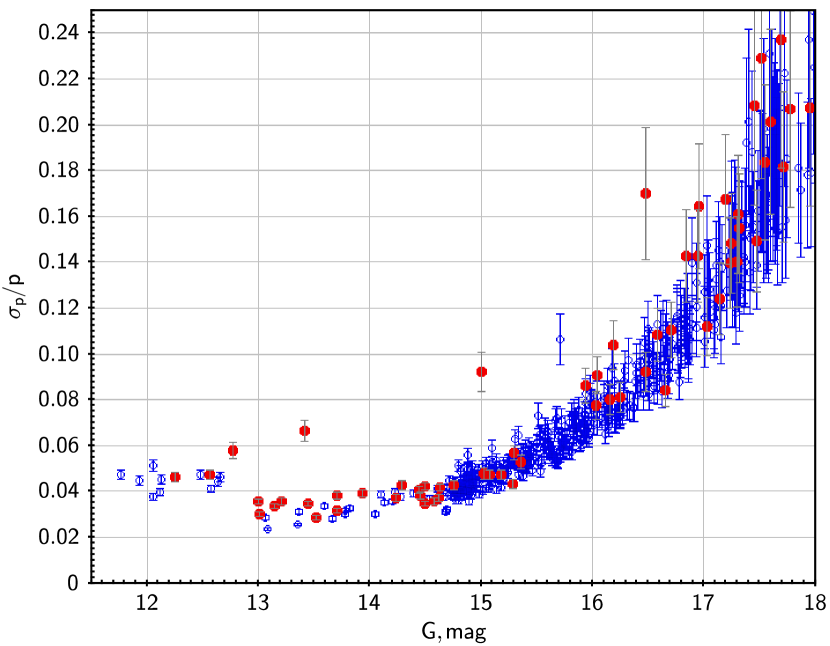
Most of the stars with close proper motions (see Fig.3, bottom) lie in a rather broad line-of-sight distance interval, from about 1.5 to 2.0 kpc. Such an elongated shape of the cluster in the line-of-sight direction can be explained entirely by random errors of GAIA DR2 trigonometric parallaxes, which amount to 3–5 per cent even for the brightest stars, translating into 50–80 pc in linear measure at the average distance of about 1.7 kpc, and increase to 20–30 per cent for faint stars (see Fig.5, red symbols). Note in this connection that apparent radial extent due to parallax errors is typical for many open clusters located at a distance about 1.5–2 kpc and more when based on GAIA DR2 parallaxes. This is immediately apparent from Fig.5 that even for bona fide members of old open cluster NGC 188, selected on the base of CMD, parallaxes and proper motions criteria (blue symbols), located at a distance of about 1.5 kpc, relative errors of GAIA DR2 parallaxes amount to 3–5 per cent for bright stars and increase to 20 per cent for faint members of this cluster. The relative error of trigonometric parallaxes evidently increases with distance.
3.2 The age of embedded cluster vdB 130 and the extinction law.
Previously, we estimated the age of the vdB 130 cluster to be within 5-10 Myr (see Paper I) based on photometry and the theoretical isochrone fitting on the CMD. However, it should be noted that determining the age of young embedded clusters presents significant difficulties both because of the differential extinction and the differences in the extinction law on the way to different members of the cluster, associated with the physical properties of the dust local to the cluster. Stars inside the cluster are shifted on the CMD along the axes of colours and magnitudes relative to their ‘true’ positions. Moreover, for some stars this shift occurs along the lines – of different slopes and lengths due to differences in the extinction law. For this reason, the standard procedure for applying theoretical isochrone fitting technique to the CMDs of such clusters cannot in principle give reliable results. Even if there is a good estimate of the distance taken from the GAIA DR2 trigonometric parallax. Therefore, our age estimate published in Paper I can be considered as a preliminary.
To estimate the age of the cluster vdB 130, we used the results of spectral classification of 8 members of the cluster (1r, 3r, 4r, 5r, 11r, 12r, 19, 22), performed using data on the spectral energy distribution (SED) from 2016. All these stars belong to spectral classes B1, B1/B2, B2/B3, B5, B5/B6 (in half of the cases neighboring spectral classes are allowed). The normal colours and absolute values for stars of these spectral classes were taken from Pecaut & Mamajek (2013) supplemented by Mamajek list444http://www.pas.rochester.edu/~emamajek/EEM_dwarf_UBVIJHK_colors_Teff.txt. Estimates of colour and magnitude errors were made using original data on calibration stars presented by Mamajek on the web-page555http://www.pas.rochester.edu/~emamajek/spt/. The positions of stars of spectral classes B1, B2, B3, B5, B6 are indicated on diagram – (see Fig.6).
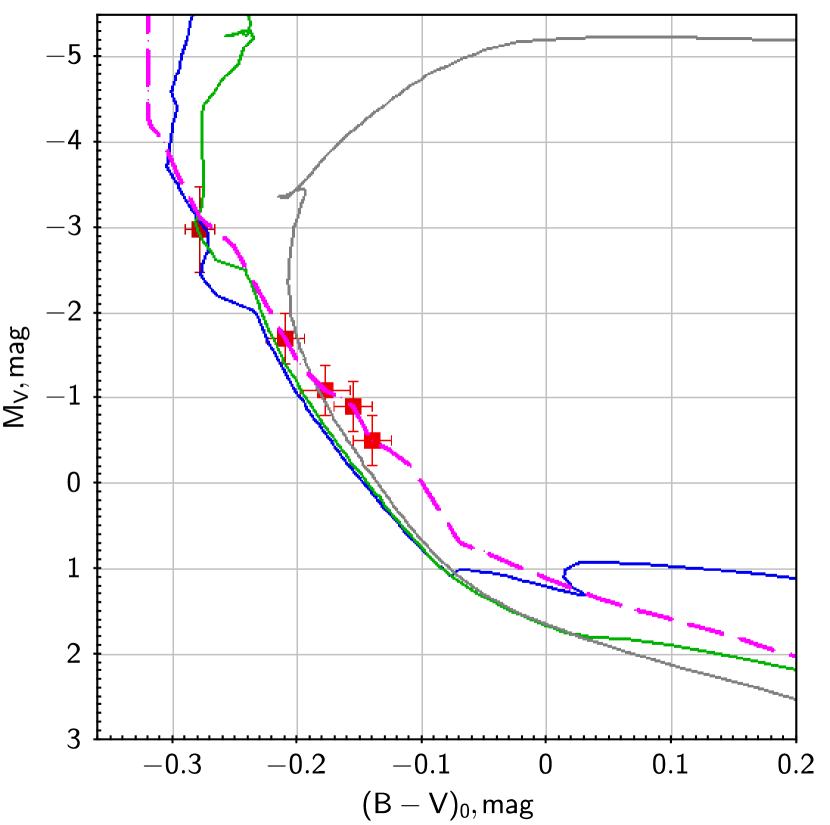
The brightest star 11r has a spectral class . Based on its position on CMD, the cluster is not older than 10 Myr. The large scatter of fainter stars along the colour axis (see, for example, Figure 4 in Paper I) even for IR data is explained not only by the differential absorption, but also by the fact that the lifetime of low-mass objects at the protostar stage can be comparable to the age of the cluster (10 Myr). It can be clearly seen on the Fig.6 that in clusters with an age of 10 Myr, stars of spectral class can still be on the pre-main sequence stage, and in the clusters with an age of 5-10 Myr – even some late -stars. Thus, the age of the embedded cluster vdB 130 is no more than 10 Myr. This estimate is based on the SED analysis of eight -stars in this cluster and is in general agreement with our preliminary estimate given in Paper I.
Even if we know more or less reliable trigonometric distance derived with the use of GAIA DR2 stellar parallaxes (true distance modulus mag), we can only determine the full absorption value for each star, i.e. estimate differential absorption. In the absence of any data on differential reddening, no age estimates are possible based on the position of all cluster stars on the CMD. However, for the stars with known spectral classes (, 2016), and with absolute magnitude and colour calibrations by Mamajek mentioned above, we have attempted define the ratio , which characterizes the extinction law. In the Table 4 the absorption values of and , as well as estimates of and ratios for stars 1r, 3r, 4r, 5r, 11r, 12r, 19, 22 are given. The photometric data in the bands are taken from the table 2 in Paper I.
| Sp | (T) | (PM) | ||||||
| mag | mag | mag | mag | mag | mag | mag | ||
| 1r | B1V | 1.3 | 1.14 | 6.06 | 5.3 | 1.40 | 1.48 | 1.06 |
| 3r | B1V | 0.9 | 0.86 | 2.85 | 3.3 | 0.47 | 0.51 | 1.06 |
| 4r | B1V/B2V | 1.1 | 1.01/0.94 | 5.1/3.7 | 5.0/3.9 | 0.68/0.62 | 2.0/0.9 | 2.9/1.4 |
| 5r | B1V/B2V | 1.4 | 1.28/1.21 | 6.7/5.4 | 5.2/4.5 | 1.09/1.03 | 2.2/1.1 | 2.0/1.0 |
| 11r | B1V | 1.1 | 0.82 | 2.04 | 2.5 | 0.44 | ||
| 12r | B5V | 0.5 | 0.68 | 0.80 | 1.2 | 0.36 | ||
| 19 | B2V/B3V | 0.9 | 0.79/0.76 | 3.0/2.4 | 3.8/3.1 | 0.40/0.37 | 0.8/0.3 | 2.0/0.8 |
| 22 | B5V/B6V | 1.4 | 1.25/1.23 | 5.0/4.6 | 4.0/3.7 | 0.92 | 1.3/0.9 | 1.4/1.0 |
Columns 2 and 3 give the spectral class and the colour excess estimated by 2016 using data on the spectral energy distribution (SED). Columns 4 and 7 show colour excess values and , defined as the differences between the observed colours and colours taken from colour calibrations (Pecaut & Mamajek, 2013) for the spectral classes specified in column 2. The absorption values in the bands (column 5) and (column 8) were estimated using obvious expressions = and = , where true distance modulus mag. Finally, columns 6 and 9 give the ratios and . From the uncertainties of colour calibrations and true distance modulus, their errors can be estimated as . For stars with two variants of spectral classification, both values are given. Note that the colour excess values defined by two different ways agree fairly well. It is noteworthy to note that the ratio for stars 1r, 4r, 5r, 22 is significantly higher than the ‘standard’ value for the ‘conventional’ extinction law (Cardelli et al., 1989). For stars 11r, 12r, the absorption within the errors is nearly zero, which is confirmed by the relatively small absorption and the unusually small value of for star 12r. For stars 3r, 11r, 19, the ratio can be considered as normal within the errors. The data shown in the Table 4 directly confirm the presence of abnormal absorption in the vdB 130 cluster area (see also (, 2016)). It should be noted that for most stars, with the exception of 11r, 12r, the ratio is approximately twice the ‘normal’ value (Cardelli et al., 1989).
3.3 Protocluster region.

In the direction toward a dense condensation in the tail of the molecular cloud a compact group of class I and II protostars was found (Fig. 1, bottom, see also Paper II). While searching for optical counterparts of the protocluster we investigated the 2.5-arcmin radius area centred on the protocluster ( , ) and found 137 GAIA DR2 stars. Like in the case of vdB 130 cluster we plotted the Hertzsprung-Russell (Fig. 7, top), parallax – -band magnitude (Fig. 7, middle) and the two-dimensional proper-motion diagrams (Fig. 7, bottom) for stars in the direction of the protocluster. As follows from an analysis of the figures the optically observed stars making up the apparent main sequence (Fig. 7,top) span a broad interval of heliocentric distances ranging from 0.7 to 2 kpc (Fig. 7, middle). Moreover, these stars also show no appreciable concentration in the proper-motions diagram (Fig. 7, bottom) and, in our opinion, do not form a gravitationally bound group of objects.
In Paper I we proposed the following scenario of the ongoing evolution of this region (see also (Smith et al., 2010)). In the cluster area, the expanding supershell around Cyg OB1 interacts with the molecular cloud. A typical cometary shape of the cloud (an IR pillar), (see Fig. 1), is an indirect confirmation of such interaction. The wind and the UV radiation of the Cyg OB1 stars had triggered the star formation in the pillar, having resulted in the emergence of the vdB 130 cluster. The compact protocluster observed near a dense clump in the tail of the cometary molecular cloud is the next burst of star formation.
4 Spectral types and colour excesses of the stars studied.
Although we could not identify a condensation of objects with close proper motions in the protocluster region, we selected 25 stars for spectroscopic study. Their proper motions do not strongly differ from those of the stars of the vdB 130 cluster located in the same molecular cloud. Note that the stars studied are located within 2.5 arcmin from the protocluster centre and are projected onto the break in the star-formation filament observed there. This filament can be traced in the cometary cloud by an ensemble of several millimetre-wave sources (Motte et al., 2007). It is also described in Paper II (see fig.13 there) based on Herschel space telescope data.
Table 5 presents the results of our analysis of spectroscopic and photometric data for 25 stars. Column 1 gives the designation of the star according to Fig. 2; column 2, the spectral type determined in this study; column 3, the observed colour index; column 4, the intrinsic colour index characteristic of this spectral type (Straizys, 1992); column 5, the colour excess; column 6, the colour index computed taking into account the inferred spectral type and colour excess assuming normal interstellar extinction law; column 7, the observed colour index ; column 8, the absolute magnitude determined using the distance to the object (see column 8 in Table 2) and the colour excess assuming normal interstellar extinction law, and column 9 gives the average absolute magnitude for the spectral types listed in column 2 (Gray & Corbally, 2009).
| Star | Sp | E(B-V) | ||||||
|---|---|---|---|---|---|---|---|---|
| mag | mag | mag | mag | mag | mag | mag | ||
| 2 | A5 - A7V | 0.73 | 0.15 - 0.20 | 0.58 - 0.53 | 0.39 | 0.36 | 1.1 - 1.3 | 1.2(A5IV) |
| 3 | F3V | 0.51 | 0.40 | 0.11 | 0.30 | 0.26 | 3.3 | 3.1(F3V) |
| 5 | G2 - G5V | 0.79 | 0.62 - 0.68 | 0.17 - 0.11 | 0.45 | 0.45 | 4.6 - 4.8 | 4.7(G2V) |
| 6 | K4V | 0.99 | 1.05 | 0.66 | 0.72 | 6.9 | 7.1(K4V) | |
| 7 | G6 - G8V | 0.71 | 0.70 - 0.75 | 0.42 | 0.42 | 5.3 | 5.3(G6V) | |
| 8 | G2 - G5V | 0.91 | 0.62 - 0.68 | 0.30 - 0.24 | 0.52 | 0.57 | 4.5 - 4.6 | 4.7(G2V) |
| 10 | F6 - F7V | 1.04 | 0.46 - 0.50 | 0.55 - 0.59 | 0.54 - 0.61 | 0.56 | 3.5 | 3.7(F6V) |
| 11 | F2 - F3V | 1.32 | 0.36 | 0.77 | 1.55 | 2.0 | 1.9(F3IV) | |
| 12 | A5 - F3V | 0.91 | 0.30 (F0V) | 0.6 | 0.49 | 0.49 | 2.8 | 2.6(F0V) |
| 13 | G2 - G5 | 1.06 | 0.62 - 0.68 | 0.4 - 0.34 | 0.56 - 0.51 | 0.52 | 4.6 - 4.7 | 4.79(G2V) |
| 14 | F3V? | 1.56 | 0.40 | 0.87 | 1.21 | 2.2 | 1.9(F3IV) | |
| 15 | M0 - M1V | 1.39 | 1.44 - 1.47 | 0.89 | 0.89 | 8.9 | 9.2(M0V) | |
| 17 | K2 - K4III | 1.75 | 1.16 (K2III) | 0.6 | 1.04 | 1.09 | 0.5 | 0.6(K2III) |
| 18 | G6 - G8V | 1.12 | 0.75 | 0.37 | 0.62 | 0.62 | 5.1 | 5.3(G6V) |
| 19 | M1 - M2V | 1.37 | 1.47 - 1.49 | 0.9 | 0.87 | 9.5 | 9.7(M1V) | |
| 20 | K1 - K2V | 0.90 | 0.86 - 0.91 | 0.54 - 0.59 | 0.61 | 6.4 | 6.3(K2V) | |
| 21 | G2 - G5V | 1.22 | 0.62 - 0.68 | 0.66 - 0.6 | 0.71 | 0.63 | 4.3 - 4.5 | 4.7(G2V) |
| 22 | G5 - G8V | 0.97 | 0.68 - 0.75 | 0.3 - 0.23 | 0.54 | 0.47 | 3.6 - 3.8 | 3.2(G5VI) |
| 23 | F3 - F5V | 0.73 | 0.40 - 0,44 | 0.33 - 0.29 | 0.35 - 0.26 | 0.35 | 3.7 - 3.8 | 3.1(F3V) |

As is evident from Table 5 (see columns 6 and 7), we achieved good agreement between the computed and observed colour indices for all the stars studied except two objects – stars 11 and 14 (Fig. 8). Such a significant discrepancy may be due to circumstellar envelopes surrounding these stars. Indications of circumstellar matter surrounding star 11 can also be seen in direct -band images. Note that the distance to star 11 agrees, within the errors, with the distance to the molecular cloud, whereas according to GAIA DR2 data, star 14 must be located behind the cloud (see column 9 in Table 2). These stars exhibit certain spectral peculiarities. The DIBs can be seen in the spectrum of star 11, whereas the spectrum of star 14 shows a Eu ii line (possibly blended with a Nd ii line, see Fig. 8).
The star 2 (an A5-type subgiant) has the earliest spectral type among the observed stars (Fig. 8). Spectral classification of A-type stars is usually based on an analysis of Balmer lines. In our case it is very difficult to perform because the bright and highly non-uniform nebula also shines in hydrogen lines. As a result of the background subtraction, hydrogen absorption lines present in the spectrum of an A-type star may appear both stronger and weaker than in reality. However, there is another criterion for classification of A-type stars – it uses Ca ii H and K lines. The fact that this is not a B-type star is evident from the absence of He i lines in its spectrum. The lack of the G-band in the spectrum and rather weak Ca i 4226 Å line indicate that we are not dealing with an F-type star.
Most of the stars (13) are of spectral types G and F. We classified G-type stars based on the depth of the G-band and intensity of the Mg i 5167, 5172, and 5183 Å lines (Fig. 8). There are a total of seven such stars and the remaining six stars are of spectral type F.
The remaining stars are of spectral type and early M (see Table 5). We classified them based on the properties of MgH- and TiO-bands and the Na i 5890, 5896 Å doublet (Fig. 8). The latter, however, may be somewhat distorted because of superimposed interstellar Na i lines, but almost all such stars have small colour excesses (see column 3 in Table 5), and this effect must be weak. Note that K- and M-type stars can be rather accurately subdivided into luminosity classes V and III.
At the last stage we compared our inferred -band absolute magnitude with the estimate averaged over the spectral type and luminosity class presented by Gray & Corbally (2009). Note that we estimated the absolute -band magnitude based on the photometric measurement, distance, and interstellar extinction. For several object the best agreement is achieved by assuming that the star is of luminosity class IV rather than V as we initially believed. One must, however, bear in mind that the scatter of absolute magnitudes of different stars within the same spectral type and luminosity class may amount to 1 mag, which is comparable to the difference between the average values for stars of luminosity class IV and V. For example, the corresponding difference for A5–A9 type stars is of about 0.8–0.9 mag.
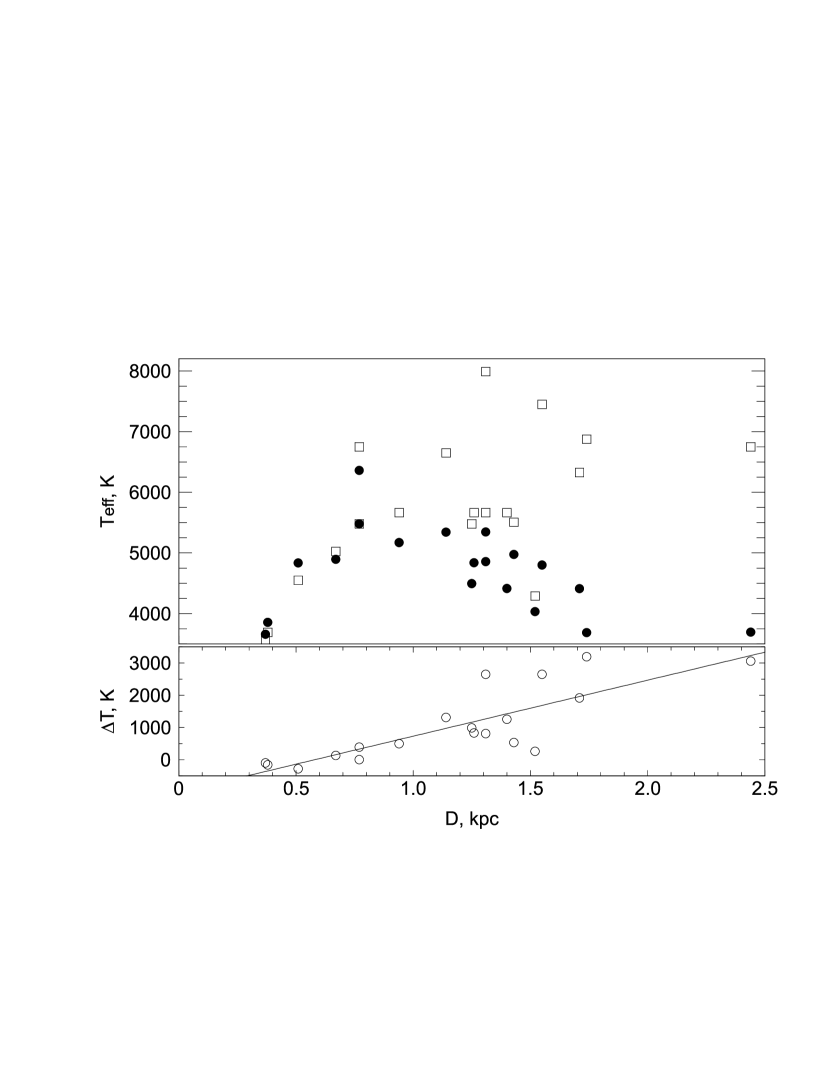
The data from Table 5 can be used to compare the effective temperatures of stars in the protocluster region inferred from spectral types (Gray & Corbally, 2009) with the temperatures provided in the GAIA DR2 catalogue. Fig. 9 shows the dependence of pointed above quantities from heliocentric distances to stars. It is seen from the figure that the temperatures derived using different methods agree well up to a distance of kpc. Note that the effective temperatures determined from spectra in this paper may be both lower and higher than GAIA DR2 estimates. Note also that according to our observational data the interstellar extinction toward the stars mentioned above located within kpc is close to zero (see the text below and Table 5). The difference increases with the distance (and hence with interstellar extinction) – the values of temperature provided by GAIA DR2 becomes systematically lower than our estimates. Consider, for example, stars 11 and 14, which are of spectral type F according to our estimates (Table 5). The GAIA DR2 estimates of their temperatures (about 3700 K) correspond to early M type and hence their spectra should be dominated by molecular bands. However, as is evident from Fig. 8, this is not the case. This fact is most likely indicative of insufficient account of the effect of interstellar extinction in GAIA DR2.
5 Interstellar extinction toward the molecular cloud.
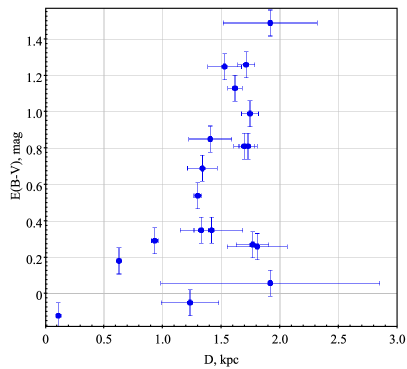
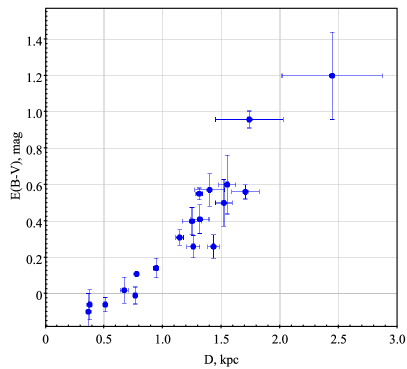
Right panel of Fig. 10 shows the dependence of on the heliocentric distance to stars toward the protocluster based on the data from Table 2 and Table 5. The lack of appreciable reddening toward the protocluster out to the distances of 0.6–0.8 kpc is immediately apparent. This agrees with the data from Neckel & Klare (1980) for this region and explains the agreement between GAIA DR2 effective temperatures and our temperature estimates based on spectral types within the distance limit mentioned above. In the case of normal interstellar extinction law () extinction at larger distances increases at a rate of about 1.9 mag kpc-1, which is in general agreement with average rate in the disk of the Milky Way galaxy (Sharov, 1968). Note that star 11 is the only one to deviate significantly from this dependence. The observed colour index is much redder than calculated on the base of colour excess under the assumption of normal extinction law (see Table 5). This object probably has a circumstellar dust shell distorting the energy distribution in the spectrum of the star. This hypothesis is supported by the fact that star 11 is a bright source on 3.6–8 m images taken by Spitzer space telescope. According to Table 2, the observed colour index of star 14 is also inconsistent with the colour index computed from based on standard extinction law. However, the is consistent with the distance to the star (see Fig. 10, right). This discrepancy may be indicative, e.g., of the presence of a circumstellar disk seen face on.
For comparison, we show in Fig. 10 (left) the dependence of on distance for stars of the open cluster vdB 130 and field stars (with the parallaxes corrected for the systematic error). To estimate reddening values we used the spectral types and observed colour indices from (, 2016) and adopted intrinsic colour indices from (Straizys, 1992). Three stars are immediately apparent, which are located at the cluster distance of kpc and have anomalously low reddening . According to GAIA DR2 parallaxes and proper motions, two of these stars ‘a’ and 50 are members of the vdB 130 cluster (see Table 3). Their small colour excess may be due to the fact that these are red dwarfs (, 2016) with magnitudes mag, for which the possible errors may amount to several tenths of a magnitude.
Like in the case of the protocluster, we can see on Fig. 10 (right panel) the lack of appreciable reddening out to a distance of about kpc. For more distant stars reddening increases faster with distance than we see in Fig. 10 (right). This fact is indicative of extra extinction in the region of the young open cluster vdB 130.
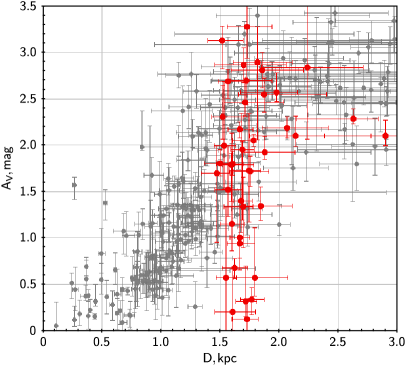
By combining GAIA DR2 (, , ), PanSTARRS1, 2MASS and AllWISE photometry, Anders et al. (2019) calculated new extinction values and made new Bayesian estimates of photo-astrometric distances for approximately 265 million stars brighter than mag. We tried to qualitatively compare these new data taken from StarHorse catalogue by Anders et al. (2019) with our data on colour excess and its variation along line-of-sight. Fig. 11 shows the dependence of the extinction on the heliocentric distance for two fields studied in this paper: vdB 130 field of 12 arcmin size around vdB 130 cluster (left panel) and protocluster field (right panel). vdB 130 cluster members selected by CMD, distances and proper motions criteria, listed in the Table 3, are marked by red, whereas field stars are marked by grey on the left panel on Fig. 11. It is clearly seen that the extinction systematically grows with the distance up to 1.5 kpc, i.e. just to the distance of the cluster, and remains nearly constant ( mag) at the distances larger than 2 kpc, though with noticeable scatter. We can suppose that this 2 kpc distance marks far edge of supershell around Cyg OB1 association. As for members of vdB 130 cluster, very large scatter of their individual extinctions ( mag) clearly seen on the left panel on Fig. 11 undoubtedly confirms the presence of large differential extinction inside this embedded young cluster, which is in qualitative agreement with our data in the Table 4 for stars with spectral classification (see also (, 2016)).
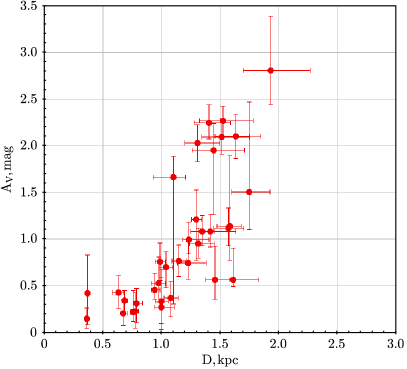
Right panel on Fig. 11 shows the same dependence for protocluster area. The picture shows nearly the same behavior of extinction with the distance along line-of-sight as shown on Fig. 10 (right panel) for our data on colour excess, but with sharp increase of the extinction near kpc. Additionally, the comparison of two pictures imply nearly normal extinction law with (Cardelli et al., 1989) toward protocluster direction.
6 Conclusions.
In this paper we investigate two sites of star formation in the wall of the expanding supershell around the Cyg OB1 association. Both regions are associated with a cometary cloud, which is evidenced not only by the factors mentioned in Papers I and II, but also by our analysis of extinction. The region of ongoing star formation – the embedded cluster vdB 130 with an age Myr, containing 68 stars – is located in the head of the cloud ‘looking’ toward the centre of the association. Whereas the burst of star formation – a compact protocluster containing at least 30 type I and II protostars – is observed in the tail of the same cloud.
We analysed the optical components in the region using the data of the GAIA DR2 catalogue and our spectroscopic and BVRJHK photometric observations of stars in the region. We also used our original observations to compare our data and data of the GAIA DR2 catalogue and obtained the following results:
-
1.
The use of high-precision GAIA parallaxes and proper motions combined with spectroscopic observations and optical and IR photometry allowed us to substantially refine the content and parameters of the open cluster vdB130. The number of members of the vdB 130 cluster previously identified using UCAC4 catalogue increased as a result of new revision of astrometric data to 68 stars with close proper motions (within 1 mas yr-1) and trigonometric parallaxes (lying in the interval from 0.50 to 0.70 mas). The cluster age (less than 10 Myr) was estimated by the isochrone fitting technique applied to 8 stars with spectral classes found from SED and colour-magnitude calibrations.
-
2.
We show that the relative error of GAIA DR2 parallaxes slightly increases with the distance to the object and strongly depends on G magnitude. At the distance of 1.5–2 kpc it amounts to 3–5 per cent (50–80 pc along line-of-sight) and to 20–30 per cent (300–500 pc along line-of-sight) for bright and faint stars, respectively.
-
3.
The values of effective temperature provided by GAIA DR2s for stars located at distances greater than 0.8 kpc toward protocluster region are systematically underestimated in comparison with the results of our optical spectroscopic observations. This appears to be because of the method used to determine effective temperatures (Andrae et al., 2018) does not properly take into account interstellar reddening.
-
4.
The centroid of the proper motions of vdB 130 members in the Galactic coordinate system is located at mas yr-1. Hence the cluster moves predominantly in the Galactic plane with a residual velocity of about km s-1 directed toward the Galactic center (after taking into account the differential rotation and solar motion in accordance with the rotation curve of maser sources (Rastorguev et al. 2017).
-
5.
We found no optical counterparts of the protocluster because our analysis of 20 stars toward the protocluster direction show no clumping in the distribution of proper motions or parallaxes. The stars studied are distributed over a broad interval of heliocentric proper motions (these stars span heliocentric distance from 0.7 to 3 kpc).
-
6.
We studied the distance dependence of colour excess and extinction for field stars and cluster members toward the vdB 130, and also for protocluster based on our observations and data from StarHorse catalogue (Anders et al., 2019). The reddening is almost absent out to a distance of kpc. At larger distances toward the protocluster the extinction increase rate, 1.9 mag kpc-1 (determined assuming ), is approximately consistent with the average rate in the Galaxy (Sharov, 1968).
-
7.
toward vdB 130 cluster, the extinction measured for field stars systematically increases up to 1.5 kpc, and after kpc remains nearly constant, with mag. The extinction increases much steeper than toward protocluster possibly because we observe the stars through the dust and gaseous layer of a supershell around Cyg OB1. We do not exclude that the distance 2 kpc marks far edge of the supershell. For cluster members, inside the cluster large scatter of values from 0 to 3 mag confirms the idea of large differential extinction.
Data availability
The data underlying this article will be shared on reasonable request to the corresponding author.
Acknowledgements
The authors are grateful to Dr. Alexei Moiseev for carrying out spectroscopic observations in July 2017, and to the reviewer, Dr. Alexander Binks, for his useful comments that improved our paper.
This study was carried out using the equipment bought with the funds of the Program of the Development of M.V. Lomonosov Moscow State University and supported by the RFBR grants (18-02-00976, 18-02-00890, 19-12-00611, 20-02 -00643). Authors acknowledge the support from the Program of development of M.V. Lomonosov Moscow State University (Leading Scientific School ‘Physics of stars, relativistic objects and galaxies’). OE acknowledges the support by Foundation of development of theoretical physics and mathematics ‘Basis’.
Observations with the Russian 6-m telescope carried out with the financial support of the Ministry of Science and Higher Education of the Russian Federation.
This work is partially based on the data from the Spitzer Space Telescope operated by the Jet Propulsion Laboratory, California Institute of Technology, under NASA contract 1407, and the data from the 2MASS catalogue (University of Massachusetts, California Institute of Technology, NASA and NSF).
This work has made use of data from the European Space Agency (ESA) mission Gaia (https://www.cosmos.esa.int/gaia), processed by the Gaia Data Processing and Analysis Consortium (DPAC, https://www.cosmos.esa.int/web/gaia/dpac/consortium).
References
- Afanasiev & Moiseev (2005) Afanasiev V.L., Moiseev, A.V., 2005, Astron. Letters, 31, 194
- Anders et al. (2019) Anders F., Khalatyan A., Chiappini C. et al., 2019, A&A, 628, A94
- Andrae et al. (2018) Andrae R., Fouesneau M., Creevey O., 2018, A&A, 616, A8
- Bressan (2012) Bressan A., 2012, MNRAS, 427,127.
- Cardelli et al. (1989) Cardelli J.A., Clayton G.C., Mathis J.S., 1989, ApJ, 345, 245.
- Dale et al. (2015) Dale J. E., Haworth T. J., Bressert E., 2015, MNRAS, 450, 1199
- Deharveng et al. (2010) Deharveng L., Schuller F., Anderson L.D., Zavagno A., Wyrowski F., Menten K. M., Bronfman L., Testi L., Walmsley C. M., Wienen M., 2010, A&A, 523, A6
- Elmegreen (1998) Elmegreen B. G., 1998, Astronomical Society of the Pacific Conference Series, 148, 150
- Elmegreen (2010) Elmegreen B. G., 2010, EAS Publications Series, 51, 45
- Egorov et al. (2017) Egorov O. V., Lozinskaya T. A., Moiseev A. V., Shchekinov Yu. A., 2017, MNRAS, 464, 1833
- Gaia Collaboration (2018) Brown A.G.A. et al., 2018, A&A, 616, A1.
- Gray & Corbally (2009) Gray R.O., Corbally C.J., 2009, Stellar Spectral Classification, Princeton University Press, 565.
- Groenewegen (2018) Groenewegen M.A.T., 2018, A&A, 619, A8.
- Humpreys & McElroy (1984) Humpreys R.M., McElroy D.B., 1984, Astrophys. J., 284, 565
- Jordi et al. (2006) Jordi K., Grebel E. K., Ammon K. A., 2006, A&A 460, 339.
- Lang et al. (2010) Lang D., Hogg D. W., Mierle K., Blanton M., Roweis S.,2010, Astron. J.,137, 1782.
- Leggett et al. (2006) Leggett S.K. et al., 2006, MNRAS, 373, 781.
- Motte et al. (2007) Motte F., Bontemps S., Schilke P., Schneider N., Menten K. M., Broguiere D., 2007, A&A, 476, 1243
- (19) Nadjip A.E., Tatarnikov A.M., Toomey D.W., Shatsky N.I., Cherepashchuk A.M., Lamzin S.A., Belinski A.A, 2017, Astrophys. Bull., 72, 349
- Neckel & Klare (1980) Neckel T., Klare G., 1980, A&ASS, 42, 251.
- Pecaut & Mamajek (2013) Pecaut M., Mamajek E., 2013, Aps., 208, article id. 9.
- Racine (1968) Racine R., 1968, AJ, 73, 233
- Racine (1974) Racine R., 1974, Astron. J., 79, 945.
- Rastorguev et al. (2017) Rastorguev A.S., Utkin N.D., Zabolotskikh M.V., Dambis A.K., Bajkova A.T., Bobylev V.V., 2017, Astrophys. Bull., 72, 122
- Sharov (1968) Sharov A.S., 1968, Soviet Astron, 7, 689.
- Schneider et al. (2007) Schneider N., Simon R., Bontemps S., Comeron F., Motte F., 2007, A&A, 474, 873
- Sitnik et al. (2015) Sitnik T.G. et al, 2015, MNRAS, 454, 2486
- Sitnik et al. (2019) Sitnik T.G. et al, 2019, MNRAS, 486, 2449
- Smith et al. (2010) Smith N. et al, 2010, MNRAS, 406, 952
- Straizys (1992) Straizys V.,1992, Multicolour Stellar Photometry, Pachart, Tucson. (1977, Mokslas, Vilnius).
- (31) Tatarnikova A. A., Tatarnikov A. M., Sitnik T. G., Egorov O. V., 2016, Astron. Lett., 42, 790
- (32) Yalyalieva L. N., Chemel A. A., Glushkova E. V., Dambis, A. K., Klinichev, A. D. 2018, Astrophys. Bull., 73, 335
- (33) Zavagno A., Deharveng L., Comerón F., Brand J., Massi F., Caplan J., Russeil D., 2006, A&A, 446, 171