Syndromic Surveillance
Continuous Artificial Prediction Markets as a Syndromic Surveillance Technique
1 Syndromic Surveillance
Appearance of highly virulent viruses warrant early detection of outbreaks to protect community health. The main goal of public health surveillance and more specifically ‘syndromic surveillance systems’ is early detection of an outbreak in a society using available data sources.
In this paper, we discuss what are the challenges of syndromic surveillance systems and how continuous Artificial Prediction Market (c-APM) (Jahedpari et al., 2017) can effectively be applied to the problem of syndromic surveillance. c-APM can effectively be applied to the problem of syndromic surveillance by analysing each data source with a selection of algorithms and integrating their results according to an adaptive weighting scheme. Section 2 provides an introduction and explains syndromic surveillance. Then, we discuss the syndromic surveillance data sources in Section 3 and present some syndromic surveillance systems in Section 4. The statement of the problem in this field is covered in Section 5. After that, we discuss Google Flu Trends (GFT) and GP model (Lampos et al., 2015), which is proposed by Google Flu Trends team to improve GFT engine performance, in Section 6 and 7 respectively. Also, in these sections, we evaluate the performance of c-APM as a syndromic surveillance system. Finally, Section 8 provides the conclusion of this paper.
2 Introduction
According to the World Health Organisation (WHO) (World Health Organization, 2013), the United Nations directing and coordinating health authority, public health surveillance is:
The continuous, systematic collection, analysis and interpretation of health-related data needed for the planning, implementation, and evaluation of public health practice.
Public health surveillance practice has evolved over time. Although it was limited to pen and paper at the beginning of 20th century, it is now facilitated by huge advances in informatics. Information technology enhancements have changed the traditional approaches of capturing, storing, sharing and analysing of data and resulted efficient and reliable health surveillance techniques (Lombardo and Buckeridge, 2007). The main objective and challenge of a health surveillance system is the earliest possible detection of a disease outbreak within a society for the purpose of protecting community health.
In the past, before the widespread deployment of computers, health surveillance was based on reports received from medical care centres and laboratories. Although they are very specific111Specificity: the proportion of people without the disease that a test finds negative , they decrease the timeliness and sensitivity222Sensitivity: the proportion of people with the disease that a test finds positive of a surveillance system (Lombardo and Buckeridge, 2007), while prevention of mortality of infected people for some diseases requires rapid identification and treatment. Clearly, the earlier a health threat within a population is detected, the lower the morbidity and the higher number of the saved lives. Consequently, syndromic surveillance systems have been created to monitor indirect signals of disease activity such as call volume to telephone triage advice lines and over-the-counter drug sales to provide faster detection (Ginsberg et al., 2008).
Syndromic Surveillance is an alternative to the traditional health surveillance system, which mainly depends on confirmed diagnoses, and aim to detect an outbreak as early as possible. Syndromic surveillance refers to techniques relying on population health indicators which are apparent before confirmatory diagnostic tests become available (Mandl et al., 2004). Syndromic surveillance systems mostly concentrate on infectious diseases such as severe acute respiratory syndrome (SARS), anthrax and influenza. In order to decide whether an outbreak is evolving, syndromic surveillance systems monitor the quantity of patients with similar syndromes since indicators of a disease appear.
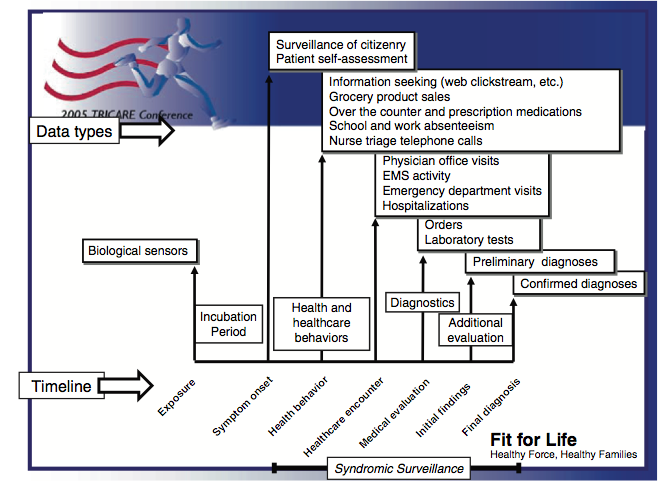
Syndromic surveillance aims to exploit information which is not primarily generated for the purpose of public health, but can be an indicator of an abnormal health event. Syndromic surveillance data sources include, but are not limited to, coding of diagnoses at admission to or discharge from emergency departments, confirmatory diagnostic cases, medical encounter pre-diagnostic data, absentee rates at schools and workplaces, over-the-counter pharmacy sales and posts on social media. Each of these data sources can generate a signal during disease development. Figure 1 shows the timeline of different data sources to detect an outbreak. The following section describes some of the syndromic surveillance data sources in more details.
3 Syndromic Surveillance Data Sources
Syndromic surveillance data sources should supply timely and pre-diagnosis health indicators. Most of this data is originally collected for other purposes and now serves a dual purpose (Chen et al., 2010). Syndromic surveillance data sources include:
-
1.
Chief complaint record: These records include signs and symptoms of patient illness from emergency departments (ED) and ambulatory visits to hospitals. These records normally become available on the same day as the patient is seen.
-
2.
Over the counter (OTC) sales: since some people may consider visiting a pharmacy rather than a physician in their early stage of sickness, these data might be more timely. They include detailed information and are available in near real time in electronic format. However, they might be affected by factors such as sales promotions, stockpiling of medicines during a season, and product placement changes in pharmacies.
-
3.
School or work absenteeism: Although absenteeism data seems to have good timeliness, their lack of medical detail complicates interpretation (Van den Wijngaard et al., 2008).
-
4.
Hospital admission records: These data are not sufficiently timely as it might take several days from a patient’s first visit until his/her hospitalisation.
-
5.
Pre-diagnostic clinical data: These are indications by an illness before being confirmed via laboratory tests and include comments of health care practitioners, patient encounter information, triage nurse calls, 911 calls and ambulance dispatch calls. They are relatively timely.
-
6.
International Classification of Disease 9th edition (ICD-9) and International Classification of Disease, 9th edition, Clinical Modification (ICD-9-CM): These are widely used in many syndromic surveillance systems due to their electronic format. They are usually generated for billing and insurance reimbursement purposes.
-
7.
Laboratory test orders and results: Although laboratory test results are very reliable, they lack timeliness as they usually take a week to be completed.
-
8.
Emergency Department (ED) diagnostic data: These are regularly available in electronic format but takes several days to be prepared.
-
9.
Internet and open source information: These contain a huge source of health information and can be obtained via discussion forums, social media, government websites, news outlets, blogs, discussion sites, individual search queries, web crawling, use of click stream data, mass media and news report.
For example, some approaches have applied data mining techniques to
-
•
Search engine logs
-
•
Twitter
-
•
News articles
-
•
Web browsing patterns
-
•
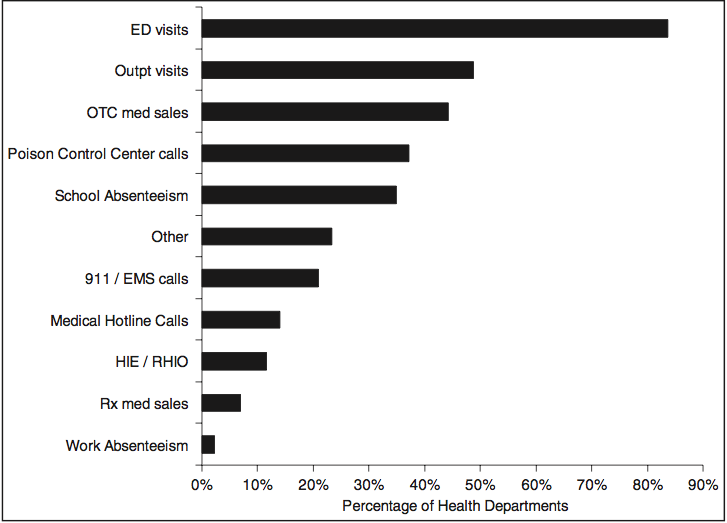
Figure 2, graphs the popularity of various data sources in existing syndromic surveillance systems in the USA. As can be seen from the figure, while emergency department visit reports are widely used in such systems, work absenteeism is the least popular source.
4 Existing Syndromic Surveillance Systems
In recent years, a number of syndromic surveillance approaches have been proposed. Roughly 100 syndromic surveillance systems were deployed in the USA done by 2003 (Buehler et al., 2003). Although they share similar goals, they are different in their system architecture, information processing, analysis algorithms, disease focus, and cover different geographic locations. Chen et al. (2010) summarises the main international and USA local, state and national syndromic surveillance systems. In Europe, an inventory of syndromic surveillance systems is delivered through a new Public Health Action Programme called Triple-S333 http://www.syndromicsurveillance.eu/ (Retrieved Oct 4, 2015). (Syndromic Surveillance Survey, Assessment towards Guidelines for Europe).
The following two sections survey some of the major existing syndromic surveillance systems around the globe. Based on the utilised data sources, we divide the existing syndromic surveillance systems into two categories of i) traditional syndromic surveillance systems, described in Section 4.1 and ii) modern syndromic surveillance systems, described in Section 4.2.
4.1 Traditional Syndromic Surveillance Systems
We refer to syndromic surveillance systems that do not utilise social media and internet based data as traditional syndromic surveillance. Some of them are listed below:
-
1.
Early Notification of Community-based Epidemics (ESSENCE) (Lewis et al., 2002) is a syndromic surveillance system in the Washington D.C. area, undertaken by Department of Defense with the primary goal of early detection disease outbreak due to bioterrorism attacks.
-
2.
Real time Outbreak and Disease Surveillance (RODS) (Tsui et al., 2003) is a public health surveillance system, in operation in western Pennsylvania since 1999, developed at the RODS laboratory of the Center for Biomedical Informatics at the University of Pittsburgh.
-
3.
Composite Occupational Health and Operational Risk Tracking (COHORT) (Reichard et al., 2004) delivers real-time surveillance of the medical care of specified groups of military employees worldwide.
-
4.
Syndromic Surveillance Information Collection (SSIC) has been developed by the association of the Clinical Information Research Group at the University of Washington and Public Health-Seattle and King County (Lober et al., 2003).
-
5.
Infectious Disease Surveillance Information System (ISIS) (Widdowson et al., 2003) is an automated outbreak detection system for all types of pathogens in the Netherlands.
-
6.
Early Aberration Reporting System (EARS) is developed by Center for Disease Control (CDC) (Hutwagner et al., 2003) and enables national, state and local health departments to analyse public health surveillance data using a collection of anomaly detection methods.
-
7.
Japan National Institute of Infectious Diseases (NIID) (Ohkusa et al., 2005) has developed syndromic surveillance system to analyse over the counter sales data, outpatient visits, and ambulance transfer data in Tokyo.
We now provide a detailed description of two of the popular traditional syndromic surveillance system, namely BioSense and PHE ReSST.
BioSense
BioSense444http://www.cdc.gov/BioSense/ (Retrieved March 4, 2015). is a syndromic surveillance system in the United State which is part of CDC’s Public Health Information Network framework. By monitoring the size, location and rate of spread of an outbreak, it detects an outbreak at the local, state and national levels. It monitors seasonal trends for influenza and other disease indicators. BioSense concentrates on syndrome categories including fever, respiratory, gastrointestinal illness (GI), hemorrhagic illness, localised cutaneous lesion, lymphadenitis, neurologic, rash, severe illness and death, specific infection, and botulism.
BioSense collects and shares information on emergency department visits, hospitalisations, clinical laboratory test orders, over-the-counter (OTC) drug sales and other health related data from multiple sources, including the Department of Veterans Affairs (VA), the Department of Defense (DoD), and civilian hospitals from around the USA. BioSense uses multiple analysing methods such as CUSUM (Page, 1954), EWMA (Roberts, 1959) and SMART (Kleinman et al., 2004).
PHE ReSST
The Public Health England (PHE)555http://www.hpa.org.uk/ (Retrieved March 4, 2015). Real-time Syndromic Surveillance Team (ReSST) generates regular syndromic surveillance reports by collaborating with numerous national syndromic surveillance systems including the NHS Direct syndromic surveillance system. The NHS Direct syndromic surveillance system monitors the nurse-led telephone helpline data collected electronically by NHS Direct sites and generates alarms when call numbers are considerably higher than preceding years, after considering holiday and seasonal effects. It has the potential to detect large scale events, but is less likely to detect smaller and localised outbreaks (Doroshenko et al., 2005). In addition, ReSST obtains data from GP In-Hours and GP Out-of-Hours syndromic surveillance systems which monitor daily consultations for a range of clinical syndromic indicators and community-based morbidity, recorded by GP practices inside and outside of routine surgery opening times, respectively.
4.2 Internet-Based Syndromic Surveillance Systems
There are other real-time disease event detection systems which employ different approaches from the systems discussed in Section 4.1. They monitor online media from global sources, instead of monitoring disease cases reported by health related organisations such as hospitals and clinics. These “systems are built on top of open sources, exemplifying an idea of open development for public health informatics applications” (Chen et al., 2010). Though the modern systems are faster than traditional syndromic surveillance systems in detecting an anomaly in public health (Signorini et al., 2011; Ginsberg et al., 2008), they are vulnerable to a high rate of false positives in case of an unusual event within a population (Ginsberg et al., 2008). This section describes some of the well known modern syndromic surveillance systems.
Google Flu Trends
Google Flu Trends666http:// www.google.com/flutrends/ (Retrieved March 7, 2014)., established by Google, is a Web-based tool for near real-time detection of regional outbreaks of influenza (Ginsberg et al., 2008). It monitors and analyses health-care seeking behaviour in the form of queries to its online search engine. According to Carneiro and Mylonakis (2009) “all the people searching for influenza-related topics are not ill, but trends emerge when all influenza-related searches are added together”; Consequently, there is a close relationship between the number of people searching for influenza-related topics and those who have influenza symptoms. Section 6 provides more information about Google Flu Trends.
Argus
The Argus system is a web-based global biosurveillance system designed to report and track the development of biological events threatening human, plant and animal health globally, excluding the USA (on Homeland Security. Subcommittee on Emerging Threats and Cybersecurity, 2009). It is developed at Georgetown University and funded by the United States Government.
It automatically collects local and native language internet media reports including blogs and official sources such as World Health Organisation (WHO) and World Organisation for Animal Health (OIE) and infers their importance according to keywords appropriate to infectious disease surveillance (Nelson et al., 2010). It relies on a human team of multilingual data analysts to assess the relations between the online media and presence of adverse health events (Chen et al., 2010). In particular, the data analysts monitor several thousand Internet sources daily. Then, six time in each day, they use Boolean keyword searching and Bayesian model tools (McCallum and Nigam, 1998) to select relevant media reports (Nelson et al., 2010). Based on the selected media reports, they write their own report and post them on a secure Internet portal to be accesses with Argus users.
Since its operation in July 2000, “it has logged more than 30,000 biological events involving pathogens such as avian influenza, the Ebola virus, cholera, and other unusual pathogens that have caused varying states of social disruption throughout the world” (CDC, First Quarter 2008).
GermTrax
GermTrax777http://www.germtrax.com/ (Retrieved Oct 4, 2015). is a freely accessible website which gathers sickness and disease data from people worldwide and exhibits trends through an interactive map. More specifically, GermTrax is a collaborative disease tracking system which primarily relies on reports filled by ordinary people who are sick. This system collects information through user personal updates on social media websites such as Facebook and Twitter. Then, the system saves user geo-location data, while the users connect their social media accounts with the site. According to their website, GermTrax can help people by informing them of places where they might get sick and help health experts to discover large-scale sickness trends. Since it principally relies on disease reports from ordinary people, it is suitable for non-specific conditions such as colds and flu (Lan et al., 2012).
Health Map
Health Map888http://www.healthmap.org (Retrieved Oct 4, 2015). is a multi stream real-time surveillance system and freely accessible. It monitors online information in order to obtain a comprehensive view of current infectious disease outbreaks globally. It observes, filters, visualises, and distributes online information about emerging infectious diseases for the benefit of diverse audience from public health officials to international tourists (Lemon et al., 2007). Health Map gathers reports from 14 sources, which in turn embody information from over 20,000 web sites every hour. Information is obtained automatically through screen scraping, natural language interpretation, text mining, and parsing (Brownstein et al., 2008). More specifically, Health Map use multiple web based data sources including online news sources, expert-curated discussion, and validated official reports from organisations such as the World Health Organisation (WHO999http://www.who.int/en/(Retrieved Oct 4, 2015).). Then, the alerts are classified by location and disease using automated text processing algorithms. Next, the system overlays the alerts on an interactive geographic map. According to Freifeld et al. (2008) “The filtering and visualization features of HealthMap thus serve to bring structure to an otherwise overwhelming amount of information, enabling the user to quickly and easily see those elements pertinent to her area of interest”.
5 Statement of the Problem
While traditional syndromic surveillance systems can detect an outbreak with high accuracy, they suffer from slow response. For example, Centers for Disease Control and Prevention (CDC) publishes USA national and regional data typically with a 1-2 week reporting lag using outpatient reporting and virological test results provided by laboratories nationally (Culotta, 2010, 2013; Ginsberg et al., 2008). Therefore, such systems cannot predict an outbreak, but only can detect them after the onset.
On the other hand, modern syndromic surveillance systems monitor online media from global sources. Such modern syndromic surveillance systems resort to internet based data such as search engine queries, health news, and people posts on social networks to predict an outbreak earlier (Signorini et al., 2011; Carneiro and Mylonakis, 2009; Corley et al., 2010). While some of them claim that they could achieve high accuracy, the rate of false alarms is unknown. Ginsberg et al. (2008) state, regarding Google Flu Trends, that “Despite strong historical correlations, our system remains susceptible to false alerts caused by a sudden increase in ILI-related queries. An unusual event, such as a drug recall for a popular cold or flu remedy, could cause such a false alert”. Therefore, an issue with internet based data sources is that their data quality fluctuates over time.
Moreover, most of these modern syndromic surveillance systems rely on one type of internet based data sources and disregard the advantage of other type of data sources, which are discussed in Section 3 (page 3). Consequently, they are only suitable for places where their source data is sufficiently available. For example, Twitter based systems cannot have a high accuracy for places where using twitter is not very common, if accessible. In addition, the quality and availability of data sources may change over time. For instance, Twitter may lose its popularity or become inaccessible in a place. Hence, integrating available data sources according to an adaptive weighting scheme over time seems necessary.
The other area that has received attention in the syndromic surveillance literature is the topic of alternative analysis algorithms for a given data sources. Given that the quality of data sources change over time, and the most suitable algorithm for a given data source is not known a priori, a reasonable response is to consider analysing each data source with a variety of algorithms and integrate their results.
Against this background, we believe, based on plentiful available data sources and analysis techniques, a state of the art syndromic surveillance mechanism should:
-
1.
Perform as an ensemble to combine various analysis algorithms with the objective of increasing syndromic surveillance system performance. There are many different techniques with different strengths and weaknesses. An ensemble which utilises a combination of them seems likely to be able provide higher performance than systems which are depended on only one technique.
-
2.
Extract information which resides in different data sources. In addition to obtaining information, it should be capable of integrating them according to their relevance and varying quality.
-
3.
Be flexible to changes in composition of algorithms and data sources over time as any of them might be deleted, temporarily unavailable, or added to the system at any time.
-
4.
Be able to adapt to its corresponding monitored population behaviour and habits. For example, if people of a particular region are more prone to tweet their feeling in social media such as Twitter than searching for a solution using online search engines, then a syndromic surveillance system should weight twitter results higher than a search engine queries in that particular region.
-
5.
Be able to adapt to the changes of its corresponding population behaviour. For example, if twitter become more popular in a place and people start tweeting their sickness symptoms earlier, rather than visiting a physician, the system must give more attention and weight to twitter than previously.
-
6.
Minimise the effect of misleading factors and noise such as advertisement, promotions, and holidays on different data sources and, consequently, diminish the rate false positives.
Jahedpari et al. (2017) proposed Continuous Artificial Prediction Market (c-APM), which utilizes the concept of prediction markets in which the traders are modeled as intelligent agents. The model can be used as a machine learning ensemble by integrating different data sources and techniques.
In here, we suggest that c-APM can be used as a syndromic surveillance technique as it fulfills the aforementioned requirements as we discuss below:
-
1)
c-APM can behave as an ensemble method by including numerous agents, each having different analysis algorithms.
-
2)
Prediction markets are specially designed for the purpose of information aggregation (Perols et al., 2009). c-APM adapt the prediction markets’ concepts and incentives it participating agents to share their private information through market mechanism, hence make accurate prediction. In addition, c-APM dynamically weights the prediction of different agents according to their varying quality.
-
3)
In c-APM, market and other agents operate independently and hence absence or presence of an agent does not impact the system considerably. Therefore, if one of the existing data sources becomes unavailable for any reasons, c-APM can simply respond to the issue. If a new data source or a model is discovered, c-APM can simply create an agent to access that data source or model to participate in the market and share its knowledge.
-
4)
In c-APM, the agents can be trained in the market using historical data of that place and, consequently will be adapted to behaviour of people in that place.
-
5)
c-APM can respond to the changes of its corresponding population behaviour since its agents keep learning and their weights keep changing according to their current performance in each market.
-
6)
c-APM can minimise the effect of misleading factors and noise by fusing various data sources and models using an adoptable scheme.
In the following sections, we use two well-known models of (i) Google Flu Trends, and (ii) the latest improvement of Google Flu Trends model, named as GP (Lampos et al., 2015), as our case study and we show how c-APM can improve upon their performance.
6 Google Flu Trends Case Study
Google Flu Trends (GFT) was launched by Google in 2008 to alert health professionals to outbreaks early by indicating when and where influenza is striking in real time using aggregate web searches. GFT publishes flu predictions (ILI rate) for more than 25 countries. Google Flu Trends is typically more immediate, up to 2 weeks ahead of traditional methods such as the CDC’s official reports. The basic idea behind GFT is that when people get sick, they turn to the Web for information.
Google Flu Trends algorithms recognise a small subgroup of the millions of search engine query terms that deliver the maximum correlation with the CDC published ILI rate. Then a subset of these queries which fit the historical CDC ILI rate data most accurately are chosen. Finally, univariate linear regression model is trained to be used in predicting future ILI rate using each day queries. According to Copeland et al. (2013) the challenge of their approach is the varying volumes of a particular query over time. For instance, during the holiday season, more people search for ‘gift’ than at any other period. Similarly, overall usage of Google search varies throughout the year and is growing over time. GFT used the official CDC data only in the initial training and did not use it to re-train its model regularly101010http://googleresearch.blogspot.ae/2014/10/google-flu-trends-gets-brand-new-engine.html (Retrieved Oct 4, 2015)..
The early Google paper indicated that the Google Flu Trends predictions were 97% accurate comparing with CDC data (Ginsberg et al., 2009). However, in 2013, Olson et al. (2013) and Butler (2013) reported that GFT was predicting more than double that of CDC published. Later in 2014, Lazer et al. (2014) stated that GFT has been overestimating flu occurrence for most weeks after August 2011 and by a very large margin in the 2011-2012 flu season. He continued stating GFT can achieve better performance by combining its prediction with other near realtime health data such as lagged CDC data. Also, Google Flu Trend team announced111111http://blog.google.org/2013/10/flu-trends-updates-model-to-help.html (Retrieved Oct 4, 2015).
“We found that heightened media coverage on the severity of the flu season resulted in an extended period in which users were searching for terms we’ve identified as correlated with flu levels. In early 2013, we saw more flu-related searches in the US than ever before.”
GFT subsequently updated the model in response to concerns about accuracy. In 9th August 2015, GFT stopped publishing flu predictions without formally presenting any reasons. However, GFT historical prediction are still available for download.
6.1 Comparison of c-APM and GFT
In this section, we use c-APM as a syndromic surveillance system and compare the performance of c-APM and Google Flue Trend.
6.1.1 Experimental Setup
In these experiments, c-APM predicts the disease activity level of influenza-like illnesses (ILI) in a given week in the whole of the USA using publicly available data sources. The data used here contains more than 100 real data sources covering the period 4th January 2004 (when GFT provides data for most of USA states and cities) to 9th August 2015 (when GFT stopped publishing their results online), from the two data sources of Google Flu Trends (GFT) and Centers for Disease Control and Prevention (CDC).
Data Sources
In these experiments, we use weekly Google Flu Prediction for different areas of the United States including states, cities and regions121212 This data can be accessed from https://www.google.org/flutrends/about. (Retrieved Oct 4, 2015)., for which GFT data is available since January 2004.
In here, we use the calendar definition of year where a year starts on 1st January and finishes on 31st December.
The CDC Influenza Division produces a weekly report on influenza-like illness131313ILI is defined as fever (temperature of 100∘F [37.8∘C] or greater) and a cough and/or a sore throat without a known cause other than influenza (http://www.cdc.gov/flu/weekly/overview.htm) (Retrieved Oct 4, 2015). activity in the USA141414 This data can be accessed from http://gis.cdc.gov/grasp/fluview/fluportaldashboard.html. (Retrieved Oct 4, 2015).. We use CDC statistics including: i) ILI rate disaggregated by age groups (0-4 years, 5-24 years, 25-64 years, and older than 65 years), ii) USA national ILI rate, iii) total number of patients and iv) total number of outpatient healthcare providers in U.S. Outpatient Influenza-like Illness Surveillance Network (ILI network). Since CDC reports ILI rates with a two-week time lag, we use CDC data of two weeks earlier for each week of the experimentation period. In this way, we can align CDC data with the other data sources used in these experiments.
Models
We use different machine learning models in R’s caret package (version 6.0-37), which are capable of performing regression. Table 1 presents the models we use in this experiment. Model parameters are set to their default values.
| Model Full Name | Mdoel Short Name |
|---|---|
| Bagged CART | treebag |
| Conditional Inference Random Forest | cforest |
| Random Forest | rf |
| Multi-Layer Perceptron | mlp |
| Model Averaged Neural Network | avNNet |
| Boosted Generalized Linear Model | glmboost |
| Boosted Tree Linear Regression | blackboost |
| Linear Regression | lm |
| Radial Basis Function Network | rbf |
| Gaussian Process | gaussprLinear |
| CART | rpart |
| Generalized Linear Model | glm |
| k-Nearest Neighbors | knn |
| Gaussian Process with Polynomial Kernel | gaussprPoly |
| Multivariate Adaptive Regression Spline | earth |
| Self-Organizing Map | bdk |
Experiment Settings
We constructed an c-APM in which every agent has a unique analysis model corresponding to one of the models listed in Table 1. The data source for each agent is the entire data set. All agents use Q-learning trading strategy, which is proposed in Jahedpari et al. (2017). The results are based on one run only, as they are deterministic. All c-APM parameters are set to their default parameters (see (Jahedpari, 2016)). Hence:
-
i)
The number of rounds is set to 2,
-
ii)
and is set to , in the first round, and
-
iii)
and are set to and respectively, in the second round.
We measure the performance of c-APM by comparing the prediction of c-APM against the ground truth, which is the weekly ILI rate published by CDC. We use Mean Absolute Error (MAE), which is a common measure, in this literature.
6.1.2 Experimental Results
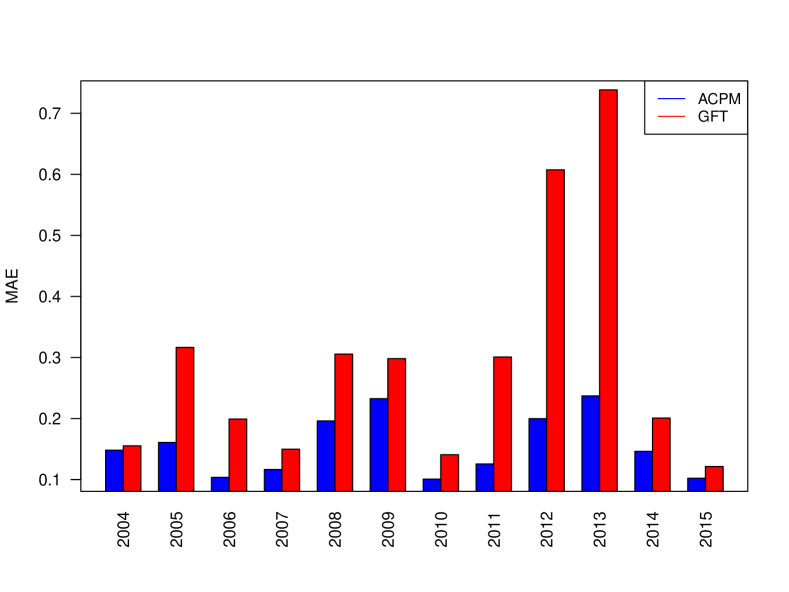
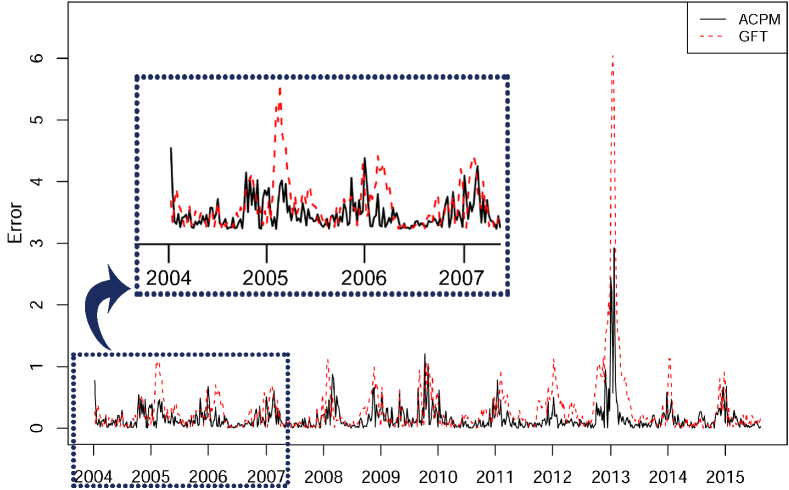
In this section, we compare the performance of c-APM and Google Flu Trends. Figure 3 and Figure 4 compare the error of c-APM and Google Flu Trend for the period between to .
As Figure 3 shows, c-APM typically has a lower, sometimes much lower, MAE to that of Google Flu Trends in each year. Though this difference is relatively small in some years like 2004 and 2007, it is relatively large in most years and very large between 2011 and 2013. Table 2 shows the exact MAE value of c-APM and GFT in addition to t-test p-values. The null hypothesis is that the two accuracies compared are not significantly different. Therefore, within a tolerance , when p-value , c-APM is significantly better than GFT. As the table shows the results are highly significant in most years and also during the entire period of 2004-2015 (p-value ).
Figure 4 shows that c-APM performs poorly for the first few markets which we attribute to the learning period. However, after several markets, c-APM achieves higher performance than Google Flu Trend in most weeks. c-APM uses CDC data as one of its data sources, and since CDC report the data with two weeks time lags, c-APM uses the CDC data of the previous two weeks. This explains the existence of two weeks time lag between c-APM and GFT error in some periods such as early 2008 and late 2012.
| Periods |
|
|
P-value | ||||
|---|---|---|---|---|---|---|---|
| 2004 | 0.148 | 0.155 | 3.73E-01 | ||||
| 2005 | 0.161 | 0.317 | 5.82E-05 | ||||
| 2006 | 0.104 | 0.199 | 7.89E-04 | ||||
| 2007 | 0.117 | 0.150 | 4.42E-02 | ||||
| 2008 | 0.196 | 0.305 | 4.15E-03 | ||||
| 2009 | 0.233 | 0.298 | 5.66E-02 | ||||
| 2010 | 0.101 | 0.141 | 2.18E-02 | ||||
| 2011 | 0.126 | 0.301 | 2.33E-08 | ||||
| 2012 | 0.200 | 0.607 | 3.12E-09 | ||||
| 2013 | 0.237 | 0.738 | 4.64E-04 | ||||
| 2014 | 0.146 | 0.201 | 4.85E-02 | ||||
| 2015 | 0.102 | 0.121 | 1.57E-01 | ||||
| 2004-2015 | 0.158 | 0.301 | 2.34E-17 |
7 GP Case Study
Lampos et al. (2015) published a paper in Nature Scientific Reports on 3rd August 2015 proposing a new model, called ‘GP’. Their model includes three improvements to the original Google Flu Trend. Firstly, they expand and re-weight the set of queries which are originally used by GFT. Then, they expand this improvement by using a nonlinear regression framework based on a Gaussian Process (GP) to investigate nonlinear relationship between query fractions and the ground truth (CDC ILI rate). Finally, they utilise time series structure. More specifically, they use ARMAX model (Hyndman and Khandakar, 2008) to find a relationship between previously available data and the current one.
They perform an evaluation using five consecutive influenza seasons, as defined by CDC, from 2008 to 2013. Based on their experiments, they conclude that GP approach performs better than GFT and a well established model, namely Elastic Net. They also mentioned that 2009-10 flu season is a unique flu period since during the peak of that flu season, GFT over-predicted the ILI rate, while GP and Elastic Net underestimated the ILI rate.
7.1 Comparison of c-APM and GP
This section compares the performance of c-APM and the model proposed by Lampos et al. (2015), known as the ‘GP’ model. We contacted the author and received their exact prediction for each experimented period to use in our experiments.
7.1.1 Experimental Setup
All settings are similar to the settings covered in Section 6.1.1 (page 6.1.1), except the part that c-APM includes on additional agent which uses GP prediction as its data source. The agent uses a simple algorithm which gives the prediction equal to the receiving data, hence no analysis is performed by the agent on that data.
7.1.2 Experimental Results
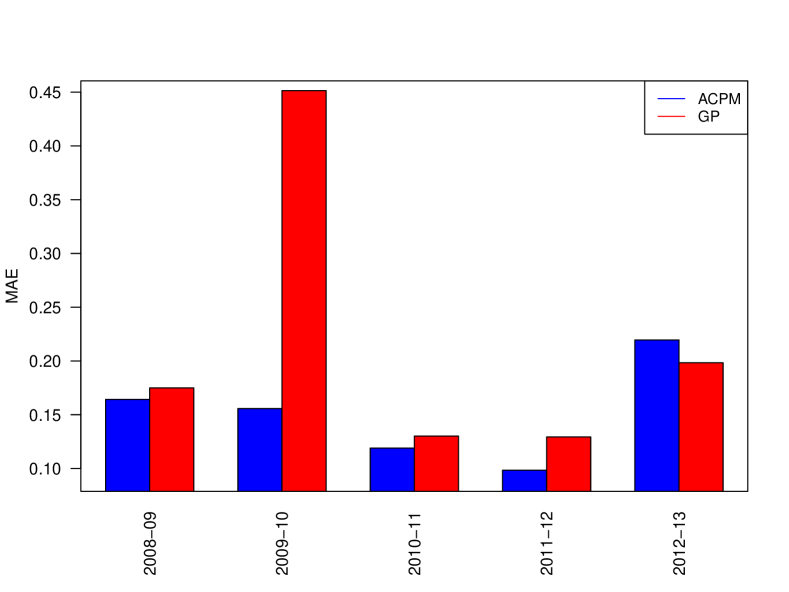
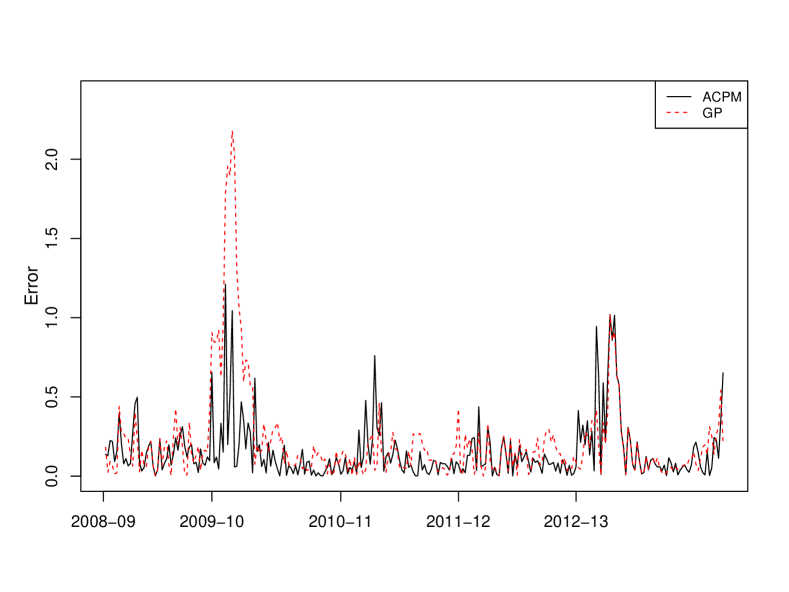
Figures 5 and Table 3 compare the performance of c-APM and GP for different influenza seasons between 2008 and 2013. Figure 6 compares the error of c-APM and GP in each week of the entire period. In Table 3, the first column shows the experimented influenza seasons and the second column presents the number of weeks in each season. The third and the fourth columns show the Mean Absolute Error (MAE) of c-APM and GP respectively. The last column shows p-values for the paired t-tests comparing the error of c-APM and GP.
As Table 3 and Figure 5 show c-APM outperforms GP in most years except 2012-2013, where c-APM achieves MAE of and GP achieves MAE of . As shown by Figure 6, this is mainly because of lower performance of c-APM compared to GP in early weeks of 2012-13 flu seasons. A few weeks earlier than that, in the late 2011-12 flu season, GP performs worse than c-APM which infers that the GP agent performs worse than the other c-APM agents. By reaching 2012-13 flu season, suddenly GP agent performance improves compared to other c-APM agents who mainly use GFT data. Given that GP agents had lower performance previously (in late 2011-12 flu season) compared to other c-APM agents, c-APM relies more on other participating agents than GP agent. Once the performance of GP improves (in early 2012-13 flu seasons), GP outperforms c-APM for a several number of weeks. However, as shown by Figure 6, c-APM recovers rapidly and adapts to the new conditions of the markets (i.e changing quality of market participants) in a few weeks.
As mentioned earlier, Lampos et al. (2015) states that that 2009-10 flu season is a unique flu period since none of the models experimented by them nor GFT could make prediction close to the ground truth (CDC data). Interestingly, c-APM achieves much less error than GP in 2009-10 as shown by Figure 5.
| Period | Weeks |
|
|
P-value | ||||
|---|---|---|---|---|---|---|---|---|
| 2008-09 | 48 | 0.164 | 0.175 | 2.75E-01 | ||||
| 2009-10 | 57 | 0.156 | 0.451 | 7.40E-06 | ||||
| 2010-11 | 52 | 0.119 | 0.130 | 3.22E-01 | ||||
| 2011-12 | 52 | 0.098 | 0.129 | 6.31E-03 | ||||
| 2012-13 | 65 | 0.220 | 0.198 | 8.73E-01 | ||||
| 2008-2013 | 274 | 0.155 | 0.221 | 3.65E-05 |
8 Analysis
c-APM outperforms both the Google Flu Trend and GP models because:
-
i)
c-APM integrates different data sources such as CDC reports and Google Flu Trend prediction for different states and cities of USA.
-
ii)
c-APM analyses each data source with a variety of machine learning models and combines their results.
-
iii)
c-APM adjusts the influence of agents on market prediction automatically according to their quality. Over time, high quality agents – either because of their effective analysis model or accessing high quality data source – gain more revenue than low quality agents. Therefore, high quality agents accumulate more budget and they can make larger investment on their prediction than poor performing agents. Subsequently, high quality agents achieve larger influence in the market as the integration function weights each prediction by its corresponding investment amount.
-
iv)
c-APM adapts to the dynamic environment where the quality of data sources and the performance of a model on each data source fluctuates over time. Once the quality of an agent prediction changes, its performance in the market is affected and hence the influence of agents on the market prediction is tuned according to their current quality, as explained above.
-
v)
The Q-learning trading strategy causes high quality agents lead the market by preserving their original prediction and low quality agents follow them and hence minimise their negative effect on forming market prediction.
-
vi)
c-APM can minimise the effect of misleading factors and noise since c-APM integrates various data sources and combines the result of different machine learning models, while dynamically changing their weight according to their varying quality. For example, as shown by Figure 4, Google Flu Trend overestimated the Flu rate by large extent in 2013 due to a misleading factor which is a heightened media coverage on the severity of the flue (Stefansen, 2013). Since Google Flu Trend is being used as one of c-APM data sources, c-APM also overestimates the Flu rate to some extent but much less than Google Flu Trend. In c-APM, as soon as an agent loses its quality, it either loses most of its budget or learns to improve its prediction using wisdom of the crowd as advised by its Q-learning trading strategy. Therefore, its original influence on the market prediction decreases and c-APM relies to other agents with higher current performance. In the similar way, once the quality of an agent improves, the influence of the agent on forming the market prediction increases.
References
- Achrekar et al. [2011] H. Achrekar, A. Gandhe, R. Lazarus, S.-H. Yu, and B. Liu. Predicting flu trends using twitter data. In Computer Communications Workshops (INFOCOM WKSHPS), 2011 IEEE Conference on, pages 702–707. IEEE, 2011.
- Brownstein et al. [2008] J. S. Brownstein, C. C. Freifeld, B. Y. Reis, and K. D. Mandl. Surveillance sans frontieres: Internet-based emerging infectious disease intelligence and the healthmap project. PLoS medicine, 5(7):e151, 2008.
- Buehler et al. [2003] J. W. Buehler, R. L. Berkelman, D. M. Hartley, and C. J. Peters. Syndromic surveillance and bioterrorism-related epidemics. Emerging infectious diseases, 9(10):1197, 2003.
- Buehler et al. [2008] J. W. Buehler, A. Sonricker, M. Paladini, P. Soper, and F. Mostashari. Syndromic surveillance practice in the united states: findings from a survey of state, territorial, and selected local health departments. Advances in Disease Surveillance, 6(3):1–20, 2008.
- Butler [2013] D. Butler. When google got flu wrong. Nature, 494(7436):155, 2013.
- Carneiro and Mylonakis [2009] H. A. Carneiro and E. Mylonakis. Google trends: a web-based tool for real-time surveillance of disease outbreaks. Clinical infectious diseases, 49(10):1557–1564, 2009.
- CDC [First Quarter 2008] CDC. CDC global health E-Brief, building usg interagency collaboration through global health engagement, First Quarter 2008.
- Chen et al. [2010] H. Chen, D. Zeng, P. Yan, and P. Yan. Infectious Disease Informatics: Syndromic Surveillance for Public Health and Biodefense. Integrated series in information systems. Springer Science + Business Media, 2010.
- Collier et al. [2008] N. Collier, S. Doan, A. Kawazoe, R. M. Goodwin, M. Conway, Y. Tateno, Q.-H. Ngo, D. Dien, A. Kawtrakul, K. Takeuchi, et al. Biocaster: detecting public health rumors with a web-based text mining system. Bioinformatics, 24(24):2940–2941, 2008.
- Copeland et al. [2013] P. Copeland, R. Romano, T. Zhang, G. Hecht, D. Zigmond, and C. Stefansen. Google disease trends: an update. Nature, 457:1012–1014, 2013.
- Corley et al. [2010] C. D. Corley, D. J. Cook, A. R. Mikler, and K. P. Singh. Text and structural data mining of influenza mentions in web and social media. International journal of environmental research and public health, 7(2):596–615, 2010.
- Culotta [2010] A. Culotta. Detecting influenza outbreaks by analyzing twitter messages. CoRR, abs/1007.4748, 2010.
- Culotta [2013] A. Culotta. Lightweight methods to estimate influenza rates and alcohol sales volume from twitter messages. Language Resources and Evaluation, pages 1–22, 2013.
- Doroshenko et al. [2005] A. Doroshenko, D. Cooper, G. Smith, E. Gerard, F. Chinemana, N. Verlander, A. Nicoll, et al. Evaluation of syndromic surveillance based on national health service direct derived data: England and wales. MMWR Morb Mortal Wkly Rep, 54(Suppl):117–122, 2005.
- Eysenbach [2006] G. Eysenbach. Infodemiology: tracking flu-related searches on the web for syndromic surveillance. In AMIA Annual Symposium Proceedings, volume 2006, page 244. American Medical Informatics Association, 2006.
- Eysenbach [2009] G. Eysenbach. Infodemiology and infoveillance: framework for an emerging set of public health informatics methods to analyze search, communication and publication behavior on the internet. Journal of medical Internet research, 11(1), 2009.
- Freifeld et al. [2008] C. C. Freifeld, K. D. Mandl, B. Y. Reis, and J. S. Brownstein. Healthmap: global infectious disease monitoring through automated classification and visualization of internet media reports. Journal of the American Medical Informatics Association, 15(2):150–157, 2008.
- Ginsberg et al. [2008] J. Ginsberg, M. H. Mohebbi, R. S. Patel, L. Brammer, M. S. Smolinski, and L. Brilliant. Detecting influenza epidemics using search engine query data. Nature, 457(7232):1012–1014, 2008.
- Ginsberg et al. [2009] J. Ginsberg, M. H. Mohebbi, R. S. Patel, L. Brammer, M. S. Smolinski, and L. Brilliant. Detecting influenza epidemics using search engine query data. Nature, 457(7232):1012–1014, 2009.
- Grishman et al. [2002] R. Grishman, S. Huttunen, and R. Yangarber. Information extraction for enhanced access to disease outbreak reports. Journal of biomedical informatics, 35(4):236–246, 2002.
- Hutwagner et al. [2003] M. L. Hutwagner, M. W. Thompson, G. M. Seeman, and T. Treadwell. The bioterrorism preparedness and response early aberration reporting system (ears). Journal of Urban Health, 80(1):i89–i96, 2003.
- Hyndman and Khandakar [2008] R. Hyndman and Y. Khandakar. Automatic time series forecasting: The forecast package for r. Journal of Statistical Software, 27(1):1–22, 2008.
- Jahedpari [2016] F. Jahedpari. Artificial prediction markets for online prediction of continuous variables. PhD thesis, University of Bath, 2016.
- Jahedpari et al. [2017] F. Jahedpari, T. Rahwan, S. Hashemi, T. P. Michalak, M. De Vos, J. Padget, and W. L. Woon. Online prediction via continuous artificial prediction markets. IEEE Intelligent Systems, 32(1):61–68, 2017.
- Johnson et al. [2004] H. A. Johnson, M. M. Wagner, W. R. Hogan, W. Chapman, R. T. Olszewski, J. Dowling, G. Barnas, et al. Analysis of web access logs for surveillance of influenza. Stud Health Technol Inform, 107(Pt 2):1202–1206, 2004.
- Kleinman et al. [2004] K. Kleinman, R. Lazarus, and R. Platt. A generalized linear mixed models approach for detecting incident clusters of disease in small areas, with an application to biological terrorism. American Journal of Epidemiology, 159(3):217–224, 2004.
- Lampos and Cristianini [2010] V. Lampos and N. Cristianini. Tracking the flu pandemic by monitoring the social web. In Cognitive Information Processing (CIP), 2010 2nd International Workshop on, pages 411–416. IEEE, 2010.
- Lampos et al. [2015] V. Lampos, A. C. Miller, S. Crossan, and C. Stefansen. Advances in nowcasting influenza-like illness rates using search query logs. Scientific reports, 5, 2015.
- Lan et al. [2012] R. Lan, M. D. Lieberman, and H. Samet. The picture of health: map-based, collaborative spatio-temporal disease tracking. In Proceedings of the First ACM SIGSPATIAL International Workshop on Use of GIS in Public Health, pages 27–35. ACM, 2012.
- Lazer et al. [2014] D. Lazer, R. Kennedy, G. King, and A. Vespignani. The parable of google flu: traps in big data analysis. Science, 343(14 March), 2014.
- Lemon et al. [2007] S. M. Lemon, M. A. Hamburg, P. F. Sparling, E. R. Choffnes, A. Mack, et al. Global Infectious Disease Surveillance and Detection: Assessing the Challenges–Finding Solutions, Workshop Summary. National Academies Press, 2007.
- Lewis et al. [2002] M. D. Lewis, J. A. Pavlin, J. L. Mansfield, S. O?Brien, L. G. Boomsma, Y. Elbert, and P. W. Kelley. Disease outbreak detection system using syndromic data in the greater Washington DC area. American journal of preventive medicine, 23(3):180–186, 2002.
- Linge et al. [2009] J. P. Linge, R. Steinberger, T. Weber, R. Yangarber, E. van der Goot, D. Al Khudhairy, and N. Stilianakis. Internet surveillance systems for early alerting of health threats. Euro surveillance, 14(AVRJUIN):200–201, 2009.
- Lober et al. [2003] W. B. Lober, M. L. J. Trigg, B. T. Karras, M. D. Bliss, J. Ciliberti, M. L. Stewart, and J. S. Duchin. Syndromic surveillance using automated collection of computerized discharge diagnoses. Journal of Urban Health, 80(1):i97–i106, 2003.
- Lombardo and Buckeridge [2007] J. Lombardo and D. Buckeridge. Disease Surveillance: A Public Health Informatics Approach. Wiley, 2007.
- Mandl et al. [2004] K. D. Mandl, J. M. Overhage, M. M. Wagner, W. B. Lober, P. Sebastiani, F. Mostashari, J. A. Pavlin, P. H. Gesteland, T. Treadwell, E. Koski, et al. Implementing syndromic surveillance: a practical guide informed by the early experience. Journal of the American Medical Informatics Association, 11(2):141–150, 2004.
- Mawudeku and Blench [2006] A. Mawudeku and M. Blench. Global public health intelligence network (gphin). In 7th Conference of the Association for Machine Translation in the Americas, pages 8–12, 2006.
- McCallum and Nigam [1998] A. McCallum and K. Nigam. A comparison of event models for naive bayes text classification. In AAAI-98 workshop on learning for text categorization, volume 752, pages 41–48, 1998.
- Nelson et al. [2010] N. Nelson, J. Brownstein, D. Hartley, et al. Event-based biosurveillance of respiratory disease in mexico, 2007-2009: connection to the 2009 influenza a (h1n1) pandemic. Euro Surveill, 15(30), 2010.
- Ohkusa et al. [2005] Y. Ohkusa, M. Shigematsu, K. Taniguchi, and N. Okabe. Experimental surveillance using data on sales of over-the-counter medications-japan, November 2003–April 2004. MMWR Morb Mortal Wkly Rep, 54:47–52, 2005.
- Olson et al. [2013] D. R. Olson, K. J. Konty, M. Paladini, C. Viboud, and L. Simonsen. Reassessing google flu trends data for detection of seasonal and pandemic influenza: a comparative epidemiological study at three geographic scales. PLoS Comput Biol, 9(10):e1003256, 2013.
- on Homeland Security. Subcommittee on Emerging Threats and Cybersecurity [2009] U. S. C. H. C. on Homeland Security. Subcommittee on Emerging Threats and Cybersecurity. One year later: implementing the biosurveillance requirements of the 9/11 Act: hearing before the Subcommittee on Emerging Threats, Cybersecurity, and Science and Technology of the Committee on Homeland Security, House of Representatives, One Hundred Tenth Congress, second session, July 16, 2008, volume 4. Government Printing Office, 2009.
- Page [1954] E. Page. Continuous inspection schemes. Biometrika, 41(1/2):100–115, 1954.
- Paul et al. [2014] M. J. Paul, M. Dredze, and D. Broniatowski. Twitter improves influenza forecasting. PLoS currents, 6, 2014.
- Perols et al. [2009] J. Perols, K. Chari, and M. Agrawal. Information market-based decision fusion. Management Science, 55(5):827–842, 2009.
- Polgreen et al. [2008] P. M. Polgreen, Y. Chen, D. M. Pennock, F. D. Nelson, and R. A. Weinstein. Using internet searches for influenza surveillance. Clinical infectious diseases, 47(11):1443–1448, 2008.
- Reichard et al. [2004] G. Reichard, P. Demitry, and J. Catalino. Cohort: An integrated information approach to decision support for military subpopulation health care. Technical report, Air Force Medical Operations Agency, AFMOA/SGZI,5201 Leesburg Pike Sky 3, Ste 1400,Falls Church,VA,22041-3203, 2004.
- Reilly et al. [1968] A. R. Reilly, E. A. Iarocci, C. M. Jung, D. M. Hartley, and N. P. Nelson. Indications and warning of pandemic influenza compared to seasonal influenza. Indicator, 1967(128), 1968.
- Roberts [1959] S. W. Roberts. Control chart tests based on geometric moving averages. Technometrics, 1(3):239–250, 1959.
- Signorini et al. [2011] A. Signorini, A. M. Segre, and P. M. Polgreen. The use of twitter to track levels of disease activity and public concern in the U.S. during the Influenza A H1N1 Pandemic. PLoS ONE, 6:e19467, 05 2011.
- Stefansen [2013] C. Stefansen. Flu trends updates model to help estimate flu levels in the us, 10 2013.
- Tsui et al. [2003] F.-C. Tsui, J. U. Espino, V. M. Dato, P. H. Gesteland, J. Hutman, and M. M. Wagner. Technical description of rods: a real-time public health surveillance system. Journal of the American Medical Informatics Association, 10(5):399–408, 2003.
- Van den Wijngaard et al. [2008] C. Van den Wijngaard, L. Van Asten, W. Van Pelt, N. J. Nagelkerke, R. Verheij, A. J. De Neeling, A. Dekkers, M. A. Van der Sande, H. Van Vliet, and M. P. Koopmans. Validation of syndromic surveillance for respiratory pathogen activity. Emerging infectious diseases, 14(6):917, 2008.
- Widdowson et al. [2003] M.-A. Widdowson, A. Bosman, E. van Straten, M. Tinga, S. Chaves, L. van Eerden, and W. van Pelt. Automated, laboratory-based system using the internet for disease outbreak detection, the netherlands. Emerging infectious diseases, 9(9):1046, 2003.
- World Health Organization [2013] World Health Organization. Public health surveillance, Februray 2013.