Constraining light dark matter upscattered by ultrahigh-energy cosmic rays
Abstract
Light halo dark matter (DM) particles upscattered by high-energy cosmic rays (CRs) can be energetic, and become detectable by conventional direct detection experiments. The current constraints derived from space-based direct CR measurements can reach for a constant DM-nucleon scattering cross section. We show that if the CR energy spectrum follows a power law of type , the derived constraints on the scattering cross section will be highly insensitive to DM particle mass. This suggests that ultrahigh-energy CRs (UHECRs) indirectly measured by ground-based detectors can be used to place constraints on ultralight DM particles, as is a very good approximation of the UHECR energy spectrum up to energy . Using the recent UHECR flux data, we show that the current constraints derived from space-based CR measurements can in principle be extended to ultralight DM particles far below eV scale .
I Introduction
Although compelling astrophysical evidence supports the existence of dark matter (DM) in the Universe, whether or not DM participates non-gravitational interactions is still an open question. The majority of the current DM direct detection (DD) experiments search for nuclear recoil signals from the scatterings between the halo DM particle and target nucleus. As the typical detection threshold of the current experiments is of keV), searching for light halo DM below GeV is in general challenging. The reason is that for lighter halo DM particles the kinetic energy is lower, and the energy transferred to the target nuclei is suppressed. For instance, for a DM particle with mass GeV and a typical DM escape velocity , the elastic scattering off a target nucleus with mass GeV leads to a maximal recoil energy keV which is significantly lower than the typical detection threshold. Several physical processes have been considered to lower the detection threshold such as using additional photon emission in the inelastic scattering process (Kouvaris:2016afs, ) and the Migdal effect (Ibe:2017yqa, ; Dolan:2017xbu, ), etc.. The same DM-nucleus scattering process may leave imprints in some cosmological and astrophysical observables, which can be used to place constraints on the scattering cross section. The resulting constraints are in general much weaker but can be applied to lower DM particle masses unreachable to the DD experiments. For instance, from the spectral distortion of the cosmic microwave background (CMB), a constraint of for at 1 keV-TeV can be obtained (Gluscevic:2017ywp, ); the constraints from the population of Milky Way (MW) satellite galaxies can reach for (Nadler:2019zrb, ); and the measurement of the gas cooling rate of the Leo T dwarf galaxy can also lead to a constraint of for 1 MeV (Wadekar:2019xnf, ; Bhoonah:2018wmw, ).
Recently, it was shown that important constraints can be derived from the scattering between cosmic ray (CR) particles and DM particles in the local Universe. High-energy CR particles in the Galaxy can scatter off halo DM particles, which results in the energy-loss of CRs (Cappiello:2018hsu, ), the production of -rays (Cyburt:2002uw, ; Hooper:2018bfw, ) and energy-boost of DM particles (Bringmann:2018cvk, ; Ema:2018bih, ; Cappiello:2019qsw, ), etc.. In the last process, a small but irreducible component of DM (referred to as CRDM) can obtain very high kinetic energies. These energetic CRDM particles can scatter again with the target nuclei in underground detectors, and deposit sufficient energy to cross the detection threshold, which greatly extend the sensitivity of the current DD experiments to sub-GeV DM particles (Bringmann:2018cvk, ; Ema:2018bih, ; Dent:2019krz, ; Bondarenko:2019vrb, ; Cappiello:2019qsw, ; Ge:2020yuf, ; Zhang:2020htl, ; Wang:2019jtk, ). It has been shown that in this approach the constraints on constant DM-nucleon (DM-electron) spin-independent scattering cross section can reach for DM particle mass down to at least MeV ( eV) (Bringmann:2018cvk, ; Ema:2018bih, ) (for constraints on energy-dependent cross sections, see e.g. (Dent:2019krz, ; Bondarenko:2019vrb, )).
It is of interest to explore the potential of this approach in constraining even lighter DM particles far below MeV scale, as some well-motivated DM candidates such as QCD axions and axion-like particles can be extremely light. Constraining lighter DM requires better information on the CR spectra at higher energies. Note, however, that all the current analysis (Bringmann:2018cvk, ; Ema:2018bih, ; Dent:2019krz, ; Bondarenko:2019vrb, ; Cappiello:2019qsw, ; Ge:2020yuf, ; Zhang:2020htl, ; Wang:2019jtk, ) on the detection of CRDM adopted the CR fluxes from either the parametrizations in (DellaTorre:2016jjf, ; Bisschoff:2019lne, ) or the GALPROP code (Strong:1998pw, ; Moskalenko:1997gh, ), which are inferred from the space-based direct CR measurements (e.g. PAMELA (Adriani:2011cu, ; Adriani:2013as, ), AMS-02 (Aguilar:2015ooa, ; Aguilar:2015ctt, ) and CREAM-I (Yoon:2011aa, ) etc.). For current space-based experiments the CR fluxes which can be measured with reasonable precision are typically with energy TeV (see also the data of CREAM-III (Yoon:2017qjx, ), CALET (Adriani:2019aft, ) and DAMPE (An:2019wcw, )). Towards higher energies, the statistic uncertainties increase rapidly due to the limited acceptance of space-based experiments (Nilsen:1997mv, ; Derbina:2005ta, ; Atkin:2018wsp, ). Naively extrapolating these analyses to higher energies will leads to incorrect conclusions, as the spectral feature of the CR flux start to change above 1 PeV. Alternatively, high-energy CR can be measured indirectly by ground-based air-shower detectors. Despite larger uncertainties in energy scale and mass resolution, this approach can measure the CR flux to much higher energy due to the huge acceptances. For detecting lighter DM particles, the local DM number density is higher. However, the energy transfer from the scattering process become less efficient, and the CR flux is known to decrease rapidly towards higher energies. Whether or not ultrahigh-energy CRs (UHECRs, defined as CR with total energy PeV) can be used to place useful constraints on ultralight DM will depend strongly on the spectral feature of the UHECR flux.
In this work, we show that as long as the energy spectrum of CR flux follows a power law with , the derived constraints on the DM-nucleon scattering cross section will not decrease towards lower DM mass. In the limit of , the constraints will DM mass independent. This justifies using UHECR to place stringent constraints on ultralight DM particles, as the UHECR all-particle spectrum above the “knee” structure (at PeV) can be well-approximated by a power law with . From the recent UHECR nucleus flux data, we obtain the following results: the constraints on the spin-independent DM-nucleon scattering cross section can be for DM particle mass down to extremely small value , which expands the currently known constraints derived from space-based direct CR measurements by around ten orders of magnitude in DM mass, and close a large previously unconstrained parameter space; the most stringent constraints are found to be at DM mass eV and eV, due to the “knee” and “toe” structure in the UHECR flux, respectively; this CRDM approach will completely loss sensitivity for DM mass below eV as the UHECR flux is highly suppressed above eV, a phenomena possibly related to the scatterings between UHECRs and cosmic microwave background (CMB) photons (Greisen:1966jv, ; Zatsepin:1966xyz, ). The constraints obtained in this work are highly model-independent and conservative, as only the elastic scattering process is required and very conservative choices of parameters are adpoted. The constraints obtained in this work are derived based on the observables of the present-day local Universe, which are complementary to other constraints derived from the data of earlier epochs of the Universe.
This paper is organized as follows: In section II, we discuss the spectral feature of the DM flux upscattered by UHECRs. In section III, we discuss the effect of earth attenuation of the CRDM kinetic energy. The nuclear recoil sepectrum and the constraints from direct detection experiment Xenon-1T is discussed in section IV. We summarize the work and give some remarks in section V.
II CR-upscattered dark matter flux
II.1 Single CR component case
In the generic process of elastic scattering between an incident particle with kinetic energy and a target particle at rest, the recoil energy of particle in the laboratory frame is given by , where is the scattering angle of particle in the center-of-mass (CM) frame. The maximal recoil energy of particle is given by
| (1) |
where is the mass of particle . We assume that the scattering is isotropic in the CM frame, such that the differential cross section in the laboratory frame is simply related to the total cross section as . In the case of CR-DM scattering, if the CR particle is highly relativistic, i.e., the Lorentz factor , but is small enough such that , the maximal recoil energy of the CRDM can be approximated as . The CRDM particle with kinetic energy can scatter again with the nucleus (with mass ) in either the outer crust of Earth or the detector of the underground DM direct detection experiments. The maximal recoil energy of the nucleus which is also the maximal energy-loss of CRDM particle can be well approximated as . Note that is independent of DM particle mass.
After being upscattered, the CRDM particles travel through the Galaxy in straight lines as they are not deflected by the interstellar magnetic fields. The observed flux (number of particles per unit area, time and solid angle, ) of CRDM at the surface of Earth can be approximately written as
| (2) |
where is the local interstellar CR flux measured at Earth. The integration lower limit is the minimal Lorentz factor required to produce . The form factor is evaluated at the momentum transfer . For very light DM, is an excellent approximation. In the above expression we have assumed that the CR energy spectrum in the Galactic halo is not significantly different from that in the local interstellar (LIS) region, i.e., . In this case, the information of halo DM density distribution can be parameterized into a single parameter
| (3) |
where is the local DM density in the Solar system, and the integration is performed along the line-of-sight (l.o.s). For typical DM profiles, the value of is around a few kpc. In this work, we make a conservative choice of as a benchmark value.
Let us start with a simple case where the flux of a CR species can be parametrized by a single power law with index and a cutoff at a Lorentz factor as follows
| (4) |
where is a normalization factor. The power-law behavior is expected if CRs are accelerated by the diffusive shock waves of the Galactic supernova-remnants (SNRs) and the pulsar wind, etc., and the cutoff represents the maximal energy that can be achieved by the acceleration process. If is sufficiently small such that , which is easily justified for sub-eV CRDM, the approximation of can be used in the whole integration range of Eq. (2), and the corresponding CRDM flux can be obtained analytically as follows
| (5) |
where is the incomplete -function, with the maximal energy of CRDM upscattered by UHECR at the cutoff .
In the region far below the cutoff, i.e., which corresponds to the case where the CR flux is essentially a single power law . Using the asymptotic behavior of the incomplete -function for , the CRDM flux can be approximated as
| (6) |
As is a very good approximation for ultralight DM, the above expression shows that the CRDM flux follows a power law . The mass dependence of the CRDM flux is proportional to which shows that as long as the CR flux is hard enough, namely, , the resulting CRDM flux will not decrease with decreasing DM mass.
Note that in a wide energy range the CR flux is close to the case of . Direct and indirect measurements show that from a few GeV up to the “knee” (at PeV), the primary CR all-particle spectrum approximately follows a single power law with index . Above the “knee” the spectrum softens to . Before reaching the highest observed energy eV, there are several minor spectral structures such as the “second knee” at eV, the “ankle” at eV and the “toe” at eV. The corresponding power-law indices vary around the case. Consequently, the DM upscattered by UHECR in this ultrahigh-energy region should fluctuate around the power law , and is highly insensitive to DM mass; and the recoil event rate and the derived bounds on should be independent of as well, as the recoil energy or the energy loss in the scattering is almost independent of DM mass. Eq. (6) also suggests that the CR electrons are less efficient in constraining ultralight DM particles, as the CR electron flux follows a power law with power index after TeV (Aharonian:2009ah, ; Adriani:2017efm, ; Ambrosi:2017wek, ).
In a different region where is close to the cutoff , the effect of cutoff in CR flux will be significant. Using the asymptotic behavior of for large , the CRDM flux is given by
| (7) |
Since is proportional to , lighter CRDM particles will have an earlier cutoff. A final cutoff in the CR flux around is expected from the inelastic scattering between UHECR particles and CMB photons as predicted by Greisen, Zatsepin and Kuzmin (Greisen:1966jv, ; Zatsepin:1966xyz, ), which is supported by recent observations (Abbasi:2007sv, ; Castellina:2019huz, ; Deligny:2020gzq, ). The cutoff in the UHECR flux essentially sets the scale of the minimal that can be constrained by this approach.
II.2 Multiple CR component case
The primary CR flux in the ultrahigh-energy region may receive contributions from different sources such as SNRs, pulsar winds and active galactic nuclei (AGN), etc. (for recent reviews see e.g. (Kachelriess:2019oqu, ; Watson:2013cla, ; Nagano:2000ve, )). The multi-source description is also essential to reproduce the observed various spectral structures of UHECRs. Thus a realistic description of the UHECR flux necessarily contains multiple components, which can be written as with . For each component , the flux takes the form of Eq. (4) with the power index and cutoff replaced by and , respectively. Thus we adopt the following form of the primary CR flux (Gaisser:2013bla, )
| (8) |
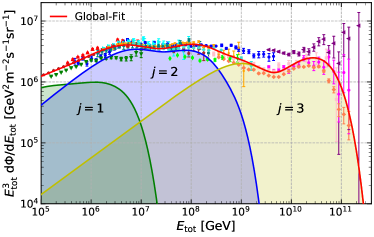
where and are the normalization factors and power indices, respectively, for a CR species in the component . Following the reasoning of Peters (Peters:1966xyz, ), the CR species in each component should share a common cutoff in rigidity , which leads to , where is the electric-charge of the CR species . In Ref. (Gaisser:2013bla, ) four different parametrization are found to be in good agreement with the current UHECR data Nagano:1991jz ; Glasmacher:1999id ; Arqueros:1999uq ; Takeda:2002at ; Antoni:2005wq ; Abbasi:2007sv ; Amenomori:2008aa ; Aartsen:2013wda ; Ter-Antonyan:2014hea ; Prosin:2016rqu ; Fenu:2017hlc ; Arteaga-Velazquez:2017rmh . We choose one of the “Global-Fit” parametrization with . The best-fit values of the rigidity cutoffs are TV, 4 PV and 1.3 EV, respectively (Gaisser:2013bla, ). Compared with other parametrizations, this one is the most economic and conservative as the final cutoff of is the lowest, which leads to the lowest CRDM flux at high energy region. The details of the parametrizations are summarized in Appendix-A.
II.3 DM flux from ultrahigh-energy CRs
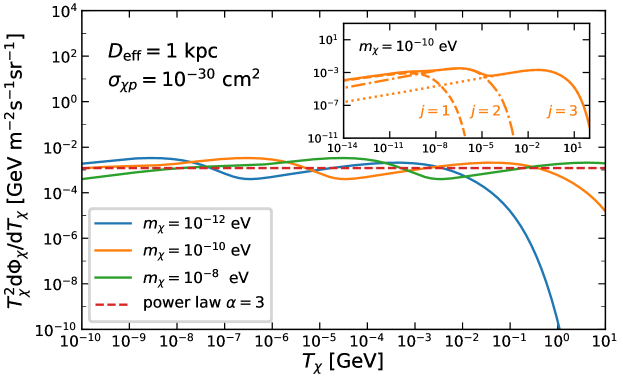
Fig. 1 shows the CRDM flux calculated numerically from Eqs. (1) and (2) without using approximations. In the calculation we take the dipole form factors for light CR species H and He (Perdrisat:2006hj, ), and the Helm form factor for heavier species (Helm:1956zz, ; Lewin:1995rx, ). In the energy region where is far below the lowest cut off, since the CRDM fluxes follow an approximate power law and scale with DM mass as which is a rather weak -dependence. Thus lighter CRDM particle have slightly larger flux. In the cutoff dominated region, due to the superposition of various cutoffs in the three components, the CRDM fluxes fluctuate around the power law case of over many orders of magnitude in kinetic energy before reaching the last cutoff, and are insensitive to , which is expected from Eq. (6) and can be clearly seen in Fig. 1. Above the final cutoff , the CRDM flux drops rapidly; the flux of lighter CRDM particle drops faster, as expected from Eq. (7). Taking the case of as an example, the CR protons in the three components lead to the induced CRDM flux with three cut off at , and , respectively, as can be seen from the inset of Fig. 1. If the cutoff is too low, the CRDM cannot be energetic enough to produce enough recoil energy to be detected by the DD experiments. Thus a lower limit on for a given DD experiment exists.
III Earth attenuation
Before arriving at the underground detectors, CRDM may loss a non-negligible fraction of energy due to the same elastic scatterings with nucleus within the outer crust of Earth. We adopt an analytic approach for Earth attenuation based on average energy loss (Kouvaris:2014lpa, ; Starkman:1990nj, ). For simplicity, we only consider elastic scatterings which is an irreducible process and neglect the effect of form factor. The decrease of with depth due to the elastic scattering with the nucleus in Earth’s crust is given by
| (9) |
where is the mass density of nucleus in the crust, and stands for the nucleus recoil energy which equals the energy loss of the incident CRDM particle. Using the expression of the energy loss can be approximated as
| (10) |
where . We consider the case where the scattering is isospin conserving, namely, such that the cross sections at nucleus and nucleon level are simply related by with the nucleus mass number of . We further adopt the relation which is a very good approximation. Under these two simplifications, the factor cancels out in the expression of , which gives with the average mass density of Earth’s outer crust (Rudnick:2003xyz, ). After integrating Eq. (9), the CRDM kinetic energy at depth is related to that at surface as
| (11) |
Thus the effect of energy loss is independent of both and the chemical composition of the crust. For a small enough cross section , one obtains . In the opposite case where is large enough, will stop tracking , and reach a maximal value with increasing . The appearance of is due to the rapid energy loss proportional to for relativistic incident particles, which leads to a sharp cutoff in the CRDM flux at depth . The CRDM flux at depth can be evaluated from that at surface through the relation .
IV Direct detection
IV.1 Recoil event spectrum
The differential nuclear recoil event rate per target nucleus mass of the scattering at depth is given by
| (12) |
where . The scale of relevant to direct detection is set by the lower limit of the integration For a detector located at depth and a target nucleus mass , in order to produce a recoil energy which is close to the threshold , the required minimal is Thus the condition of leads to a typical requirement of . Since the lower bounds of the excluded cross section is expected to be much smaller (Bringmann:2018cvk, ), in deriving the lower bound of the excluded , the effect of Earth attenuation can be safely neglected. Using the CRDM flux from Eq. (5), the recoil event rate can be written as
where . In the case where the CR flux follows a power law with index , the recoil event rate can be obtained analytically from Eqs. (6) and (12) as follows
| (13) |
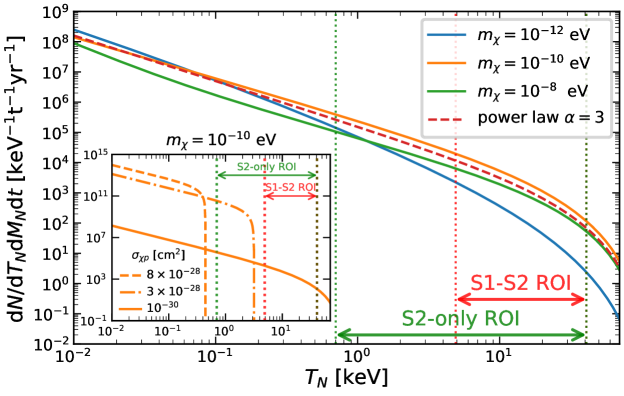
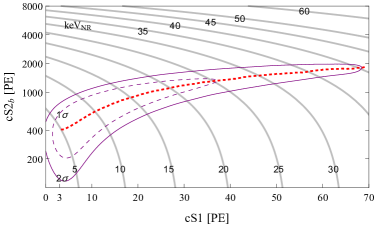
which explicitly shows that if , the recoil event rate is proportional to and does not decrease with a decreasing . For the case , the derived upper limit on will be insensitive to . In Fig. 2, we show the full numerical results of recoil event rate of the scattering between the CRDM particles and xenon nuclei. The approximate power-law behavior of the recoil spectrum can be clearly seen for . Above , the suppression due to the Helm form factor is visible. Due to the power-law like spectrum of the recoil event rate, the experiment with lower threshold will be more sensitive to lighter DM particles.
For large enough cross sections, the appearance of leads to a cutoff in the recoil event spectrum. If the corresponding recoil energy is below the threshold , it will form a blind spot for direct detection. This possibility is illustrated in the inset of Fig. 2, which will lead to -independent upper bounds on the excluded value of
IV.2 Xenon-1T detector response and data analysis
We numerically calculate excluded regions in the plane at for CRDM from the data of Xenon-1T experiment located at depth (Aprile:2018dbl, ; Aprile:2019xxb, ). The Xenon-1T experiment utilizes the liquid xenon time projection chambers to detect the recoil energy of the target nuclei from their scattering with DM particles. The deposited energy can produce a prompt scintillation signal (S1) and ionization electrons which are extracted into gaseous xenon and produce proportional scintillation light (S2). The S2/S1 signal size ratio allows for discrimination between nuclear recoils and electron recoils. Since the nuclear recoil event rate from the collisions with CRDM is quite different from that with the nonrelativistic halo DM, to be more accurate on the effect of threshold, we derive the limits directly from the distribution of the signals of S1 and S2, rather than naively rescaling the reported experimental limits from halo WIMP searches (Bringmann:2018cvk, ; Dent:2019krz, ; Bondarenko:2019vrb, ; Cappiello:2019qsw, ).
For the calculations from the deposited recoil energy to the position-corrected signals cS1 and , we closely follow Ref. (Aprile:2019dme, ). For a deposited recoil energy , the averaged number of photons and charges are given by
| (14) |
where is the average energy required to create either an excitation or ion-electron pair in the liquid xenon, is the Lindhard factor, is the excitation-to-ion ratio and is the recombination probability. The prompt and scintillation light hitting the PMT photocathode will produce photoelectrons (PEs). The average number of PEs observed per emitted photon is described by the gain factor , and the amplification factor for charge signal is described by the parameter . The S1 and S2 signal are constructed from and . The bias and fluctuations are modeled by Gaussian distribution with Gauss() and Gauss() respectively. Finally, the spatial dependences of S1 and S2 will be corrected which leads to the signal cS1 and . The Xenon-1T collaboration has performed the S1+S2 analysis based with an effective exposure of 1 ton-yr. In the analysis the DM search was performed between , corresponding to an average of with an effective exposure of one ton-year(Aprile:2018dbl, ) . The Xenon-1T collaboration also formed the S2-only analysis with , corresponding to a threshold of with an effective exposure of 22 ton-days (Aprile:2019xxb, ).
We calculate the signal distributions of the scattering between CRDM particles and target Xenon nuclei, and derive the excluded regions in plane for the Xenon-1T data (S1+S2) using the binned Poisson statistic approach (Green:2001xy, ; Savage:2008er, ). The distribution of the background events are taken from the Xenon-1T analysis. The calculation procedure, main parameters and extended results with different parametrizations of CR flux are summarized in appendix-B.
IV.3 Results
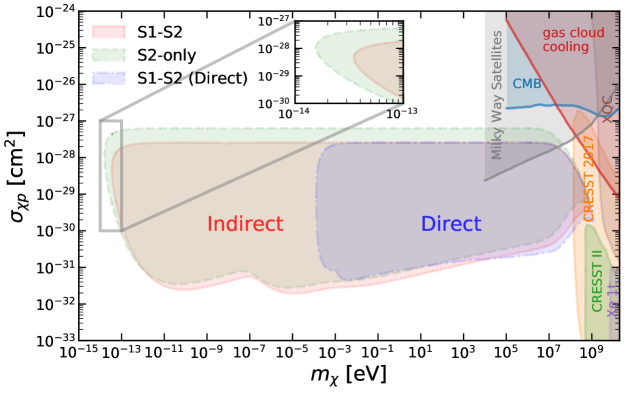
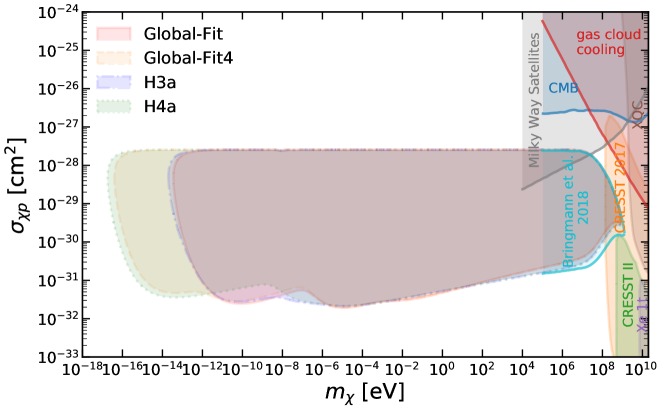
In Fig. 3, we show the final constraints from analysing the Xenon-1T data. It can be seen from the figure that the lower bound of the excluded region reaches can be extended down to DM particle mass . In the sub-eV region, the shape of the excluded region is directly related to the structures in the UHECR flux. The most stringent limits of at and correspond to the “knee” and the “toe” structures of the UHECR flux. The exclusion region closes at , which corresponds to the observed suppression of the UHECR flux at possibly due to the GZK cutoff. For comparison purpose, in Fig. 3 we also show the results using the CR proton and Helium fluxes in (DellaTorre:2016jjf, ) which are based on the space-based direct CR measurements and are only available for energy below 200 TeV (Aguilar:2015ooa, ; Aguilar:2017hno, ; Yoon:2011aa, ). It can be seen that using the ground-based indirect UHECR measurements can extend the previous constraints by about ten orders of magnitude towards lower DM particle mass. The constraints are conservative, as we adopted the “Global-Fit” parametrization of the UHECR flux. For other parametrizations such as “H3a”, “H4a” and “Global-Fit4”, the resulting constraints are even stronger towards lower DM mass, as it is shown in Fig. 6 of Appendex-C.
As it can be seen in the inset of Fig. 3, we also find that the constraints on the lowest CRDM mass is very sensitive to the detector threshold as the recoil event spectrum from CRDM is quite different from halo DM. Due to the lower threshold of the S2-only data (Aprile:2019xxb, ), the constraints from the S2-only data which has an exposure about an order of magnitude smaller than that of the S1-S2 data (with a threshold of (Aprile:2018dbl, )) turns out to be more sensitive to lighter CRDM below .
In the simple analytic approach adopted in this work, the upper bound of the excluded region due to the Earth attenuation is found to be , and is almost insensitive to , as expected from the fast energy loss proportional to in Earth attenuation discussed in Sec. III.
V Discussions/Conclusions
In summary, we have derived novel constraints on ultralight DM boosted by UHECRs. The constraints obtained in this work are highly model independent, as only the DM-nucleon scattering cross setion is relevant. The approach only requires the information of the present-day local Universe, even the standard cosmology is not assumed. Thus the constraints are complementary to that derived from different epochs of the Universe, such as the observations of CMB (Slatyer:2018aqg, ; Gluscevic:2017ywp, ; Boddy:2018kfv, ; Xu:2018efh, ), Lyman- forest (Murgia:2018now, ) and 21 cm radiations (Slatyer:2018aqg, ), etc.. If the ultralight DM particles reached chemical and kinetic equilibrium in the early Universe, very stringent constraints will arise from BBN and CMB. However, the conditions for reaching thermal equilibrium require more information on the cross section of DM annihilation and production process, which are in general model dependent. For ultralight DM particles, annihilating into most standard model particles are kinematically forbidden (for the analysis try to connect DM scattering and annihilation cross sections using crossing symmetry, see, e.g. (Krnjaic:2019dzc, )).
In this work, we considered the simplest case where the scattering cross section is a constant, i.e., energy and momentum-transfer independent. For relativistic scatterings, it more likely that the differential scattering cross section depends on the energy of both the incident and outgoing particles. For some simple models, such as the fermionic DM with a scalar mediator, it has been shown that the differential scattering cross section can be greatly enhanced at high momentum transfer. Consequently, the constraints on the total cross section at the zero momentum transfer can be many orders of magnitude stronger for lighter DM particles (Bondarenko:2019vrb, ). The approach proposed in this work can be extended to the case with energy-dependent cross sections in a straight forward manner.
Acknowledgements.
We are grateful to Qian Yue and Li-Tao Yang for helpful discussions. This work is supports in part by The National Key R&D Program of China No. 2017YFA0402204, the National Natural Science Foundation of China (NSFC) No. 11825506, No. 11821505, No. 11851303, No. 11947302, and the Key Research Program of the Chinese Academy of Sciences, No. XDPB15.Appendix A Parametrizaitons of UHECR flux
CR particles with energy above a few hundred TeV are mainly measured by the ground-based air-shower arrays which detect the cascades of secondary particles from the interactions of primary CR particles in the Earth atmosphere. In such indirect experiments, the information about the chemical composition is limited to determining the relative abundance of the main species or groups. Thus, it is likely that there exists different parametrizations which can describe the data equally well. We take the -component power-law parametrization in which the CR total energy spectrum of the CR species has the following form (Gaisser:2013bla, )
| (15) |
where ) is the component index, (in unit of GeV) is the total energy of CR species . The normalization constants are related to in Eq. (5) of the main text by where (in unit of GeV) is the mass of CR species . A global analysis to the recent UHECR data has been performed in (Gaisser:2013bla, ). We adopt one of the three-component “Global-Fit” model as the benchmark model with the parameters listed in Table 1. In this parametrization, the first rigidity cutoff is around 100 TV which is the typical maximal energy from the acceleration of SNR with magnetic field around a few Gauss. It also well reproduce the observed hardening in the CR all-particle spectrum above 200 GeV (Ahn:2010gv, ; Adriani:2011cu, ). In the figure, we also list a slightly extended four-component parametrization (referred to as “Global-Fit4”).
| p | He | C | O | Fe | 50<Z<56 | 78<Z<82 | ||
|---|---|---|---|---|---|---|---|---|
| TV | 7000 | 3200 | 100 | 130 | 60 | |||
| 2.66 | 2.58 | 2.4 | 2.4 | 2.3 | ||||
| PV | 150 | 65 | 6 | 7 | 2.3 (2.1) | 0.1 | 0.4 (0.53) | |
| 2.4 | 2.3 | 2.3 | 2.3 | 2.2 | 2.2 | 2.2 | ||
| EV | 14 (12) | 0.025 (0.011) | ||||||
| 2.4 | 2.2 | |||||||
| (1.2) | ||||||||
| (2.4) |
Two alternative parametrizations (Gaisser:2012zz, ) based on the Hillas model (Hillas:2005cs, ) are also found in good agreement with data, which are labled as “H3a” and “H4a” in (Gaisser:2013bla, ). The major difference from the “Global-Fit” parametrization is that the first rigidity cutoff is quite high about 4 PV, which is responsible for the “knee” structure. In this type of parametrization the “ankle” represent the transition between the galactic and extra-galactic contributions. The corresponding parameters are listed in Table 2.
| p | He | CNO | Mg-Si | Fe | ||||
|---|---|---|---|---|---|---|---|---|
| PV | 7860 | 3550 | 2200 | 1430 | 2120 | |||
| 2.66 | 2.58 | 2.63 | 2.67 | 2.63 | ||||
| PV | 20 | 20 | 13.4 | 13.4 | 13.4 | |||
| 2.4 | 2.4 | 2.4 | 2.4 | 2.4 | ||||
| EV | 1.7 (200) | 1.7 (0.0) | 1.14 (0.0) | 1.14 (0.0) | 1.14 (0.0) | |||
| 2.4 (2.6) | 2.4 | 2.4 | 2.4 | 2.4 |
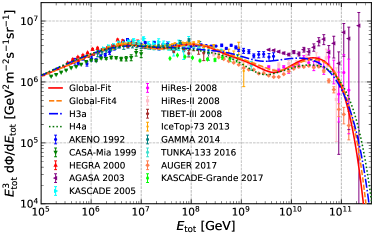
The CR all-particle fluxes of the four parametrizations are shown in Figure 4 together with the recent experiments data.
Appendix B Xenon-1T data analysis
For the data analysis of the Xenon-1T experiment, we adopt the signal response model described by the Xenon-1T collaboration in (Aprile:2019dme, ). The Xenon-1T experiment utilizes the liquid xenon time projection chambers to detect the recoil energy of the target nuclei from the scattering with DM particles. The deposited energy can produce a prompt scintillation light signal (S1), and the ionization electrons extracted from liquid xenon into gaseous xenon can produce proportional scintillation light (S2). The S2/S1 signal size ratio allows for discrimination between nuclear recoil (NR) and electron recoil (ER) events. For a deposited recoil energy , the produced total number of quantum is the sum of the number of excitons and ion-electron pairs , which follows a binomial distribution where is the average energy required to create either an exciton or ion-electron pair in the liquid xenon, and is the Lindhard factor. In the case of NR, it is given by (Lenardo:2014cva, )
| (16) |
where is a normalization factor, the function is proportional to the ratio of electric and nuclear stopping power, which can be parametrized as , where with the atomic number of the xenon nucleus. The distribution of is described by a binomial distribution , where is the averaged exciton-to-ion ratio. The number of excitons is given by . The excitons contribute to scintillation photon signals through de-excitation process. The ionized electrons have a probability of to be recombined into xenon atoms and produce scintillation photons, and a probability of to escape the ion-electron pair. Thus the number of escaped electrons is given by and the total number of photons is . The recombination probability is modeled by a Gaussian distribution , where is the mean value and is the variance. The mean value is calculated using the Thomas-Imel box model (Thomas:1987zz, ; Szydagis:2011tk, )
| (17) |
where with the electric field. The variance is described by with and . In summary, the averaged number of photons and charges are given by
| (18) |
The photon and charge signals are converted into photoelectron (PE) emission of the photomultiplier tube (PMT) photocathode. The corresponding gain factors are: the average number of PEs observed per emitted photon, and the amplification factor for charge signals. Both are spatial dependent.
The spatial-dependence of the signals S1 and S2 are corrected, which results in the corrected signals and (corresponding to the S2 signals from the bottom PMTs). These two quantities can be understood as spatial-averaged signals. For simplicity we use the spatial-averaged gain factors of and for and , respectively. Thus in this case the number of PE is given by and that of proportional signal is given by , with . The and signals are constructed from and . The biases and fluctuations in the construction process is modeled as
| (19) | ||||
| (20) |
where we adopt mean values of and variances .
| (21) | ||||
In the left panel of Fig. 5, we show the Monte Carlo (MC) simulation of the signal distributions from a typical scattering between non-relativistic halo DM and xenon nucleus for and . We adopt the Maxwellian distribution of the standard halo model (SHM) for DM with the most probable velocity , the escape velocity , the local DM density and the Earth velocity (Drukier:1986tm, ). We assume the scattering process is elastic, spin-independent and isospin-conserving, and adopt the Helm form factor (Lewin:1995rx, ). We find that the figure is in reasonable agreement with the result of the Xenon-1T collaboration (Aprile:2018dbl, ).
For deriving the constraints on from halo DM, we consider two different two statistic methods. The first one is the Binned Poisson (BP) method (Green:2001xy, ; Savage:2008er, ). First, Let us consider the single-bin case. Given an expectation value of events with the theoretical prediction and the expected background, the probability of observing events is given by the Poisson distribution
| (22) |
The value of at which is smaller than is excluded at confidence level (C.L.). For example, the 90 C.L. exclusion limit means . The required can be obtained from . In the case of multiple bins, if is the probability of seeing in that bin, the possibility of seeing in any of the bins is given by the binomial distribution
| (23) |
where is the number of bins. For a desired exclusion level of , we then use this relation to determine , and find the value of .
The second one is the Maximal Likelihood (ML) method. In this method, the joint likelihood is obtained by the product of individual likelihoods in each bin , i.e., where is the Poisson distribution. The theoretical prediction of the event number depends on DM parameters, e.g. The test statistics is defined as
| (24) |
where and are the best-fit DM parameters which maximize the likelihood. For a given value of , the TS should approximately follow a -distribution with one degree-of-freedom (Rolke:2004mj, ). The value of for which are excluded at 90 C.L..
For the S1-S2 combined data analysis, the Xenon-1T collaboration adopted the energy regions of interest (ROI) for cS1 as PE, corresponding to an average energy of 4.9–40.9 . The ROI for is PE. The selection of ROIs affects the total acceptence. We take the total acceptance due to the data selection, reconstruction, noise rejection, S1-S2 correlation and single scattering, etc.. from Fig. 14 of (Aprile:2019bbb, ). In deriving the constraints on CRDM, we use the data of distribution shown in Fig. 4 of (Aprile:2018dbl, ). In the figure the distribution is shown with respect to the rescaled quantity where and are the ER mean and quantile, respectively. We take and from the distribution shown in Fig. 3 of (Aprile:2018dbl, ). The number of signal counts in a given bin of signal is given by
| (25) |
where is the total exposure of the XENON-1T data, is the lower (upper) endpoints of the -th bin of the corresponding signal. is the total efficiency of , where are the acceptance within the ROI of and , respectively, and are vanishing outside the ROIs. The value of and are related to each other through Eq. 21, so the total efficiency of S2 can be written as a function of only. For the background event number , we directly adopt the overall expected background given by XENON-1T, which include electric recoils, neutron, surface, accidental coincidence (AC), and coherent elastic neutrino-nucleus scatters ().
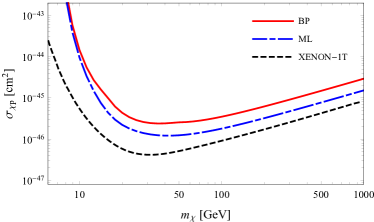
In the right panel of Fig. 5 we show the upper limits on at 90% C.L. for SHM DM using the BP and ML statistic methods. The DM local density and velocity distribution are the same as that for Fig. 5. In the figure, the limits obtained by the Xenon-1T collaboration using a full profile likelihood analysis is also shown for comparison. It can be seen that the limits obtained in BP and ML approaches are quite conservative. As we are interested in conservative constraints on CRDM properties, we adopt the BP statistic approach in the main text.
Using the relation between the S2 signal and the averaged recoil energy for NR and ER process shown in Fig. 6 of the supplementary material of (Aprile:2019xxb, ), we convert the Xenon-1T S2-only data in Fig. 4 Ref. (Aprile:2019xxb, ) into the NR recoil energy distribution . The total number of events in the -th energy bin is given by For , we have
| (26) |
where is the lower (upper) endpoints of the -th energy bin, and is the effective exposure which is a function of recoil energy shown in Fig. 1 of Ref. (Aprile:2019xxb, ). For the background event number, we use the expected background given by XENON-1T, which include cathode, CEvNS, flat ER background for S2-only data.
Appendix C Excluded regions for CRDM
Making use of the Xenon-1T S1-S2 data, we derive the excluded regions in plane using the BP statistic approach for the four different parametrizations of the primary CR flux. The results are shown in Figure 6. It can be seen that the constraints based on the “Global-Fit” parametrization is quite conservative compared with other parametrizations.
References
- (1) C. Kouvaris and J. Pradler, “Probing sub-GeV Dark Matter with conventional detectors,” Phys. Rev. Lett. 118 no. 3, (2017) 031803, arXiv:1607.01789 [hep-ph].
- (2) M. Ibe, W. Nakano, Y. Shoji, and K. Suzuki, “Migdal Effect in Dark Matter Direct Detection Experiments,” JHEP 03 (2018) 194, arXiv:1707.07258 [hep-ph].
- (3) M. J. Dolan, F. Kahlhoefer, and C. McCabe, “Directly detecting sub-GeV dark matter with electrons from nuclear scattering,” Phys. Rev. Lett. 121 no. 10, (2018) 101801, arXiv:1711.09906 [hep-ph].
- (4) V. Gluscevic and K. K. Boddy, “Constraints on Scattering of keV–TeV Dark Matter with Protons in the Early Universe,” Phys. Rev. Lett. 121 no. 8, (2018) 081301, arXiv:1712.07133 [astro-ph.CO].
- (5) E. O. Nadler, V. Gluscevic, K. K. Boddy, and R. H. Wechsler, “Constraints on Dark Matter Microphysics from the Milky Way Satellite Population,” Astrophys. J. Lett. 878 no. 2, (2019) 32, arXiv:1904.10000 [astro-ph.CO]. [Erratum: Astrophys.J.Lett. 897, L46 (2020), Erratum: Astrophys.J. 897, L46 (2020)].
- (6) D. Wadekar and G. R. Farrar, “First astrophysical constraints on dark matter interactions with ordinary matter at low relative velocity,” arXiv:1903.12190 [hep-ph].
- (7) A. Bhoonah, J. Bramante, F. Elahi, and S. Schon, “Calorimetric Dark Matter Detection With Galactic Center Gas Clouds,” Phys. Rev. Lett. 121 no. 13, (2018) 131101, arXiv:1806.06857 [hep-ph].
- (8) C. V. Cappiello, K. C. Ng, and J. F. Beacom, “Reverse Direct Detection: Cosmic Ray Scattering With Light Dark Matter,” Phys. Rev. D 99 no. 6, (2019) 063004, arXiv:1810.07705 [hep-ph].
- (9) R. H. Cyburt, B. D. Fields, V. Pavlidou, and B. D. Wandelt, “Constraining strong baryon dark matter interactions with primordial nucleosynthesis and cosmic rays,” Phys. Rev. D 65 (2002) 123503, arXiv:astro-ph/0203240.
- (10) D. Hooper and S. D. McDermott, “Robust Constraints and Novel Gamma-Ray Signatures of Dark Matter That Interacts Strongly With Nucleons,” Phys. Rev. D 97 no. 11, (2018) 115006, arXiv:1802.03025 [hep-ph].
- (11) T. Bringmann and M. Pospelov, “Novel direct detection constraints on light dark matter,” Phys. Rev. Lett. 122 no. 17, (2019) 171801, arXiv:1810.10543 [hep-ph].
- (12) Y. Ema, F. Sala, and R. Sato, “Light Dark Matter at Neutrino Experiments,” Phys. Rev. Lett. 122 no. 18, (2019) 181802, arXiv:1811.00520 [hep-ph].
- (13) C. Cappiello and J. F. Beacom, “Strong New Limits on Light Dark Matter from Neutrino Experiments,” Phys. Rev. D 100 no. 10, (2019) 103011, arXiv:1906.11283 [hep-ph].
- (14) J. B. Dent, B. Dutta, J. L. Newstead, and I. M. Shoemaker, “Bounds on Cosmic Ray-Boosted Dark Matter in Simplified Models and its Corresponding Neutrino-Floor,” Phys. Rev. D 101 no. 11, (2020) 116007, arXiv:1907.03782 [hep-ph].
- (15) K. Bondarenko, A. Boyarsky, T. Bringmann, M. Hufnagel, K. Schmidt-Hoberg, and A. Sokolenko, “Direct detection and complementary constraints for sub-GeV dark matter,” JHEP 03 (2020) 118, arXiv:1909.08632 [hep-ph].
- (16) S.-F. Ge, J.-L. Liu, Q. Yuan, and N. Zhou, “Boosted Diurnal Effect of Sub-GeV Dark Matter at Direct Detection Experiment,” arXiv:2005.09480 [hep-ph].
- (17) B.-L. Zhang, Z.-H. Lei, and J. Tang, “Constraints on cosmic-ray boosted DM in CDEX-10,” arXiv:2008.07116 [hep-ph].
- (18) W. Wang, L. Wu, J. M. Yang, H. Zhou, and B. Zhu, “Sub-GeV Gravity-mediated Dark Matter in Direct Detections,” arXiv:1912.09904 [hep-ph].
- (19) S. Della Torre et al., “From Observations near the Earth to the Local Interstellar Spectra,” in 25th European Cosmic Ray Symposium. 12, 2016. arXiv:1701.02363 [astro-ph.HE].
- (20) D. Bisschoff, M. Potgieter, and O. Aslam, “New very local interstellar spectra for electrons, positrons, protons and light cosmic ray nuclei,” Astrophys. J. 878 no. 1, (2019) 59, arXiv:1902.10438 [astro-ph.HE].
- (21) A. Strong and I. Moskalenko, “Propagation of cosmic-ray nucleons in the galaxy,” Astrophys. J. 509 (1998) 212–228, arXiv:astro-ph/9807150.
- (22) I. Moskalenko and A. Strong, “Production and propagation of cosmic ray positrons and electrons,” Astrophys. J. , arXiv:astro-ph/9710124.
- (23) PAMELA Collaboration, O. Adriani et al., “PAMELA Measurements of Cosmic-ray Proton and Helium Spectra,” Science 332 (2011) 69–72, arXiv:1103.4055 [astro-ph.HE].
- (24) O. Adriani et al., “Time dependence of the proton flux measured by PAMELA during the July 2006 - December 2009 solar minimum,” Astrophys. J. 765 (2013) 91, arXiv:1301.4108 [astro-ph.HE].
- (25) AMS Collaboration, M. Aguilar et al., “Precision Measurement of the Proton Flux in Primary Cosmic Rays from Rigidity 1Â GV to 1.8 TV with the Alpha Magnetic Spectrometer on the International Space Station,” Phys. Rev. Lett. 114 (2015) 171103.
- (26) AMS Collaboration, M. Aguilar et al., “Precision Measurement of the Helium Flux in Primary Cosmic Rays of Rigidities 1.9 GV to 3 TV with the Alpha Magnetic Spectrometer on the International Space Station,” Phys. Rev. Lett. 115 no. 21, (2015) 211101.
- (27) Y. Yoon et al., “Cosmic-Ray Proton and Helium Spectra from the First CREAM Flight,” Astrophys. J. 728 (2011) 122, arXiv:1102.2575 [astro-ph.HE].
- (28) Y. Yoon et al., “Proton and Helium Spectra from the CREAM-III Flight,” Astrophys. J. 839 no. 1, (2017) 5, arXiv:1704.02512 [astro-ph.HE].
- (29) CALET Collaboration, O. Adriani et al., “Direct Measurement of the Cosmic-Ray Proton Spectrum from 50 GeV to 10 TeV with the Calorimetric Electron Telescope on the International Space Station,” Phys. Rev. Lett. 122 no. 18, (2019) 181102, arXiv:1905.04229 [astro-ph.HE].
- (30) DAMPE Collaboration, Q. An et al., “Measurement of the cosmic-ray proton spectrum from 40 GeV to 100 TeV with the DAMPE satellite,” Sci. Adv. 5 no. 9, (2019) eaax3793, arXiv:1909.12860 [astro-ph.HE].
- (31) B. Nilsen et al., “Cosmic ray H and He spectra from 2-TeV/nucleon to 800-TeV/nucleon from the JACEE experiments,” AIP Conf. Proc. 412 no. 1, (1997) 1031–1034.
- (32) RUNJOB Collaboration, V. Derbina et al., “Cosmic-ray spectra and composition in the energy range of 10-TeV - 1000-TeV per particle obtained by the RUNJOB experiment,” Astrophys. J. Lett. 628 (2005) L41–L44.
- (33) E. Atkin et al., “New Universal Cosmic-Ray Knee near a Magnetic Rigidity of 10 TV with the NUCLEON Space Observatory,” JETP Lett. 108 no. 1, (2018) 5–12, arXiv:1805.07119 [astro-ph.HE].
- (34) K. Greisen, “End to the cosmic ray spectrum?,” Phys. Rev. Lett. 16 (1966) 748–750.
- (35) G. T. Zatsepin and V. A. Kuzmin, JETP Lett. 4, 78 (1966).
- (36) H.E.S.S. Collaboration, F. Aharonian et al., “Probing the ATIC peak in the cosmic-ray electron spectrum with H.E.S.S,” Astron. Astrophys. 508 (2009) 561, arXiv:0905.0105 [astro-ph.HE].
- (37) CALET Collaboration, O. Adriani et al., “Energy Spectrum of Cosmic-Ray Electron and Positron from 10 GeV to 3 TeV Observed with the Calorimetric Electron Telescope on the International Space Station,” Phys. Rev. Lett. 119 no. 18, (2017) 181101, arXiv:1712.01711 [astro-ph.HE].
- (38) DAMPE Collaboration, G. Ambrosi et al., “Direct detection of a break in the teraelectronvolt cosmic-ray spectrum of electrons and positrons,” Nature 552 (2017) 63–66, arXiv:1711.10981 [astro-ph.HE].
- (39) HiRes Collaboration, R. Abbasi et al., “First observation of the Greisen-Zatsepin-Kuzmin suppression,” Phys. Rev. Lett. 100 (2008) 101101, arXiv:astro-ph/0703099.
- (40) Pierre Auger Collaboration, A. Castellina, “Highlights from the Pierre Auger Observatory (ICRC2019),” PoS ICRC2019 (2020) 004, arXiv:1909.10791 [astro-ph.HE].
- (41) Pierre Auger, Telescope Array Collaboration, O. Deligny, “The energy spectrum of ultra-high energy cosmic rays measured at the Pierre Auger Observatory and at the Telescope Array,” PoS ICRC2019 (2020) 234, arXiv:2001.08811 [astro-ph.HE].
- (42) M. Kachelriess and D. Semikoz, “Cosmic Ray Models,” Prog. Part. Nucl. Phys. 109 (2019) 103710, arXiv:1904.08160 [astro-ph.HE].
- (43) A. A. Watson, “High-energy cosmic rays and the Greisen–Zatsepin–Kuz’min effect,” Rept. Prog. Phys. 77 (2014) 036901, arXiv:1310.0325 [astro-ph.HE].
- (44) M. Nagano and A. A. Watson, “Observations and implications of the ultrahigh-energy cosmic rays,” Rev. Mod. Phys. 72 (2000) 689–732.
- (45) T. K. Gaisser, T. Stanev, and S. Tilav, “Cosmic Ray Energy Spectrum from Measurements of Air Showers,” Front. Phys. (Beijing) 8 (2013) 748–758, arXiv:1303.3565 [astro-ph.HE].
- (46) Peters, Il Nuovo Cim. XXII, 800-819 (1961).
- (47) M. Nagano, M. Teshima, Y. Matsubara, H. Dai, T. Hara, N. Hayashida, M. Honda, H. Ohoka, and S. Yoshida, “Energy spectrum of primary cosmic rays above 10**17-eV determined from the extensive air shower experiment at Akeno,” J. Phys. G 18 (1992) 423–442.
- (48) M. Glasmacher et al., “The cosmic ray energy spectrum between 10**14-eV and 10**16-eV,” Astropart. Phys. 10 (1999) 291–302.
- (49) HEGRA Collaboration, F. Arqueros et al., “Energy spectrum and chemical composition of cosmic rays between 0.3-PeV and 10-PeV determined from the Cherenkov light and charged particle distributions in air showers,” Astron. Astrophys. 359 (2000) 682–694, arXiv:astro-ph/9908202.
- (50) M. Takeda et al., “Energy determination in the Akeno Giant Air Shower Array experiment,” Astropart. Phys. 19 (2003) 447–462, arXiv:astro-ph/0209422.
- (51) KASCADE Collaboration, T. Antoni et al., “KASCADE measurements of energy spectra for elemental groups of cosmic rays: Results and open problems,” Astropart. Phys. 24 (2005) 1–25, arXiv:astro-ph/0505413.
- (52) TIBET III Collaboration, M. Amenomori et al., “The All-particle spectrum of primary cosmic rays in the wide energy range from 10**14 eV to 10**17 eV observed with the Tibet-III air-shower array,” Astrophys. J. 678 (2008) 1165–1179, arXiv:0801.1803 [hep-ex].
- (53) IceCube Collaboration, M. Aartsen et al., “Measurement of the cosmic ray energy spectrum with IceTop-73,” Phys. Rev. D 88 no. 4, (2013) 042004, arXiv:1307.3795 [astro-ph.HE].
- (54) S. Ter-Antonyan, “Sharp knee phenomenon of primary cosmic ray energy spectrum,” Phys. Rev. D 89 no. 12, (2014) 123003, arXiv:1405.5472 [astro-ph.HE].
- (55) V. Prosin et al., “Results from Tunka-133 (5 years observation) and from the Tunka-HiSCORE prototype,” EPJ Web Conf. 121 (2016) 03004.
- (56) Pierre Auger Collaboration, F. Fenu, “The cosmic ray energy spectrum measured using the Pierre Auger Observatory,” PoS ICRC2017 (2018) 486.
- (57) KASCADE Grande Collaboration, C. J. Arteaga-Velázquez et al., “Measurements of the muon content of EAS in KASCADE-Grande compared with SIBYLL 2.3 predictions,” PoS ICRC2017 (2018) 316.
- (58) C. Perdrisat, V. Punjabi, and M. Vanderhaeghen, “Nucleon Electromagnetic Form Factors,” Prog. Part. Nucl. Phys. 59 (2007) 694–764, arXiv:hep-ph/0612014.
- (59) R. H. Helm, “Inelastic and Elastic Scattering of 187-Mev Electrons from Selected Even-Even Nuclei,” Phys. Rev. 104 (1956) 1466–1475.
- (60) J. Lewin and P. Smith, “Review of mathematics, numerical factors, and corrections for dark matter experiments based on elastic nuclear recoil,” Astropart. Phys. 6 (1996) 87–112.
- (61) C. Kouvaris and I. M. Shoemaker, “Daily modulation as a smoking gun of dark matter with significant stopping rate,” Phys. Rev. D 90 (2014) 095011, arXiv:1405.1729 [hep-ph].
- (62) G. D. Starkman, A. Gould, R. Esmailzadeh, and S. Dimopoulos, “Opening the Window on Strongly Interacting Dark Matter,” Phys. Rev. D 41 (1990) 3594.
- (63) R. Rudnick and S. Gao, Composition of the continental crust, in Treatise on Geochemistry, Pergamon, Oxford, 2003.DOI:10.1016/B0-08-043751-6/03016-4.
- (64) XENON Collaboration, E. Aprile et al., “Dark Matter Search Results from a One Ton-Year Exposure of XENON1T,” Phys. Rev. Lett. 121 no. 11, (2018) 111302, arXiv:1805.12562 [astro-ph.CO].
- (65) XENON Collaboration, E. Aprile et al., “Light Dark Matter Search with Ionization Signals in XENON1T,” Phys. Rev. Lett. 123 no. 25, (2019) 251801, arXiv:1907.11485 [hep-ex].
- (66) XENON Collaboration, E. Aprile et al., “XENON1T dark matter data analysis: Signal and background models and statistical inference,” Phys. Rev. D 99 no. 11, (2019) 112009, arXiv:1902.11297 [physics.ins-det].
- (67) A. M. Green, “Calculating exclusion limits for weakly interacting massive particle direct detection experiments without background subtraction,” Phys. Rev. D 65 (2002) 023520, arXiv:astro-ph/0106555.
- (68) C. Savage, G. Gelmini, P. Gondolo, and K. Freese, “Compatibility of DAMA/LIBRA dark matter detection with other searches,” JCAP 04 (2009) 010, arXiv:0808.3607 [astro-ph].
- (69) CRESST Collaboration, G. Angloher et al., “Results on light dark matter particles with a low-threshold CRESST-II detector,” Eur. Phys. J. C 76 no. 1, (2016) 25, arXiv:1509.01515 [astro-ph.CO].
- (70) CRESST Collaboration, G. Angloher et al., “Results on MeV-scale dark matter from a gram-scale cryogenic calorimeter operated above ground,” Eur. Phys. J. C 77 no. 9, (2017) 637, arXiv:1707.06749 [astro-ph.CO].
- (71) M. S. Mahdawi and G. R. Farrar, “Constraints on Dark Matter with a moderately large and velocity-dependent DM-nucleon cross-section,” JCAP 10 (2018) 007, arXiv:1804.03073 [hep-ph].
- (72) W. L. Xu, C. Dvorkin, and A. Chael, “Probing sub-GeV Dark Matter-Baryon Scattering with Cosmological Observables,” Phys. Rev. D 97 no. 10, (2018) 103530, arXiv:1802.06788 [astro-ph.CO].
- (73) AMS Collaboration, M. Aguilar et al., “Observation of the Identical Rigidity Dependence of He, C, and O Cosmic Rays at High Rigidities by the Alpha Magnetic Spectrometer on the International Space Station,” Phys. Rev. Lett. 119 no. 25, (2017) 251101.
- (74) T. R. Slatyer and C.-L. Wu, “Early-Universe constraints on dark matter-baryon scattering and their implications for a global 21 cm signal,” Phys. Rev. D 98 no. 2, (2018) 023013, arXiv:1803.09734 [astro-ph.CO].
- (75) K. K. Boddy and V. Gluscevic, “First Cosmological Constraint on the Effective Theory of Dark Matter-Proton Interactions,” Phys. Rev. D 98 no. 8, (2018) 083510, arXiv:1801.08609 [astro-ph.CO].
- (76) R. Murgia, V. Irˇsič, and M. Viel, “Novel constraints on noncold, nonthermal dark matter from Lyman- forest data,” Phys. Rev. D 98 no. 8, (2018) 083540, arXiv:1806.08371 [astro-ph.CO].
- (77) G. Krnjaic and S. D. McDermott, “Implications of BBN Bounds for Cosmic Ray Upscattered Dark Matter,” Phys. Rev. D 101 no. 12, (2020) 123022, arXiv:1908.00007 [hep-ph].
- (78) CREAM Collaboration, H. Ahn et al., “Discrepant hardening observed in cosmic-ray elemental spectra,” Astrophys. J. Lett. 714 (2010) L89–L93, arXiv:1004.1123 [astro-ph.HE].
- (79) T. K. Gaisser, “Spectrum of cosmic-ray nucleons, kaon production, and the atmospheric muon charge ratio,” Astropart. Phys. 35 (2012) 801–806, arXiv:1111.6675 [astro-ph.HE].
- (80) A. Hillas, “Can diffusive shock acceleration in supernova remnants account for high-energy galactic cosmic rays?,” J. Phys. G 31 (2005) R95–R131.
- (81) B. Lenardo, K. Kazkaz, A. Manalaysay, J. Mock, M. Szydagis, and M. Tripathi, “A Global Analysis of Light and Charge Yields in Liquid Xenon,” IEEE Trans. Nucl. Sci. 62 no. 6, (2015) 3387–3396, arXiv:1412.4417 [astro-ph.IM].
- (82) J. Thomas and D. Imel, “Recombination of electron-ion pairs in liquid argon and liquid xenon,” Phys. Rev. A 36 (1987) 614–616.
- (83) M. Szydagis, N. Barry, K. Kazkaz, J. Mock, D. Stolp, M. Sweany, M. Tripathi, S. Uvarov, N. Walsh, and M. Woods, “NEST: A Comprehensive Model for Scintillation Yield in Liquid Xenon,” JINST 6 (2011) P10002, arXiv:1106.1613 [physics.ins-det].
- (84) A. Drukier, K. Freese, and D. Spergel, “Detecting Cold Dark Matter Candidates,” Phys. Rev. D 33 (1986) 3495–3508.
- (85) W. A. Rolke, A. M. Lopez, and J. Conrad, “Limits and confidence intervals in the presence of nuisance parameters,” Nucl. Instrum. Meth. A 551 (2005) 493–503, arXiv:physics/0403059.
- (86) XENON Collaboration, E. Aprile et al., “XENON1T Dark Matter Data Analysis: Signal Reconstruction, Calibration and Event Selection,” Phys. Rev. D 100 no. 5, (2019) 052014, arXiv:1906.04717 [physics.ins-det].