Effect of Bars on Evolution of SDSS Spiral Galaxies
Abstract
We explore the significance of bars in triggering central star formation (SF) and AGN activity for spiral galaxy evolution using a volume-limited sample with , , and selected from SDSS DR7. On a central SF rate- plane, we measure the fraction of galaxies with strong bars in our sample and also the AGN fractions for barred and non-barred galaxies, respectively. The comparison between the bar and AGN fractions reveals a causal connection between the two phenomena of SF quenching and AGN activity. A massive BH and abundant gas fuels are sufficient conditions to trigger AGNs. We infer that the AGNs triggered by satisfying the two conditions drive the strong AGN feedback, suddenly suppressing the central SF and leaving the SF sequence. We find that in galaxies where either of the two conditions is not sufficient, bars are a great help for the AGN triggering, accelerating the entire process of evolution, which is particularly evident in pseudo-bulge galaxies. All of our findings are obtained only when plotted in terms of their central velocity dispersion and central SFR (not galactic scale SFR), indicating that the AGN-driven SF quenching is confined in the central kpc region.
keywords:
galaxies: active — galaxies: nuclei — galaxies: evolution — galaxies: formation — galaxies: starburst1 Introduction
Gas-inflows into the galactic central region play an important role in galaxy formation and evolution. Understanding how to drive gas into the small scales of galactic nuclei has been an important issue over the past two decades, and various gas-inflow mechanisms have been proposed; for example, on galactic scales, galaxy-to-galaxy interaction, major mergers (Sanders et al., 1988; Springel et al., 2005; Di Matteo et al., 2005; Hopkins et al., 2006; Alonso et al., 2007; Kim et al., 2020), minor mergers (Roos, 1981; Hernquist & Mihos, 1995), and bar-driven gas inflow (Combes, 2003; Kormendy & Kennicutt, 2004) and on smaller scales, turbulence of interstellar medium (ISM) in galactic discs (Elmegreen et al., 1998; Wada, 2004, 2009; Kawakatu & Wada, 2008), stellar wind (Ciotti & Ostriker, 2007; Davies et al., 2012), and so on.
In this study, we focus on the role of bar-driven gas inflow for triggering nuclear activity of a galaxy. Gravitational interactions between stars and gases in the galactic bars reduce the angular momentum of gases, driving them into a few hundred parsec central region (Lynden-Bell, 1979; Shlosman et al., 1990; Sellwood, 1981; Heller & Shlosman, 1994; Combes et al., 2014; Carles et al., 2016). Based on this idea, many simulations have shown that the elongated bar structure can drive gas into central regions of the galaxy (Friedli & Benz, 1993; Debattista & Sellwood, 1998; Athanassoula, 2003). The large-scale bar potential forms another non-axisymmetric substructure inside the bar that helps to cause the gas inflow further closer to the central BH: nuclear spirals (Ann & Thakur, 2005; Thakur et al., 2009; Kim & Elmegreen, 2017) or nuclear rings (Kim et al., 2011; Shin et al., 2017) at several hundred parsecs, and nuclear bars or secondary bars (Namekata et al., 2009) at a few ten parsecs.
The presence of a large-scale bar often accompanies star formation (SF) and/or AGN. Indeed, several observational studies found that, compared to non-barred galaxies, barred galaxies show a higher central SF activity (Heckman, 1980; Knapen et al., 2002; Jogee et al., 2005; Hunt et al., 2008; Bang & Ann, 2009; Hao et al., 2009; Ellison et al., 2011; Oh et al., 2012; Wang et al., 2012; Consolandi et al., 2017) or a higher AGN fraction (Hao et al., 2009; Oh et al., 2012; Alonso et al., 2013; Galloway et al., 2015). However, some studies found no compelling evidence for AGN-bar (Lee et al., 2012b; Cheung et al., 2015a; Cisternas et al., 2015; Goulding et al., 2017) or SF-bar connection (Martinet & Friedli, 1997; Chapelon et al., 1999; Willett et al., 2015). Cheung et al. (2015b) found in quiescent SDSS spiral galaxies no difference in the stellar populations and chemical evolution of barred and non-barred galaxies. Even the anti-correlations between bar presence and SF activity (Cheung et al., 2013; Gavazzi et al., 2015; Consolandi et al., 2017) and between bar presence and HI gas (Masters et al., 2012; Cervantes Sodi, 2017) were found. Consolandi et al. (2017) demonstrated the spatial correlation between the presence of a bar and the central cold dust content from the FIR emission. has also been demonstrated by Consolandi et al. (2017).
These confusing and controversial observational results suggest that SF or AGN is not observed in all barred-galaxies. That is, nuclear activities are likely to be closely related to bar instability rather than the bar itself (e.g., Fanali et al., 2015). Bar instability has to do with galaxy properties such as star formation rate (SFR) and gas availability. Several studies using SDSS spiral galaxies support the point. Lee et al. (2012b) found that, when colour and mass are fixed, a slight excess of pure AGN (Kewley et al., 2006) fraction is seen in barred galaxies (but with large uncertainty). Bars in red spiral galaxies are more frequently seen and stronger than those in blue spiral galaxies (Masters et al., 2010, 2011; Lee et al., 2012a; Oh et al., 2012; Alonso et al., 2013; Cheung et al., 2013), which is consistent with a result of Kim et al. (2017) showing that SF activity and gas amount in galaxies with strong bar are lower than those of non-barred ones.
Positive bar-SF and bar-AGN connections are more common in blue spiral galaxies. Therefore, when investigating the role of bars in the galaxy secular evolution accompanying SF and AGN activities, the galaxy properties closely related to growth of bar instability should be considered.
In this work, we investigate the relationship between strong-barred spiral galaxies and AGN activities using the same morphological classification as Lee et al. (2012a, b) and a more conservative AGN classification with higher signal-to-noise criteria. Lee et al. (2012b) found no evidence for an AGN-bar connection even at fixed colour and . The biggest difference between our study and that of Lee et al. (2012b) is that we pay more attention to the various properties at the galactic centre that are expected to be more closely related to nuclear activities such as bulge prominence, central velocity dispersion, central mass concentration, and central SF rather than the measurements from the entire galaxy such as a colour, total SFR, and stellar mass.
The rest of this paper is organized as follows. We describe our sample and AGN selection in Section 2 and show how the bar fraction depends on the star formation rate and velocity dispersion at the central region in Section 3.1. At given galaxy properties, the bar effects on AGN triggering and AGN activity level are examined in Section 3.2.1. Because bar formation and evolution are correlated with central mass concentration of the galaxy, we also explore how the bar effect and the scaled bar length vary when the central properties are determined after dividing the sample into two bulge-type samples, presented in Sections 3.3 and 3.4. Finally, the discussion is presented in Section 4.
2 Data and Sample Selection
We use the volume-limited face-on spiral galaxy sample of Lee et al. (2012a, b) with the -band absolute magnitude (hereafter, we excluded the term in absolute magnitude calculation) and redshifts , selected from Sloan Digital Sky Survey Data Release 7 (SDSS DR7; Abazajian et al., 2009). Throughout this paper, the cosmological parameters are assumed from the CDM cosmological model using density parameters and .
2.1 Morphology Classification
Morphology classification is adopted from the Korea Institute for Advanced Study DR7 Value-Added Galaxy Catalogue (KIAS DR7-VAGC; Choi et al., 2010), which is complementary to the New York University Value-Added Galaxy Catalogue (NYU VAGC; Blanton et al., 2005). Galaxies are well divided into early-type (ellipticals and lenticulars) and late-type (spirals and irregulars) based on their locations in colour versus colour gradient space and colour versus -band concentration index space (see, Park & Choi, 2005). With additional visual inspection by Lee et al. (2012a), some galaxy morphologies are changed. In this study, we use only late-type galaxies.
In Lee et al. (2012a), galaxies are classified into four groups based on visual inspection of SDSS colour images: strong-barred, weak-barred, ambiguous-barred,and non-barred galaxies. Classified barred galaxies are in good agreement with classification of Nair & Abraham (2010). In this paper, we define only strong-barred galaxies as barred galaxies, which have a bar size larger than of galaxy size. To ensure selection of barred galaxies by visual inspection, only galaxies with a ratio between -band isophotal minor and major axis, , higher than 0.6 are included. Non-barred galaxies are defined as galaxies not strong or weak or ambiguous-barred.
Fibre star formation rate, , is obtained from MPA-JHU DR8 catalogue. of the star-forming galaxies (SFGs) is estimated from emission lines (Brinchmann et al., 2004), while that of others types is estimated from fibre photometry (Salim et al., 2007).
Fundamental photometry parameters of and colour are adopted from the KIAS DR7-VAGC. The colour and have been de-reddened for Galactic extinction (Schlegel et al., 1998) and k-corrected to redshift (Blanton et al., 2003). For stellar velocity dispersion, adopted from NYU-VAGC, only spectra with mean S/N per spectral pixel greater than are used. A simple aperture correction of is made using the formula of Bernardi et al. (2003) to correct errors due to the finite size of the optical fibre. In this study, we use only galaxies with to reduce systematic errors induced by the instrumental resolution of SDSS spectroscopy and to avoid a selection effect due to the [O III] flux limit in detecting AGN.
This cut excludes many disk-dominated and irregular late-type galaxies in our late-type galaxy sample, resulting in a final sample of 6,195 spiral galaxies, of which 1,893 (31%) are barred and 3,754 (61%) are non-barred. The rest are weak or ambiguous barred galaxies.
2.2 AGN Selection
Type AGNs are separated from SFGs based on the flux ratios of Balmer and ionization lines (BPT diagram; Baldwin et al., 1981; Veilleux & Osterbrock, 1987). The activity types are classified based on the ratios of emission lines (, , , and ) detected with . We classify the activity types of galaxies using a conservative AGN definition from Kewley et al. (2006). The pure AGNs located above the maximum starburst line of Kewley et al. (2001) contain Seyfert and low-ionization nuclear emission-line regions (LINERs). The starburst-AGN composite galaxies located between the maximum starburst line of Kewley et al. (2001) and the pure star-forming line of Kauffmann et al. (2003) contain both AGN and extended HII regions. Since optical continuum dominated by non-thermal emissions from Type I AGN makes it difficult to study their host galaxies, we excluded potential Type I AGNs that have a emission line width larger than (FWHM).
In this study, we define an AGN host by combining composite galaxies and pure AGNs. All the LINERs identified by the BPT diagram are not bona-fide AGN. Some of the weak LINERs are retired galaxies powered by hot low-mass evolved stars rather than low luminosity AGNs (Stasińska et al., 2008; Cid Fernandes et al., 2010, 2011; Melnick & De Propris, 2013). By adopting a criterion of Cid Fernandes et al. (2011), we excluded the ambiguous objects with from pure AGN. Out of our final sample, 58% are classified as conservatively-defined emission galaxies with . The details are listed in Table 1. Table 1 also shows how the activity types of the sample galaxies vary depending on a the threshold adopted for emission line detection. As the threshold of decreases to 3, commonly used in the BPT-AGN classification, both the number of SFGs and composite objects increase by approximately 30%. On the other hand, the number of pure AGNs increases by 12%, and that of retired galaxies that were excluded from pure AGNs increases by 165%. Therefore, the contribution of the retired galaxies to the AGN fraction should be noted when using the low threshold.
3 Results
3.1 Bar Effect on Central Star Formation
First, we investigate how physical properties at the galactic centre are related to the presence of a strong bar. This is because bars rearrange the disc gas content and drive it to the central region, changing the central properties, such as central mass concentration (CMC) and central SFR.
We measure a bar fraction, , in two-dimensional space in terms of and . The is defined as ratio of the number of barred galaxies to the number of total galaxies.
As a proxy of central SFR within the inner few kpc of a galaxy, we use a fibre SFR measured within a SDSS fibre aperture, . At the median redshift of our sample, , the physical diameter of the fibre aperture corresponds to kpc, which is similar to the average size of bulges in the late-type galaxies we selected (e.g., Fisher & Drory, 2010; Cheung et al., 2015b). One can estimate fibre size from the SDSS images as in Figure 9 below. We also fix central velocity dispersion, , because CMC influences (Athanassoula et al., 2005).
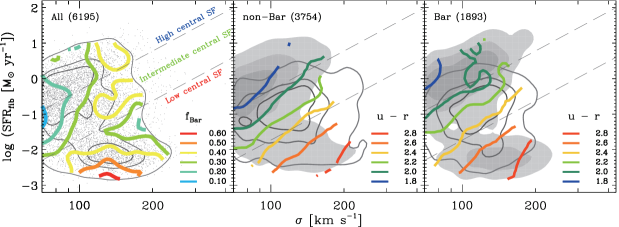
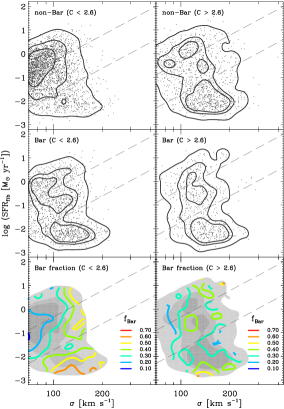
In the left panel of Figure 1, coloured thick solid line contours show the distribution of in two-dimensional space in terms of and . Weak barred and ambiguous galaxies are excluded from our bar selection. For comparison, the number density distribution of the whole sample is plotted with grey thin line contours. For each of non-barred and barred galaxies, the number density distributions of non-AGN and AGN host galaxies are also plotted with grey filled and grey line contours in the middle and right panels, respectively.
Hereafter, unless otherwise noted, all the smoothed distributions in the figures of this study are obtained using the fixed-size spline kernel for each bin (60 by 60) in the parameter space explored. The significance level for the smoothed galaxy distributions is calculated using the bootstrap method with 1000 runs. Each contour encloses , , and in order. The uncertainties for the (or AGN fraction below) measurements were also calculated using the bootstrap method. For bins with the lowest of 0.1, the relative uncertainty is less than 15%.
The notable feature is found in the galaxy number density distributions in and space, which exhibits three distinct peaks. Comparing the middle and right panels, we infer that the barred galaxy sample contributes greatly to the distinct trimodal distribution feature that appears to result from two relatively rapid SF quenchings. We also note that the dependency of on the and changes before and after the rapid quenching processes.
Considering these features, we divide the parameter space into three locations with two long-dashed diagonal lines, for convenience. Galaxies in different locations are at different evolutionary stages. In the middle and right panels, the distributions of median colour for non-barred and barred galaxies are overlaid on the same space with coloured thick solid line contours, respectively. The colour is used as an indicator of SF history of a galaxy. As a galaxy ages, its colour becomes redder. In Table 2, the demographics for galaxies in each location are shown in detail.
Above the upper diagonal line, there is a sequence of galaxies having a tight correlation of and . This includes 32% of our sample, most (83%) of which are classified as SFGs. Their AGN fraction is only 6%. These galaxies have blue colour (mostly ). The in this region strongly depends on ; bars are most frequently found around , but the number is small. It is noteworthy that the difference in colour between barred and non-barred galaxies is larger in the SF main sequence than in any other region; barred galaxies are significantly redder and their also strongly depends on . In other words, at given colour and , barred galaxies exhibit significantly higher than non-barred galaxies, suggestive of gas-inflow exerted by a strong torque from bars (Hunt & Malkan, 1999; Jogee et al., 2005; Spinoso et al., 2017).
Between the two diagonal lines, there are galaxies having intermediate colour of about , and 50% of them host an AGN. When using the low threshold, 60% host an AGN and 30% are SFGs. This is consistent with the previous result that most AGNs reside in green valley galaxies (Goulding et al., 2010; Schawinski et al., 2009). At a given , AGN hosts and SFGs show very distinct differences in the central SFR. The difference in total SFR of the two populations is rather smaller. We infer from the result that a possible process causing SF quenching seems to be confined in the galactic central region.
This is more pronounced in the case of barred galaxies. For barred galaxies, about 72% host an AGN, almost twice that of non-barred counterparts. That is, bars promotes the SF quenching process. The barred galaxy exhibits higher central SFR at a given colour and is more likely found at lower at a given ; the features are evident in galaxies with , suggesting that bars effectively accelerate central gas consumption as long as there is no further inflow of gas from outside, particularly in small- galaxies. It also means that bars can contribute to rapid SF quenching in the galactic central region (see, Gavazzi et al., 2015; Consolandi et al., 2017; Rosas-Guevara et al., 2020).
Finally, let us focus on low- galaxies below the second diagonal line having a red colour of . Out of the barred galaxies, about 40% reside in this location, while this percentage for non-barred galaxies is 27%. The distribution shows that barred galaxies with are suddenly quenched compared to their non-barred counterparts.
3.2 Bar Effect on AGN
The previous section indicated that barred galaxies evolve more rapidly than non-barred galaxies through accelerated gas consumption by bars, implying that bars accelerate the SF quenching process in the central region. Then, how efficiently do bars lead to inflows to the nuclear region while they accelerate starbursts?
3.2.1 Bar Effect on AGN Fraction
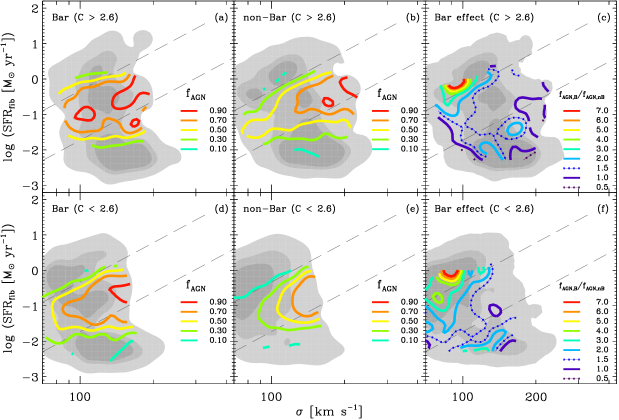
To estimate how effectively bars affect AGN, we measure a bar effect as the ratio between the AGN fractions in the barred and the non-barred galaxies on the -. A ratio greater than 1.0 indicates a positive bar effect on AGN triggering. The AGN fraction is calculated as the ratio between AGN hosts and all galaxies.
The result is plotted with coloured thick solid lines in the right panel of Figure 2. The violet thick solid line denotes a constant median colour of 2.2 of each sample. Grey filled contours in the left and middle panels show that the trimodal number distribution over - space is more pronounced in barred galaxies.
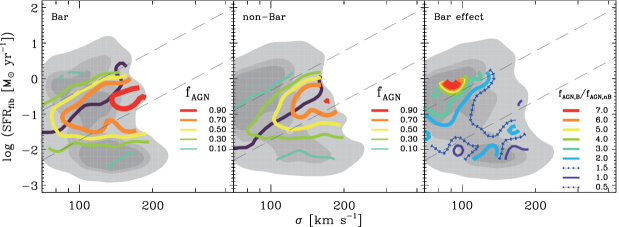
The increases as galaxies leave the SF sequence. These results remind us that starbursts and AGNs co-evolve (e.g., Di Matteo et al., 2005; Hopkins et al., 2005). In barred galaxies, evolution from SFGs to AGNs occurs more abruptly, leading to more significant increase in in the intermediate location. The SFG and AGN host populations are better isolated from each other in barred galaxies. Even when leaving the AGN phase and entering the quiescent phase, barred galaxies evolve more quickly.
The bar effect in the right panel shows the features more clearly. The bar effects are positive overall. The in barred galaxies is higher than that in non-barred galaxies across overall space, which is consistent with previous studies (Oh et al., 2012; Galloway et al., 2015).
The most significant bar effect on AGN activity occurs when leaving the SF sequence. The bars are a great help for AGN triggering in many galaxies with a smaller (i.e., less massive BHs), accelerating galaxy evolution; while many of the non-barred counterparts seem to be slowly quenched by simple depletion of gas supply through SF without AGN triggering due to the difficulty in gas transport into the nuclear region. In contrast, in galaxies with a larger , the bar effect on AGN triggering is relatively smallest but the is largest. Consequently, all AGN occurrences and rapid SF quenching are closely related to each other, which requires a massive BH or an efficient gas transport mechanism into the nuclear region such as bars.
There is another notable feature that AGN hosts are most frequently found at an almost constant colour of , regardless of and bar presence or absence. Among the non-barred galaxies with a small , a small fraction experience the AGN phase, but their peaks at about , as with that of the barred counterparts. We infer that in our sample galaxies with and , once an AGN is triggered by any quenching event, the host galaxy quickly evolves into a green valley.
Considering that gas outflows are prevalent among local Type II AGNs (Woo et al., 2016), our findings support a negative AGN feedback scenario in which outflows from the AGN can push away cold gas, hindering SF activity in the host galaxy (Silk & Rees, 1998; Di Matteo et al., 2005; Hopkins et al., 2006; Scannapieco et al., 2012).
We again find the positive bar effect on AGN triggering in low- galaxies having a red colour of . The quite sudden SF quenching led by bars is seen in the left panel in Figure 1 above, and the increase led by bars is seen in the right panel in Figure 2. Even in this case of galaxies lacking cold gas fuel, Bars can produce rapid SF quenching and BH feeding.
Meanwhile, we divided galaxies into the spectral classes of SFGs, starburst-AGN composites, and pure AGNs, which are expected to be at different evolutionary stages. We examine how bars affects the evolutionary stages; the result is shown in Figure 3. Spectral classes of SFG, starburst-AGN composite, and pure-AGN are shown in the top, middle, and bottom panels, separately.

The SFG fraction has almost the same dependency to that of the composite fraction , and as decreases, increases, suggesting that AGN detection occurs along with central SF quenching. The sudden and rapid transitions from SFGs to the starburst-AGN composite hosts or to pure-AGNs are produced effectively by bars, which is obviously seen at smaller s. At low , there is a significant positive bar effect on pure-AGN triggering.
These results are contrary to the result of Lee et al. (2012b) that pure-AGN activity is not enhanced by strong bars at fixed colour and . The only difference between this study and Lee et al. is that they examined total colour instead of central SFR, which means that the central SFR is more tightly coupled to AGN activity than the global properties of a galaxy, such as total SFR and colour. The stronger link between AGN triggering and central SF better reveals the role of strong bars. Hopkins (2012) argued that negative AGN feedback actually acts on only a very small fraction of remaining gas. Karouzos et al. (2016) performed a spatially resolved kinematic analysis of moderate luminous type II AGNs using Gemini Multi-Object Spectrograph IFU data and claimed that negative feedback is confined to the central kpc region of a galaxy.
3.2.2 Bar Effect on AGN Power
We next ask how the bar affect AGN outflow itself? We expect that, when gas fuel and BH mass are given, bars induce efficient gas-inflow, leading to stronger outflows.
To trace the outflow signature of AGN and AGN luminosity, we adopt and , respectively. Woo et al. (2016) argued that the highly ionized [O III] line is a good tracer of AGN-driven gas outflow. Larger [O III] velocity dispersion, , compared to indicates that the non-gravitational component in is larger than the gravitational component, presumably due to a stronger outflow effect. The is used as a proxy for the kinetic component in due to bulge gravitational potential.
In Figure 4, we plot the measurements as a function of Eddington ratio for barred and non-barred AGN hosts. The Eddington ratio is defined by . The is a BH mass calculated through the relation for spiral galaxies, as given by Gültekin et al. (2009).
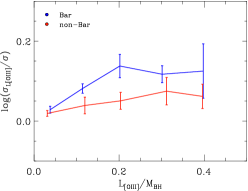
The average ratio of is larger than 1 overall, indicating that the non-gravitational component in surpasses the gravitational component overall. For a barred case, the effect of the non-gravitational component is significantly larger than that for non-barred hosts, excluding AGNs with lowest . A positive relation of AGN luminosity and outflow signature is also found.
In Figure 5, we plot the distributions of (upper) and (lower) on the and space. For comparison, the ratios for the barred and non-barred AGN hosts are plotted in the right panels. The uncertainty of each measurement is calculated by 1000 bootstrap resamplings. The contours are plotted for bins with relative uncertainty less than 1/3. Each right panel represents the ratio of measurements for barred and non-barred AGN hosts.
The two distributions are very similar. At a given , as increases, both and also increase. The increase in indicates an increase in the effect of its non-gravitational component.

The right panels show that, since AGNs are rarely observed at the beginning stage of the evolution from starbursts to AGNs, it is difficult to compare the difference in (or ) of barred and non-barred AGN hosts However, in the intermediate region where most AGNs are observable, the Eddington rate and outflow effect of the barred AGN hosts are obviously higher than those of non-barred counterparts overall. Meanwhile, in galaxies with larger and higher , the positive bar effect on the power of AGNs is not noticeable, which is consistent with the results of Figure 2 of the smallest positive bar effect on AGN triggering in these galaxies.
On the other hand, when most AGN hosts are observed at intermediate s, both their and have been significantly reduced at a given , which is consistent with the result of (Woo et al., 2017). This suggests that the negative feedback from observable AGNs today has already declined significantly.
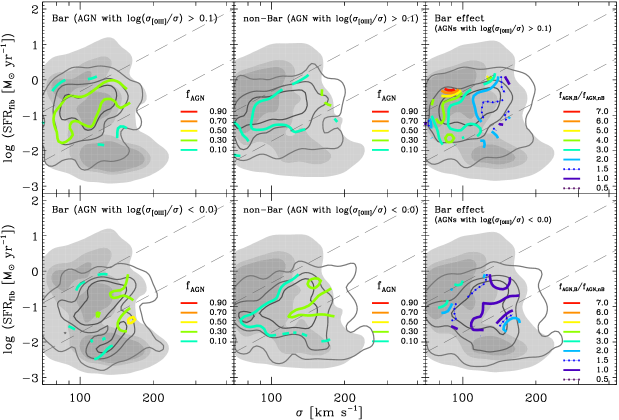
To verify the positive role of bars, we examine the bar effect on the strength of AGN outflow. We divide the AGNs into two cases with and without strong outflow signature and compare the bar effects on AGN power, as in Figure 6. The results clearly demonstrate that when and are fixed, bars in small- galaxies play a critical role in triggering powerful AGNs with a strong outflow with ; in triggering weak AGNs with in the galaxies, the role of bars is significantly reduced.
3.3 Bar Effect and Bulge Type
The bar-driven gas supply contributes to some fraction of CMC, but the CMC growth also rather weakens or dissolves the bars (Hasan & Norman, 1990; Pfenniger & Norman, 1990; Friedli & Benz, 1993). Several studies argued that the gravitational forcing of massive bulge slows bar formation (Athanassoula, 2013; Cheung et al., 2013).
Motivated by these results, we examine how build-up of bulge and bar structure are related and how a well-developed bulge affects galaxy evolution.
First, we compare how bar fraction depends on bulge type. For convenience, to distinguish classical bulge from pseudo-bulge in our sample, we adopt the Petrosian concentration index with a cut of that was used in Strateva et al. (2001) to separate ellipticals and spiral galaxies. The , is defined as the ratio between central radii of a galaxy containing 50% and 90% of the -band Petrosian flux, . Gadotti (2009) argued that the light concentration index is a better proxy for the bulge-to-total ratio than the global Sersic index, and that galaxies with include only few pseudo-bulges.
The results are shown in Figure 7. The bottom panels show the distributions of for pseudo- and classical bulge samples. Interestingly, the overall bar fractions for both bulge types are 0.3. Majority of the pseudo-bulge galaxies remain in the main sequence of SFGs and rarely have bars (see the bottom left panel). They also have a strong dependency of on and . More bars found among quenched galaxies indicate that bars contribute to pseudo-bulge galaxy evolution.
In contrast, in classical bulges, the dependency of on the and is weak and many of the non-barred cases, as well as the barred cases have already been quenched (see right panels). Some of non-barred cases have larger than barred case before evolving to the quiescent stage, indicating that they assembled the concentrated bulge component early in evolution, without the help of bars. The result is not surprising because classical bulges are thought to be formed by major galaxy mergers (Kormendy, 2016). Consequently, these results clearly show that classical bulge galaxies require alternative quenching pathways such as major mergers (e.g., Toomre & Toomre, 1972; Heckman et al., 1986; Hopkins et al., 2006) and galaxy-galaxy interactions (Goulding et al., 2018).
To support this conclusion, we examine the difference of bar effect on AGN between the two bulge-type cases. One can expect that the bar effect in classical bulges is not as much as in pseudo-bulges.
The result is shown in Figure 8. At a given bulge-type, the bar effect on is shown in the right panels. Independent of bulge-type, a certain positive bar effect on AGN triggering is found over the entire space.
The most significant difference between the bulge-types is found in intermediate- galaxies. The results from panels (c) and (f) in Figure 8 demonstrate that bar-driven evolution from starburst to AGN is more effective in pseudo-bulge cases, particularly ones with a lower .
That can be explained by the classical-bulge tendency to interrupt the bar-driven gas inflow into BH (see, Norman et al., 1996). However, the explanation is ruled out because, in barred galaxies, the classical bulge case has higher values than the pseudo-bulge case (see the panels (a) and (d)), which is also found in non-barred galaxies (see panels (b) and (e)). The result clearly shows that well-developed bulges are helpful for AGN triggering in galaxies with a lower .
The lower bar effect found in classic bulge galaxies is because AGN triggering in the non-barred case is relatively easy compared to that in the pseudo-bulge counterparts (see panels (b) and (e)).
3.4 Scaled Bar Lengths
Many previous studies have showed that bar length varies with galaxy properties; for example, bars in early-type galaxies are clearly longer than bars in late-type galaxies (e.g., Elmegreen et al., 1996; Erwin, 2005; Laurikainen & Salo, 2017). The relative bar length of star-forming galaxies increases with increasing and is longer at higher than that of AGN hosts (Oh et al., 2012). Galaxies with classical-bulges tend to have longer bars than ones with pseudo-bulges, and relative bar lengths of galaxies with star-forming classical bulges are largest (Cheung et al., 2013).
In this section, we explore how bar length is related to evolutionary sequence. First, we list SDSS colour-composite images of some sample galaxies with bar in the range of in Figure 9. The SDSS images show how much the area corresponding the finite size of the optical fibre () covers the inner region of our sample galaxies. Before looking at the results, it should be kept in mind that the galaxies in our sample have relatively large values of or more, so many disk-dominated and faint spiral galaxies possibly are excluded, and only strong bars are included in our bar selection.
As in Figure 9, it is difficult to distinguish the relationship between bar length and morphological characteristics of its host galaxy by visual inspection. Nevertheless, we find a notable feature that, at a given , bars in galaxies with higher are longer.
Therefore, we adopt the bar length measurements provided by a galaxy zoo project (Hoyle et al., 2011). Out of 1,893 barred galaxies in our sample, 1,102 are matched with the galaxy zoo sample. Most of the missing galaxies are those with apparent -band magnitudes greater than 17.0. Bar length is normalized to two times the band Petrosian radius 90 of the galaxy. In Table 3, we list the mean values for the relative bar length for six subsamples with different and . We also list the values when the morphological type of galaxy bulge is fixed.
Barred galaxies with large s tend to have longer bars overall. When a bulge-type is fixed, the dependency of the scaled bar length mostly disappears, indicating that bar length is closely related to concentration. It is clear that concentrated bulge galaxies have longer bars than less-concentrated bulge ones. At a given , bar length decreases as decreases, which is consistent with the results of previous observational studies (Martinet & Friedli, 1997; Cheung et al., 2013). Oh et al. (2012) gave a similar result that, at a given large , the bars in galaxies with high central SFR are longer. It is noteworthy that the low- galaxies tend to have much shorter bars than other galaxies. Our observational findings demonstrate that a bar not only accelerates the evolution of host galaxy, but a bar itself also evolves along with the galaxy evolution.

4 Summary and Conclusion
We explored the significance of bars in AGN activities and star formation quenching in galaxies using a volume-limited face-on late-type galaxy sample with , , and selected from SDSS DR7. Out of 6,195 galaxies, 1,659 Type II AGNs are conservatively identified, and 1,893 strong-barred galaxies are classified as barred galaxies using the bar classification visually inspected by Lee et al. (2012b). Our barred galaxy sample is biased towards early-type morphology because of the lower cut of . The redshift range was determined so that the spectroscopic fibre aperture could enclose the bulge at a galactic center.
We found a distinct trimodal distribution of galaxies in and space suggesting that SF quenching occurs through two short-lived transition processes, which is particularly seen in barred galaxies.
The AGN fraction distribution on the same space shows that the AGN fraction increases with decreasing SFG fraction and peaks at the intermediate region, suggesting that SF quenching and AGN occurrence are accompanied. Outcomes from barred galaxies support this scenario, showing more sudden quenching and higher AGN fraction. This also indicates that bars are very capable of transporting cold gas fuel into the nuclear region.
Here, when most AGNs are observed behind the SF sequence, their Eddington ratio and outflow strength have already been reduced. In other words, the two phenomena of central SF and AGN activity take place together without a large delay. In this context, we postulate that a low AGN fraction at high is due to the difficulty in observing the triggered AGNs in this optical survey rather than the difficulty in inducing BH accretion itself. The dense dusty gases surrounding the nuclear region obscure the AGNs (see section 3.3 of Hickox & Alexander, 2018, for a review). Chen et al. (2015) found that the obscured quasar fraction among far-IR quasars increases significantly with far-IR luminosity increasing.
Our findings allow us to infer that powerful gas outflows driven by AGNs lead to rapid galaxy quenching. The gas outflows, which are prevalent among local Type II AGNs (Woo et al., 2016), push out the gas and dust enshrouding a BH and negate future gas fuel supply to the BH, resulting in SF quenching and AGN unveiling.
When most AGNs are detected, the role of bars as an inducer of AGN activity is markedly large when galaxies have smaller s, i.e., less massive BHs. The positive role is also prominent even in galaxies lacking cold gas fuel, even in galaxies with massive BHs.
Galaxies without a bar, particularly those having a less massive BH, seem to be slowly quenched by simple depletion of gas supply through SF, resulting in relatively smooth transition during the evolutionary sequence. A smaller fraction of galaxies experience the AGN phase which is weak.
In conclusion, the abundant gas fuel and massive BH are paramount to galaxy evolution. If these two sufficient conditions are satisfied, galaxies evolve quickly without great help from bars. It is obvious that bar instability accelerates the entire process of galaxy evolution by facilitating gas consumption through SF and gas inflow into BH, which, however, is greatly helpful in galaxies where either of the two conditions is not sufficient.
In addition to bar instability, external processes such as continuous interactions, minor merger (e.g., Sancisi et al., 2008), tidal interaction, and so on are responsible for another effective gas transport mechanism. This provides a significant source of fuel for gas accretion to maintain long-lived bars or reform bars (Bournaud & Combes, 2002). The bar reformation can be also triggered by tidal interaction (Gerin et al., 1990; Berentzen et al., 2004) or a strong tidal field in a cluster (Byrd & Valtonen, 1990). In a future paper, we will assess the importance of the external process on galaxy evolution in addition to bar instability.
Acknowledgements
We acknowledge support from the National Research Foundation (NRF) of Korea to the Center for Galaxy Evolution Research (No. 2017R1A5A1070354). The work by S.S.K. was supported by the NRF grant funded by the Ministry of Science and ICT of Korea (NRF-2014R1A2A1A11052367). This work was also supported by the BK21 plus program through the NRF funded by the Ministry of Education of Korea.
Funding for the SDSS and SDSS-II has been provided by the Alfred P. Sloan Foundation, the Participating Institutions, the National Science Foundation, the U.S. Department of Energy, the National Aeronautics and Space Administration, the Japanese Monbukagakusho, the Max Planck Society, and the Higher Education Funding Council for England. The SDSS Web site is http://www.sdss.org/. The SDSS is managed by the Astrophysical Research Consortium for the Participating Institutions. The Participating Institutions are the American Museum of Natural History, Astrophysical Institute Potsdam, University of Basel, Cambridge University, Case Western Reserve University, University of Chicago, Drexel University, Fermilab, the Institute for Advanced Study, the Japan Participation Group, Johns Hopkins University, the Joint Institute for Nuclear Astrophysics, the Kavli Institute for Particle Astrophysics and Cosmology, the Korean Scientist Group, the Chinese Academy of Sciences (LAMOST), Los Alamos National Laboratory, the Max-Planck-Institute for Astronomy (MPIA), the Max-Planck-Institute for Astrophysics (MPA), New Mexico State University, Ohio State University, University of Pittsburgh, University of Portsmouth, Princeton University, the United States Naval Observatory, and the University of Washington.
References
- Abazajian et al. (2009) Abazajian, K. N., et al., 2009, ApJ, 746, 90
- Alonso et al. (2007) Alonso, M. S., Lambas, D. G., Tissera, P., & Coldwell, G., 2007, MNRAS, 375, 1017
- Alonso et al. (2013) Alonso, M. S., Coldwell, G., & Lambas, D. G., 2013, A&A, 549, A141
- Ann & Thakur (2005) Ann, H. B., & Thakur, P., 2005, ApJ, 620, 197
- Athanassoula (2003) Athanassoula, E., 2003, MNRAS, 341, 1179
- Athanassoula et al. (2005) Athanassoula, E., Lambert, J. C., & Dehnen, W., 2005, MNRAS, 363, 496
- Athanassoula (2013) Athanassoula, E., 2013, Secular Evolution of Galaxies, 305
- Baldwin et al. (1981) Baldwin, J. A., Phillips, M. M., & Terlevich, R., 1981, PASP, 93, 5
- Bang & Ann (2009) Bang, J., & Ann, H. B., 2009, J. Korean Earth Sci. Soc., 30, 1
- Berentzen et al. (2004) Berentzen, I., Athanassoula, E., Heller, C. H., & Fricke, K. J., 2004, MNRAS, 347, 220
- Bernardi et al. (2003) Bernardi, M., et al., 2003, AJ, 125, 1817
- Blanton et al. (2003) Blanton, M. R., Brinkmann, J., Csabai, I., et al., 2003, AJ, 125, 2348
- Blanton et al. (2005) Blanton, M. R., et al., 2005, AJ, 129, 2562
- Bournaud & Combes (2002) Bournaud, F., & Combes, F., 2002, A&A, 392, 83
- Brinchmann et al. (2004) Brinchmann, J., Charlot, S., White, S. D. M., et al., 2004, MNRAS, 351, 1151
- Byrd & Valtonen (1990) Byrd, G. & Valtonen, M., 1990, ApJ, 350, 89
- Carles et al. (2016) Carles, C., Martel, H., Ellison, S. L., & Kawata, D., 2016, MNRAS, 463, 1074
- Cervantes Sodi (2017) Cervantes Sodi, B., 2017, ApJ, 835, 80
- Chapelon et al. (1999) Chapelon, S., Contini, T., & Davoust, E., 1999, A&A, 345, 81
- Chen et al. (2015) Chen, C.-T. J, et al., 2015, ApJ, 802, 50
- Cheung et al. (2013) Cheung, E., Athanassoula, E., Masters, K. L., et al., 2013, ApJ, 779, 162
- Cheung et al. (2015a) Cheung, E., Trump, J. R., Athanassoula, E., et al., 2015a, MNRAS, 447, 506
- Cheung et al. (2015b) Cheung, E., et al., 2015b, ApJ, 807, 36
- Choi et al. (2010) Choi, Y.-Y., Han, D.-H., & Kim, S. S., 2010, Journal of Korean Astronomical Society, 43, 191
- Cid Fernandes et al. (2010) Cid Fernandes, R., et al., 2010, MNRAS, 403, 1036
- Cid Fernandes et al. (2011) Cid Fernandes, R., Stasińska, G., Mateus, A., & Vale Asari, N., 2011, MNRAS, 413, 1687
- Ciotti & Ostriker (2007) Ciotti, L., & Ostriker, J. P., 2007, ApJ, 665, 1038
- Cisternas et al. (2015) Cisternas, M., Sheth, K., Salvato, M., Knapen, J. H., Civano, F., & Santini, P., 2015, ApJ, 802, 137
- Combes (2003) Combes, F., 2003, Active Galactic Nuclei: From Central Engine to Host Galaxy, 290, 411
- Combes et al. (2014) Combes, F., et al., 2014, A&A, 565, A97
- Consolandi et al. (2017) Consolandi, G., Dotti, M., Boselli, A., Gavazzi, G., & Gargiulo, F., 2017, A&A, 598, A114
- Davies et al. (2012) Davies, R. i., Burtscher, L., Dodds-Eden, K., & Orban de Xivry, G., 2012, J. Phys. Conf. Ser., 372, 012046
- Debattista & Sellwood (1998) Debattista, V. P., & Sellwood, J. A., 1998, ApjL, 493, L5
- Di Matteo et al. (2005) Di Matteo, T., Springel, V., & Hernquist, L., 2005, Nature, 433, 604
- Ellison et al. (2011) Ellison, S. L., Patton, D. R., Mendel, J. T., & Scudder, J. M., 2011, MNRAS, 418, 2043
- Elmegreen et al. (1996) Elmegreen, B. G., Elmegreen, D. M., Chromey, F. R., Hasselbacher, D. A., & Bissell, B. A., 1996, AJ, 111, 2233
- Elmegreen et al. (1998) Elmegreen, B. G., Elmegreen, D. M., Brinks, E., et al., 1998, ApJ, 503, L119
- Erwin (2005) Erwin, P., 2005, MNRAS, 364, 283
- Fanali et al. (2015) Fanali, R., Dotti, M., Fiacconi, D., and Haardt, F., 2015, MNRAS, 454, 3652
- Fisher & Drory (2010) Fisher, D. B., & Drory, N., 2010, ApJ, 716, 942
- Friedli & Benz (1993) Friedli, D., & Benz, W., 1993, A&A, 268, 65
- Gadotti (2009) Gadotti, D. A., 2009, MNRAS, 393, 1531
- Galloway et al. (2015) Galloway, M. A., Willett, K. W., Fortson, L. F., et al., 2015, MNRAS, 448, 3442
- Gavazzi et al. (2015) Gavazzi, G., et al., 2015, A&A, 580, 116
- Gerin et al. (1990) Gerin, M., Combes, F.,& Athanassoula, E., 1990, A&A, 230, 37
- Goulding et al. (2010) Goulding, A. D., Alexander, D. M., Lehmer, B. D., & Mullaney, J. R., 2010, MNRAS, 406, 597
- Goulding et al. (2017) Goulding, A. D., et al., 2017, ApJ, 843, 135
- Goulding et al. (2018) Goulding, A. D., et al., 2018, PASJ, 70, 37
- Gültekin et al. (2009) Gültekin, K., et al., 2009, ApJ, 698, 198
- Hao et al. (2009) Hao, L., Jogee, S., Barazza, F. D., Marinova, I., & Shen, J., 2009, In ASP Conf. Ser. 419, Galaxy Evolution: Emerging Insights and Future Challenges, ed. S. Jogee, I. Marinova, L. Hao, & G. A. Blanc (San Francisco, CA: ASP), 419, 402
- Hasan & Norman (1990) Hasan, H., & Norman, C., 1990, ApJ, 361, 69
- Heckman (1980) Heckman, T. M., 1980, A&A, 88, 365
- Heckman et al. (1986) Heckman, T. M., Smith, E. P., Baum, S. A., et al., 1986, ApJ, 311, 526
- Heller & Shlosman (1994) Heller, C. H., & Shlosman, I. 1994, ApJ, 424, 84
- Hernquist & Mihos (1995) Hernquist, L., & Mihos, J. C., 1995, ApJ, 448, 41
- Hickox & Alexander (2018) Hickox, R. C., & Alexander, D. M., 2018, ARA&A, 56, 625
- Hoyle et al. (2011) Hoyle, B., Masters, K. L., Nichol, R. C., et al., 2011, MNRAS, 415, 3627
- Hopkins et al. (2005) Hopkins P. F., Hernquist L., Cox T. J., Di Matteo T., Martini P., Robertson B., Springel V., 2005, ApJ, 630, 705
- Hopkins et al. (2006) Hopkins, P. F., Hernquist, L., & Cox, T. J., et al., 2006, ApJS, 163, 1
- Hopkins (2012) Hopkins, P. F., 2012, MNRAS, 420, L8
- Hunt & Malkan (1999) Hunt, L. K., & Malkan, M. A., 1999, ApJ, 516, 660
- Hunt et al. (2008) Hunt, L. K., Combes, F., García-Burillo, S., et al., 2008, A&A, 482, 133
- Jogee et al. (2005) Jogee, S., Scoville, N., & Kenney, J. D. P., 2005, ApJ, 630, 837
- Kauffmann et al. (2003) Kauffmann, G., et al., 2003, MNRAS, 346, 1055
- Kawakatu & Wada (2008) Kawakatu, N., & Wada, K., 2008, ApJ, 681, 73
- Karouzos et al. (2016) Karouzos, M., Woo, J.-H., & Bae, H.-J., 2016, ApJ, 833, 171
- Kewley et al. (2001) Kewley, L. J., Dopita, M. A., Sutherland, R. S., Heisler, C. A., & Trevena, J., 2001, ApJ, 556, 121
- Kewley et al. (2006) Kewley, L. J., Groves, B., Kauffmann, G., & Heckman, T., 2006, MNRAS, 372, 961
- Kim et al. (2011) Kim, S. S., Saitoh, T. R., Jeon, M., et al., 2011, ApJL, 735, L11
- Kim et al. (2017) Kim, E., Hwang, H. S., Chung, H., et al., 2017, ApJ, 845, 93
- Kim & Elmegreen (2017) Kim, W.-T., & Elmegreen, B. G., 2017, ApjL, 841, L4
- Kim et al. (2020) Kim, M., Choi, Y.-Y., & Kim, S. S., 2020, MNRAS, 491, 4045
- Knapen et al. (2002) Knapen, J. H., Pérez-Ramírez, D., & Laine, S., 2002, MNRAS, 337, 808
- Kormendy & Kennicutt (2004) Kormendy, J., & Kennicutt, Jr. R. C., 2004, ARA&A, 42, 603
- Kormendy (2016) Kormendy, J., 2016, in Laurikainen E., Peletier R., Gadotti D., eds, Astrophysics and Space Science Library, Vol. 418, Galactic Bulges, Springer-Verlag, Berlin, p.431
- Laurikainen & Salo (2017) Laurikainen, E., & Salo, H., 2017, A&A, 598, A10
- Lee et al. (2012a) Lee, G.-H., Park, C., Lee, M. G., & Choi, Y.-Y., 2012, ApJ, 745, 125
- Lee et al. (2012b) Lee, G.-H., Woo, J.-H., Lee, M. G., et al., 2012b, ApJ, 750, 141
- Lynden-Bell (1979) Lynden-Bell, D., 1979, MNRAS, 187, 101
- Martinet & Friedli (1997) Martinet, L., & Friedli, D., 1997, A&A, 326, 363
- Masters et al. (2010) Masters, K. L., Mosleh, M., Romer, A. K., et al., 2010, MNRAS, 405, 783
- Masters et al. (2011) Masters, K. L., Nichol, R. C., Hoyle, B., et al., 2011, MNRAS, 411, 2026
- Masters et al. (2012) Masters, K. L., Nichol, R. C., Haynes, M. P., et al., 2012, MNRAS, 424, 2180
- Melnick & De Propris (2013) Melnick, J., & De Propris, R., 2013, MNRAS, 431, 2034
- Nair & Abraham (2010) Nair, P. B., & Abraham, R. G., 2010, ApJS, 186, 427
- Namekata et al. (2009) Namekata, D., Habe, A., Matsui, H., & Saitoh, T. R., 2009, ApJ, 691, 1525
- Norman et al. (1996) Norman, C. A., Sellwood, J. A., & Hasan, H., 1996, ApJ, 462, 114
- Oh et al. (2012) Oh, S., Oh, K., & Yi, S. K., 2012, ApJS, 198, 4
- Park & Choi (2005) Park, C., & Choi, Y.-Y., 2005, ApJ, 635, L29
- Pfenniger & Norman (1990) Pfenniger, D., & Norman, C., 1990, ApJ, 363, 391
- Rosas-Guevara et al. (2020) Rosas-Guevara, Y., Bonoli, S., Dotti, M., et al., 2020, MNRAS, 491, 2547
- Roos (1981) Roos, N., 1981, A&A, 104, 218
- Salim et al. (2007) Salim, S., et al., 2007, ApJS, 173, 267
- Sancisi et al. (2008) Sancisi, R., Fraternali, F., Oosterloo, T., & van der Hulst, T., 2008, A&ARev., 15, 189
- Sanders et al. (1988) Sanders, D. B., Soifer, B. T., Elias, J. H., et al., 1988, ApJ, 325, 74
- Scannapieco et al. (2012) Scannapieco, C., et al., 2012, MNRAS, 423, 1726
- Schawinski et al. (2009) Schawinski, K., Virani, S., Simmons, B., et al., 2009, ApJ, 692, L19
- Schlegel et al. (1998) Schlegel, D. J., Finkbeinger, D. P., & Davis, M., 1998, ApJ, 500, 525
- Sellwood (1981) Sellwood, J. A., 1981, A&A, 99, 362
- Shin et al. (2017) Shin, J., Kim, S. S., Baba, J., et al., 2017, ApJ, 841, 74
- Shlosman et al. (1990) Shlosman, I., Begelman, M. C., & Frank, J., 1990, Nature, 345, 679
- Silk & Rees (1998) Silk, J., & Rees, M. J., 1998, A&A, 331, 1
- Spinoso et al. (2017) Spinoso, D., Bonoli, S., Dotti, M., et al., 2017, MNRAS, 465, 3729
- Springel et al. (2005) Springel, V., Di Matteo, T., & Hernquist, L., 2005, ApJ, 620, L79
- Stasińska et al. (2008) Stasińska, G., et al., 2008, MNRAS, 391, L29
- Strateva et al. (2001) Strateva I. et al., 2001, AJ, 122, 1104
- Thakur et al. (2009) Thakur, P., Ann, H. B., & Jiang, I.-G., 2009, ApJ, 693, 586
- Toomre & Toomre (1972) Toomre, A., & Toomre, J., 1972, ApJ, 178, 623
- Veilleux & Osterbrock (1987) Veilleux, S., & Osterbrock, D. E., 1987, ApJS, 63, 295
- Wada (2004) Wada, K., 2004, Coevolution of Black Holes and Galaxies ed. L. C. Ho (Cambridge: Cambridge Univ. Press), 186
- Wada (2009) Wada, K., Papadopoulos, P. P., & Spaans, M., 2009, ApJ, 702, 63
- Wang et al. (2012) Wang, J., Kauffmann, G., Overzier, R., et al., 2012, MNRAS, 423, 3486
- Willett et al. (2015) Willett, K. W., Schawinski, K., Simmons, B. D., et al., 2015, MNRAS, 449, 820
- Woo et al. (2016) Woo, J.-H., Bae, H.-J., Son, D., & Karouzos, M., 2016, ApJ, 817, 108
- Woo et al. (2017) Woo, J.-H., Son, D., & Bae, H.-J., 2017, ApJ, 839, 120
| Number (Fraction) | ||
|---|---|---|
| All | 6195 (1.00) | 6195 (1.00) |
| SFG | 1943 (0.31) | 2507 (0.40) |
| Total AGN | 1653 (0.27) | 2107 (0.34) |
| Composite | 1190 (0.19) | 1584 (0.26) |
| Pure AGN | 463 (0.07) | 523 (0.08) |
| Retired galaxya | 261 (0.04) | 685 (0.11) |
| Note: a Retired galaxies are powered by the hot low-mass evolved stars rather than by low luminosity AGNs. | ||
| Classification (Number) | All (6195) | Bar (1893) | non-Bar(3754) |
|---|---|---|---|
| High Central SF Sample | |||
| All | 100% (1952) | 100% (473) | 100% (1330) |
| SFG | 83% (1612) | 82% (388) | 83% (1108) |
| Composite | 5% ( 102) | 10% ( 47) | 4% ( 46) |
| Pure AGN | 1% ( 19) | 1% ( 5) | 1% ( 14) |
| Intermediate Central SF Sample | |||
| All | 100% (2283) | 100% (662) | 100% (1428) |
| SFG | 14% ( 328) | 7% ( 45) | 17% ( 247) |
| Composite | 39% ( 896) | 55% (362) | 32% ( 464) |
| Pure AGN | 10% ( 233) | 17% (112) | 7% ( 99) |
| Low Central SF Sample | |||
| All | 100% (1960) | 100% (758) | 100% (996) |
| SFG | 0% ( 3) | 0% ( 0) | 0% ( 3) |
| Composite | 10% ( 192) | 8% ( 57) | 11% (110) |
| Pure AGN | 11% ( 211) | 13% ( 97) | 10% ( 96) |
| Note: The three subsamples are divided by two diagonal lines plotted in Fig. 1. | |||
| Subsample (Number) | ||
| All Galaxies | ||
| High (243) | (205) | (38) |
| Intermediate (338) | (256) | (82) |
| Low (521) | (225) | (296) |
| Galaxies with | ||
| High (71) | (53) | (18) |
| Intermediate (95) | (56) | (39) |
| Low (159) | (35) | (124) |
| Galaxies with | ||
| High (172) | (152) | (20) |
| Intermediate (243) | (200) | (43) |
| Low (362) | (190) | (172) |
| Note: The bar length is normalized to two times the -band Petrosian radius 90. A standard error of the mean is also listed. | ||