Transport signatures of the pseudogap critical point in the cuprate superconductor Bi2Sr2-xLaxCuO6+δ
Abstract
Five transport coefficients of the cuprate superconductor Bi2Sr2-xLaxCuO6+δ were measured
in the normal state down to low temperature, reached by applying a magnetic field (up to 66 T) large enough to suppress superconductivity.
The electrical resistivity, Hall coefficient, thermal conductivity, Seebeck coefficient
and thermal Hall conductivity
were measured in
two overdoped single crystals,
with La concentration ( K) and ( K).
The samples have dopings
very close to the critical doping where the pseudogap phase ends.
The resistivity displays a linear dependence on temperature whose slope is consistent with Planckian dissipation.
The Hall number decreases with reduced , consistent with a drop in carrier density from
above to below .
This drop in is concomitant with a sharp drop in the density of states inferred from prior NMR Knight shift measurements.
The thermal conductivity satisfies the Wiedemann-Franz law, showing that the
pseudogap phase at is a metal whose fermionic excitations carry heat and charge as do conventional electrons.
The Seebeck coefficient diverges logarithmically at low temperature, a signature of quantum criticality.
The thermal Hall conductivity becomes negative at low temperature, showing that phonons are chiral in the pseudogap phase.
Given the observation of these same properties in other, very different cuprates,
our study provides strong evidence for the universality of these five signatures of the pseudogap phase and its critical point.
⋆⋆ These authors contributed equally to this work.
I Introduction
Since their discovery, cuprate superconductors have captured the imagination of condensed matter physicists in a quest to elucidate the origin of their remarkably high critical temperature. A large array of experimental probes was used to scrutinize the exotic phases that emerge alongside superconductivity in these materials. Among these, the pseudogap phase stands out for its enigmatic nature. There is no consensus on the nature of this phase nor its connection to superconductivity Keimer et al. (2015). It is characterized by several experimental signatures, in particular the opening of a momentum-dependent spectral gap detected by angle-resolved photoemission (ARPES) Hashimoto et al. (2014) and a loss of density of states detected by specific heat Loram et al. (1998) and nuclear magnetic resonance (NMR) Alloul et al. (1989); Zheng et al. (2005). Transport measurements in magnetic fields high enough to suppress superconductivity down to have unveiled the otherwise hidden properties of that phase in its ground state Proust and Taillefer (2019). First, there is a drop in the carrier density at the critical doping where the pseudogap phase ends, detected by the Hall number decreasing from above to below , in YBa2Cu3Oy (YBCO) Badoux et al. (2016) and La1.6-xNd0.4SrxCuO4 (Nd-LSCO) Collignon et al. (2017). Secondly, a -linear resistivity down to , the emblematic signature of quantum criticality Taillefer (2010), is observed in Bi2+xSr2-yCuO6+δ (Bi2201) Martin et al. (1990), Nd-LSCO Daou et al. (2009a), La2-xSrxCuO4 (LSCO) Cooper et al. (2009) and Bi2Sr2CaCu2O8+δ (Bi2212) Legros et al. (2019), at . The slope of the linear regime is consistent with a scattering rate in the Planckian limit, namely – as also found in organic, heavy-fermion and iron-based superconductors at their respective quantum critical points Legros et al. (2019); Bruin et al. (2013). Another phenomenon linked to quantum criticality is the logarithmic divergence of the specific heat at low temperature, observed in heavy-fermion metals Löhneysen et al. (1994); Bianchi et al. (2003) and in the cuprates Nd-LSCO and La1.8-xEu0.2SrxCuO4 (Eu-LSCO) Michon et al. (2019). A logarithmic divergence was also observed in the Seebeck coefficient of Nd-LSCO Daou et al. (2009b) and Eu-LSCO Laliberté et al. (2011) at , whereby as – a third signature. Fourth, the Wiedemann-Franz law – which states that the thermal and electrical conductivities of electrons are equal in the limit – was found to be valid in Nd-LSCO, both just above (in the strange-metal state of -linear resistivity) and below (in the pseudogap phase) Michon et al. (2018). This tells us that the pseudogap phase is a metal whose fermionic excitations carry heat and charge as do conventional electrons. Finally, a large negative thermal Hall conductivity, , has been observed in various cuprates below Grissonnanche et al. (2019); Boulanger et al. (2020), attributed to phonons that acquire chirality upon entering the pseudogap phase Grissonnanche et al. (2020a).
The five transport properties outlined here have been observed all together in only one cuprate material, Nd-LSCO. To establish that they are universal signatures of the pseudogap phase, it is necessary to confirm them in a different cuprate, ideally all together. This is the purpose of our study, which focuses on the material Bi2201.
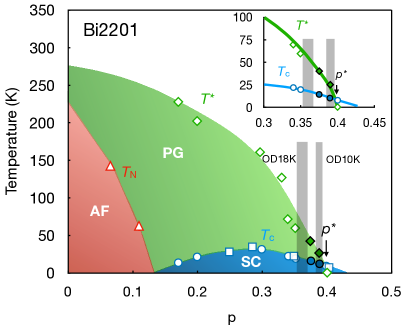
A number of transport studies have been reported for this material, in high fields and / or at high doping Putzke et al. (2021); Ono et al. (2000); Balakirev et al. (2003); Proust et al. (2005); Konstantinovic et al. (2002); Vedeneev and Maude (2004); Fruchter et al. (2007), but to our knowledge, there is no prior report of the thermal Hall effect or the Seebeck coefficient in the normal state of overdoped Bi2201 at , close to . This material presents multiple advantages, starting with a low maximal , which allows for a complete suppression of superconductivity down to by application of a magnetic field that can be achieved in high-field facilities Zheng et al. (2005). It is a single-layer cuprate, which facilitates the interpretation of Fermi surface properties. Its Fermi surface has been carefully delineated by ARPES, all the way to the highest dopings, beyond Kondo et al. (2004); Ding et al. (2019). The boundary of its pseudogap phase in the temperature-doping phase diagram has been mapped out by both ARPES Kondo et al. (2011) and NMR Kawasaki et al. (2010), and the two techniques agree on the pseudogap temperature , and therefore on the critical doping, located at (Fig. 1).
Finally, its superconducting dome extends over a significantly different doping range than in other cuprates, namely up to Kondo et al. (2004) (Fig. 1), much higher than in YBCO, Bi2212 or LSCO, for example, where it ends at Kondo et al. (2004), thereby making Bi2201 an important candidate to test the universality of the transport signatures at . Furthermore, Bi2201 is the only hole-doped cuprate currently known to exhibit charge density wave (CDW) order outside the pseudogap phase, i.e. above and well above Peng et al. (2018). Studying Bi2201 therefore allows us to separate what is due to the pseudogap from what is due to CDW order. Bi2201 is also the only material for which NMR measurements have been carried out up to (and across) , in the field-induced normal state down to Kawasaki et al. (2010), precisely where all the transport signatures of have so far been obtained – and where the focus of this Article will be (Fig. 1). Studying Bi2201 therefore allows us to directly compare the transport and NMR signatures of the pseudogap phase close to .
In this Article, we report measurements of the resistivity, the Hall and Seebeck coefficients, the thermal and thermal Hall conductivities, in the field-induced normal state of Bi2201, at two dopings very close to . Our study reveals signatures of the pseudogap critical point that are very similar to those observed in Nd-LSCO: the carrier density drops when the doping decreases below , the -linear dependence of at low T and close to has a slope consistent with Planckian dissipation, the Wiedemann-Franz law holds, the Seebeck coefficient diverges logarithmically as , and the thermal Hall conductivity is negative at low (as opposed to the electrical Hall conductivity). This shows that these five signatures are very likely to be universal amongst hole-doped cuprates.
II Methods
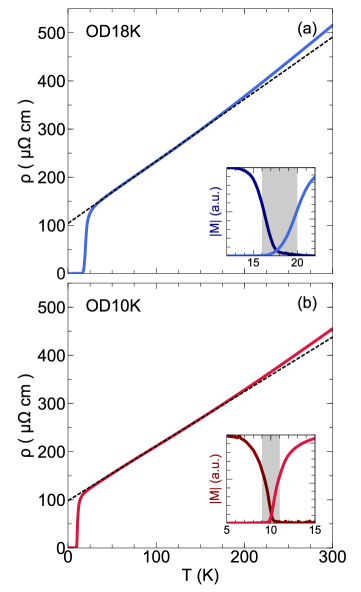
Two single crystals, of composition Bi2.05Sr1.95CuO6+δ and Bi2Sr1.8La0.2CuO6+δ, were grown by the floating-zone technique Ono and Ando (2003). They are thin rectangular platelets, with a length of 2.5 mm, a width of 0.5 mm and a thickness of 0.04 mm (normal to the CuO2 plane). Characterization by SQUID magnetization yielded sharp superconducting transitions with K and K (insets of Fig. 2). We label the samples OD10K and OD18K, respectively.
The resistivity , Hall coefficient , thermal conductivity , Seebeck coefficient , and thermal Hall conductivity were measured for both samples. Contacts were prepared using silver epoxy, annealed at 400∘C for 10 minutes and quenched at room temperature. The resulting contact resistances were less than 4 Ohms at room temperature. The currents (electrical and thermal) were applied in the CuO2 planes, that is along the length of the samples and the magnetic field was applied along the axis. Electrical transport was first performed in Sherbrooke at and T in a PPMS, then in pulsed magnetic fields up to T at the LNCMI in Toulouse, and in a static field of T at the HFML in Nijmegen (for OD10K). (In addition, we also measured the resistivity and Hall coefficient of a La-doped thin film of Bi2201 with K up to 66 T.) For detailed Methods on how resistivity and Hall effect are measured in high magnetic fields, see ref. Collignon et al., 2017; Badoux et al., 2016. The thermal conductivity was measured in Sherbrooke using a dilution refrigerator down to 80 mK, with an applied field up to T, as in ref. Michon et al., 2018 (see also ref. Shakeripour et al., 2009 for a review on thermal conductivity measurements in superconductors). Thermoelectricity was first measured in Sherbrooke using a cryostat with a VTI and a superconducting magnet up to T, and then at the LNCMI in Grenoble under a static field up to T, as in ref. Collignon et al., 2021. The thermal Hall conductivity was measured in Sherbrooke at T (see ref. Grissonnanche et al., 2016, 2019 for experimental details; data for one of our samples, OD18K, has already been reported in ref. Grissonnanche et al., 2019).
Bi2Sr2-xLaxCuO6+δ
As mentioned in the Introduction, the phase diagram of Bi2201 is different from many other hole-doped cuprates in the sense that the superconducting dome is located at much higher doping values, as observed in ARPES experiments. Furthermore, the question of relative doping in this cuprate is a delicate one, since there are many ways to dope the compound, e.g. La/Sr substitution Kawasaki et al. (2010), Bi/Sr ratio Vedeneev and Maude (2004) and excess oxygen Fruchter et al. (2007) (Bi/Pb substitution also allows to suppress the superstructure Ding et al. (2019)). These differences affect the maximum in different ways, which makes a comparison between studies difficult, especially when several doping methods are combined. In order to connect the relative position of our La-doped samples to the pseudogap phase and , we compare the values of our samples to the values of the samples used in the NMR study by Kawasaki et al. Kawasaki et al. (2010), where the same doping method was used, i.e. La/Sr substitution. This NMR study clearly reveals a closing of the pseudogap for the La composition = 0 ( K). The inset of Fig. 1 shows a zoom on the region near , including unpublished data from two additional samples (solid symbols, ref. Ito et al., ): one sample has K and K; the other sample has K and K. The end of the pseudogap phase is seen to correspond to K. So according to this NMR-derived phase diagram, our sample OD10K is located just below . Different ways are used to define the doping in Bi2201. Here, we use the relation between and established from ARPES studies by Kondo et al. Kondo et al. (2004), where the value of is obtained from the area of the measured Fermi surface, which is proportional to by the Luttinger theorem. From this relation, the end of the superconducting dome in Bi2201 is located at (Fig. 1). (A recent ARPES study Ding et al. (2019) obtained a similar relation between and in Pb-doped Bi2201.) Using this relation, we obtain for OD18K and for OD10K (Fig. 1). It is important to note that the main conclusions of this Article do not depend on the absolute values of doping, but only on the relative position of our samples with respect to the end of the pseudogap phase (which is clear from the NMR measurements).

III Resistivity: T-linear dependence and Planckian dissipation
In Fig. 2, the zero-field resistivity is plotted as a function of temperature up to 300 K. The residual resistivity is obtained by extrapolating to a linear fit to the data above (between 60 K and 160 K). In Fig. 3(c) and (d), the zero-field resistivity is plotted as divided by (continuous curve). This way of plotting the data allows for an easier comparison of the inelastic resistivity in the two samples.
In Fig. 3(a) and (b), we show the isotherms of resistivity as a function of field up to T for OD18K (a) and OD10K (b), at various temperatures from 1.5 K to 50 K. (Isotherms obtained from our thin film of Bi2201 are very similar to those of Fig. 3(a).) The normal state at K is reached when the field exceeds T for OD18K and T for OD10K. For both samples, we observe a small positive magnetoresistance above . At K, the resistivity is well described by over the entire field range, where is the resistivity at . To obtain the underlying normal state resistivity in zero field at lower temperatures, we fit the data above to the form , and extract , as illustrated by the dotted line in Fig. 3(a) – the fit to the K isotherm of sample OD18K.
In the right panels of Fig. 3, we plot the values thus obtained vs (open circles), and compare them with the data taken at T (solid circles). The difference between the two is due to the magnetoresistance, seen to grow with decreasing .
In Fig. 3(d), we see that in the absence of superconductivity, the resistivity free of magnetoresistance continues to be linear in down to about 20 K. This is also seen in Fig. 4, where at T is linear down to K. However, the linearity does not persist as , whereas it does in Nd-LSCO at (Fig. 4). The difference is that in Nd-LSCO whereas for Bi2201. In Nd-LSCO at , an upturn at low develops Daou et al. (2009a); Collignon et al. (2017), and the temperature below which the resistivity deviates upward from its high-temperature linear behaviour corresponds to the temperature measured by ARPES for the opening of the anti-nodal pseudogap Matt et al. (2015). In Fig. 3(d), we observe the same correspondance for Bi2201. Indeed, for our sample with K, the upward deviation in the resistivity begins at the temperature measured by NMR for the onset of the pseudogap phase (grey band) Ito et al. (Fig. 1). As we lower the doping to OD18K, the upward deviation gets more pronounced (Fig. 3(c)). Such upward deviations from linearity in are observed not only in Nd-LSCO Collignon et al. (2017), as mentioned above, but also in LSCO Boebinger et al. (1996); Laliberté et al. (2016); Ando et al. (2004). In both cases, they are linked to the onset of the pseudogap phase, in the sense that the deviations are seen to start at the pseudogap temperature measured by ARPES Matt et al. (2015); Collignon et al. (2017); Yoshida et al. (2009); Cyr-Choinière et al. (2018). They are attributed to a drop in carrier density that starts below . Note that in LSCO the presence of short-range magnetism below Frachet et al. (2020), at low temperature ( ), also plays a role in causing to increase as Bourgeois-Hope et al. (2019).
In Bi2201, the signature of in the resistivity depends on the magnitude of . When is large, at low doping, the resistivity shows a downward deviation below from its -linear dependence at high Kondo et al. (2011), as in YBCO Ando et al. (2004); Cyr-Choinière et al. (2018). When is small, at high doping, an upward deviation is seen below , as in Nd-LSCO and LSCO Collignon et al. (2017); Cyr-Choinière et al. (2018). The former effect can be attributed to a loss of inelastic scattering. The latter effect has been attributed to a loss of carrier density, with the possible added role of scattering from short-range magnetism. In the case of Bi2201 (with Pb substitution), the development of Cu-spin correlations has been reported below 2K across the superconducting regime Adachi et al. (2011) as well as the presence of ferromagnetic fluctuations in the heavily overdoped compounds Kurashima et al. (2018). In addition to the loss of carrier density, these magnetic correlations could contribute to the upward deviations observed at low in Figs. 3(c) and 3(d) Bourgeois-Hope et al. (2019).
To summarize, the loss of inelastic scattering below is the dominant effect in underdoped YBCO and Bi2201, whereas in LSCO and Nd-LSCO, the loss of carrier density dominates (see ref. Cyr-Choinière et al., 2018). As decreases, with increasing , the strength of inelastic scattering at weakens and the former effect gets smaller Kondo et al. (2011), becoming insignificant just below , as seen in our Bi2201 data (and in prior Bi2201 data at high doping Ono et al. (2000)).
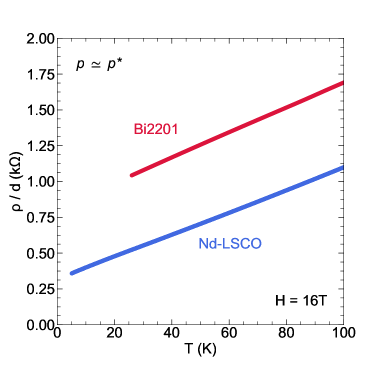
It is instructive to examine the slope of the -linear resistivity we observe in our Bi2201 samples. In Fig. 4, we compare the resistivity per plane in OD10K with that of another cuprate near : Nd-LSCO at = 0.24 Collignon et al. (2017) (estimating the resistivity per CuO2 plane allows us to compare cuprates with different crystal structures). The two systems have very similar slopes, namely / = 9.0 0.9 /K in Bi2201 and K in Nd-LSCO Legros et al. (2019), where is the slope of and is the separation between CuO2 planes. A very similar slope is also found in the bilayer cuprate Bi2212 at , namely K Legros et al. (2019). Assuming that the scattering rate has the Planckian form and magnitude, namely , and using a simple Drude form ( ), we can estimate the theoretical value for (and therefore for ) in the hypothesis that the Planckian limit is reached: = ()/() (see ref. Legros et al., 2019 for a detailed analysis). In ref. Legros et al., 2019, for Bi2201 at , the Planckian value for the resistivity’s slope was estimated to be 82 /K (to compare with the experimental value 9.00.9 /K), using specific heat data to estimate an average effective mass . (Note that in the paper by Legros et al. the value of the specific heat had to be extrapolated to higher magnetic fields than measured in ref. Ikuta et al., 2003 in order to extract the normal-state electronic specific heat at , yielding = 102 mJ/K-2mol, but recent specific heat data obtained in high magnetic fields on our sample OD10K show a good agreement with the extrapolated value: = 81 mJ/K-2mol at 3K Girod et al. (2021). With this last value, we get a theoretical slope = 6.31.1/K.) Although this is a rather rough estimate, it does show that sample OD10K exhibits a behaviour consistent with Planckian dissipation (above K). Note that the whole notion of Planckian dissipation has recently been made much more compelling by the direct extraction of the scattering time from angle-dependent magneto-resistance (ADMR) measurements on Nd-LSCO at = 0.24, whereby is found to have a perfectly linear dependence, with a slope close to Grissonnanche et al. (2020b). There is little doubt that the same scattering mechanism is at play in the three cuprates mentioned here, namely Nd-LSCO, Bi2201 and Bi2212. There may even be a universal character to the -linear resistivity seen in various metals as Bruin et al. (2013); Legros et al. (2019).
Of course, there have been previous reports of a -linear resistivity in Bi2201, e.g. in a crystal with = 7 K Martin et al. (1990) (whose doping was controlled with the ratio Bi/Sr) and in a thin film (doped with oxygen) with K Fruchter et al. (2007). In both cases, the linearity was from room temperature down to at , with a slope comparable to ours.
IV Hall coefficient: drop in carrier density
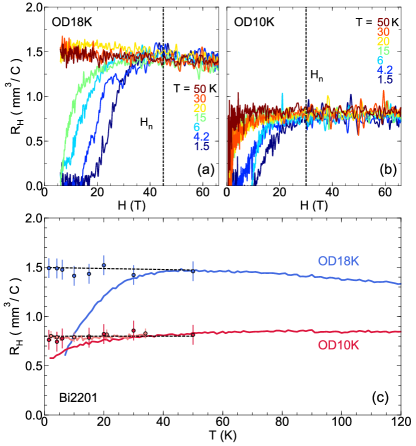
The Hall coefficient of samples OD18K and OD10K is presented in Fig. 5 as a function of field up to = 66 T, at various temperatures. is almost field independent above 45 T in OD18K and 30 T in OD10K, in agreement with the vs data (Fig. 3). In Fig. 5(c), we show as a function of temperature at T (line), T (pale line and circles, for OD10K) and T (circles). We see that at jumps by a factor with decreasing , from mm3/C in OD10K to mm3/C in OD18K. (The Hall resistance in our thin film with 20K also reaches 1.5-1.6 mm3/C at low temperature.)
In Fig. 6(a), we plot the Hall number, ), as a function of doping. For a single-band metal with isotropic Fermi surface and scattering rate, , the carrier density, in the low-temperature limit. In Bi2201, a single-band metal, is the value expected from the band structure, given by the area of the hole-like Fermi surface measured by ARPES (up to the van Hove point located at ) Kondo et al. (2004). In OD10K, we see that , as also found in Nd-LSCO at Daou et al. (2009a); Collignon et al. (2017) and Tl2201 Putzke et al. (2021) at (Fig. 6(a)). Reducing the doping to OD18K, we find that undergoes a rapid and pronounced drop.
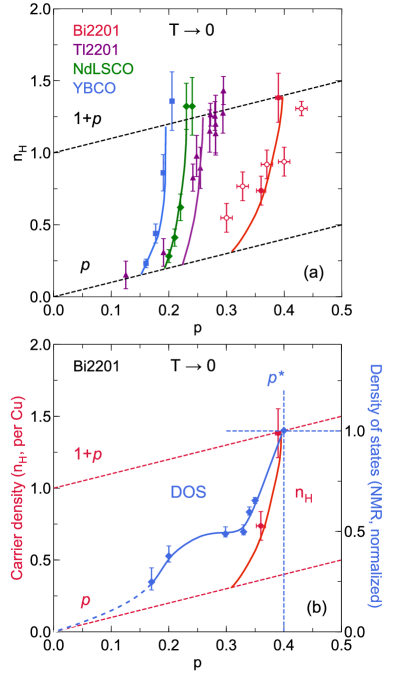
In Fig. 6(a), we compare our data on Pb-free samples of Bi2201 (full red circles) to the data of Putzke et al. on (La,Pb)-Bi2201 samples Putzke et al. (2021) (open red circles), using the same - relation to define the doping of their samples. We see that their data are reasonably consistent with our own, in particular they also show a drop in with decreasing , roughly from to . The slower decrease in seen in this plot of their data compared to our data could be due to the inadequacy of applying the same relation to both studies. (Note that Putzke et al. use a different approach to estimate the doping , unrelated to the volume of the Fermi surface, and a different approach to define the location of , relying on resistivity data rather than NMR data.)
As seen from Fig. 6(a), the drop in we report for Bi2201 is very similar to that previously seen in YBCO Badoux et al. (2016) and Nd-LSCO Collignon et al. (2017), at their own critical doping, and 0.23, respectively. The observation of the same drop in below in three different cuprate materials shows that this signature is a robust characteristic of the critical point where the pseudogap phase ends. We attribute it to a drop in carrier density, from to . Note that this drop in carrier density has a more pronounced effect on in Nd-LSCO than it does in Bi2201, a difference that remains to be understood.
A drop in with decreasing has also been reported for the single-layer cuprate Tl2201 Putzke et al. (2021), a material for which the location of is still unknown. We reproduce those data in Fig. 6(a) (purple triangles). Again, we see that drops from to . There is little doubt that the same fundamental mechanism is at play in all four cuprates, clearly associated with the onset of the pseudogap phase in the first three materials, suggesting that in Tl2201.
We point out that the Fermi surface of Bi2201 undergoes a Lifshitz transition at the van Hove point in its band structure, located at the doping ( ), whereby it goes from being hole-like below that doping to being electron-like above Kondo et al. (2004). The same is true for Nd-LSCO at Matt et al. (2015) and LSCO at Yoshida et al. (2009). Naively, one might expect the Hall coefficient to be negative at , but this is not the case because the anti-nodal regions where the Fermi surface undergoes its change to an electron-like curvature contribute very little to the conductivity, since the Fermi velocity is vanishingly small there, and the scattering is large. A recent ADMR study of Nd-LSCO at shows that to be the case, and explains why even though , and why Grissonnanche et al. (2020b). Similarly, in our Bi2201 sample OD10K, even if is only slightly below , we again get .
As shown in Fig. 6(b), the drop in below in Bi2201 is accompanied by another clear signature observed in Bi2201, obtained from measurements of the NMR Knight shift Kawasaki et al. (2010): an abrupt drop in the spin susceptibility (in the absence of superconductivity) upon crossing below , interpreted as a drop in the normal-state density of states. The combination of these two signatures of , seen in the same material for the first time, sheds new light on the nature of the pseudogap phase. The NMR data suggest that the density of states drops by a factor 2 upon entering the pseudogap phase, in going from to (Fig. 6(b)). (It decreases further, towards zero, as .) A drop in the density of states by a factor 2 and a drop in the carrier density from to are two properties of a transition into a phase of long-range antiferromagnetic order, with wavevector Verret et al. (2017). Although commensurate long-range antiferromagnetic order is seen only at dopings much lower than , whether in Bi2201 (Fig. 1) or in any other cuprate, these experimental signatures nonetheless point to some similarity between the pseudogap phase and the antiferromagnetic phase, perhaps in terms of short-range antiferromagnetic correlations. A recent ADMR study of Nd-LSCO shows that the Fermi surface is transformed upon entering the pseudogap phase Fang et al. (2020), in a way that is consistant with small nodal hole pockets akin to those expected theoretically for a Fermi surface reconstruction controlled by the antiferromagnetic wavevector Storey (2016); Verret et al. (2017) and recently detected experimentally (via ARPES and quantum oscillations) in the antiferromagnetic phase of a five-layer cuprate at low doping Kunisada et al. (2020).
It has been suggested theoretically that charge order (or charge correlations) Caprara et al. (2017), or related nematic distortions Maharaj et al. (2017), may play a role in, or be responsible for, the drop in below . Our data in Bi2201 allow us to rule out such scenarios, given the charge order observed in overdoped Bi2201 via X-ray diffraction Peng et al. (2018). Indeed, charge order is present both immediately below , in samples with K and 17 K, and immediately above , in a sample with K. At , charge order persists well above , up to at least 250 K. We see that charge order in Bi2201 is a completely distinct phenomenon from the pseudogap phase. Because the same charge correlations are observed at two dopings ( K and 17 K) Peng et al. (2018) that very nearly correspond to the dopings in our samples ( K and 18 K), these charge correlations cannot play a key role in the pronounced change we see in the Hall coefficient between OD10K and OD18K.
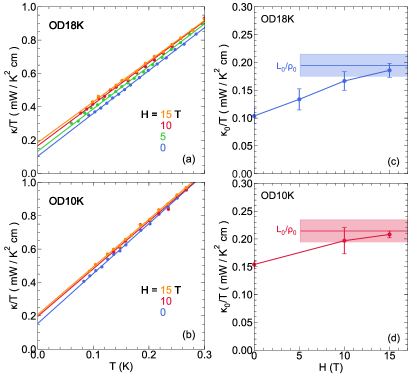
V Thermal conductivity: Wiedemann-Franz law
Fig. 7 presents thermal conductivity measurements in OD18K and OD10K at and 15 T. In the left panels, we plot as a function of temperature so that the residual linear term corresponds to the electronic contribution. The linear increase of vs – also observed in overdoped Nd-LSCO Michon et al. (2018) and Tl2201 Hawthorn et al. (2007) – is due to phonons that are predominantly scattered by electrons. Data at T and T are practically superimposed, which indicates that the normal state is very nearly reached in the bulk. (Measurements of the specific heat on the same two samples show that the critical field for OD10K is indeed 15 T, while it is T for OD18K Girod et al. (2021).) This is reminiscent of what was found in Nd-LSCO, in which the normal state in thermal conductivity measurements was also reached at a smaller field than in electric transport measurements Michon et al. (2018). This can be understood from the fact that thermal measurements are sensitive to the bulk and cannot be short-circuited by a small superconducting portion of the sample (due to an inhomogeneous doping), as can happen in electrical measurements.
Comparing the residual linear term in the superconducting state ( T) vs the normal state ( T), for OD10K, we get a ratio of . The same ratio is observed in Nd-LSCO at Michon et al. (2018), where K Michon et al. (2019). Given the similar values in the two samples, and thus a similar superconducting gap, this indicates a similar level of pair breaking by impurities, both compounds being in the dirty limit. (Note, however, that the residual resistivity per CuO2 plane is twice as large in Bi2201, namely cm , compared to cm in Nd-LSCO. This suggests that the impurities/defects responsible for elastic scattering in the normal state are less effective at breaking Cooper pairs in Bi2201 than they are in Nd-LSCO.)
In the normal state, we can test the Wiedemann-Franz law – a hallmark of metallic behavior – for each sample. This relation between charge conduction and heat conduction in the limit is given by , where is the resistivity in the limit (see below) and is the Lorenz number. It was found to be satisfied in Nd-LSCO both below and just above Michon et al. (2018), and in strongly overdoped Tl2201 Proust et al. (2002). In the right panels of Fig. 7, we plot the electronic residual linear term as a function of magnetic field, along with the value expected from the Wiedemann-Franz law, namely /, displayed as a horizontal line (with error bar). We estimate at T, by using the () fits to the high field isotherms in Fig. 3 (used to correct for the magneto-resistance, as presented with the dotted black curve in OD18K), and then take a cut of these normal state isotherms at T. We then plot the temperature dependence of ( T) and extrapolate to . The uncertainty on the geometric factors associated with the use of different contacts for the electrical and thermal measurements (since contacts were remade), leads to an error bar of about % on /. As we increase the field to reach the normal state, the electronic residual linear term tends towards its electrical counterpart in both samples, thereby showing that, within error bars, the Wiedemann-Franz law is satisfied in Bi2201, just below .
VI Seebeck coefficient: logarithmic divergence
To our knowledge, the Seebeck coefficient of Bi2201 has only been measured in zero magnetic field Konstantinovic et al. (2002); Kondo et al. (2005); Sakamoto et al. (2016), and therefore its normal-state behaviour in the limit has hitherto been unknown. At temperatures above , all studies find that is negative at high doping and positive at low doping. At optimal doping (maximal ), goes from positive at low to negative at high Kondo et al. (2005); Sakamoto et al. (2016). Although one might have expected to have the same sign as , which is always positive in Bi2201, calculations for a typical cuprate band structure show that a negative is consistent with a positive in the approximation of an isotropic scattering time (but not in the approximation of an isotropic mean free path), both below and above the van Hove point Verret et al. (2017). So the signs of and in Bi2201 at high doping are both consistent with the band structure.
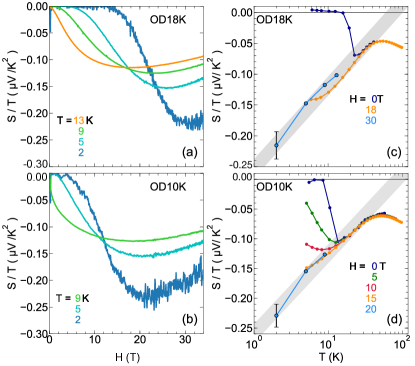
In Fig. 8, we report our measurements of the Seebeck coefficient in Bi2201, for our two samples. Left panels show isotherms of vs up to T. At the lowest temperature ( K), we see that the normal state is reached in high fields for both OD18K and OD10K, by T and T, respectively. Right panels show the temperature dependence of , plotted as vs log, combining data at low (blue dots) – taken from the isotherms at T (OD18K) and at T (OD10K) – with data at higher (orange dots) – taken at T (OD18K) and at T (OD10K).
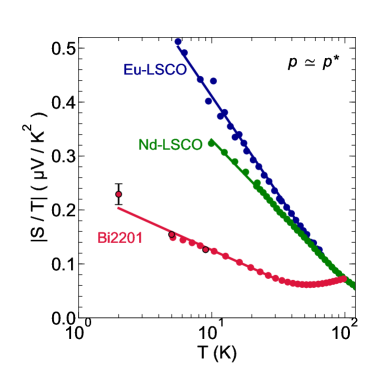
In Fig. 8(a) and (b), we see that remains negative down to the lowest temperature. Strikingly, we observe a strong increase in the magnitude of upon cooling, with nearly doubling between 9 K and 2 K, which suggests a divergence as . In Fig. 8(c) and (d), we see that , from K down to at least 2 K. Such a divergence of the Seebeck coefficient as has been observed in other cuprates. In Fig. 9, we compare our data in Bi2201 (OD10K) to published data in Nd-LSCO with (at T) Daou et al. (2009b) and in Eu-LSCO with (at T) Laliberté et al. (2011). We observe a behaviour in all three over a comparable temperature range.
In Eu-LSCO and Nd-LSCO, a divergence is also observed in the electronic specific heat, , at Michon et al. (2019). This thermodynamic evidence of quantum criticality, combined with the -linear resistivity, suggests that the dependence of the Seebeck coefficient is also a signature of quantum criticality, as found in some theoretical models Paul and Kotliar (2001). Note that in Nd-LSCO and Eu-LSCO the dependence of was observed at , so just above , whereas in our samples of Bi2201, we observe this dependence of at and , just below (Fig. 1). Therefore, if this logarithmic dependence of the Seebeck coefficient is a signature of quantum criticality, it is an unconventional one, reminiscent of the specific heat of Nd-LSCO and Eu-LSCO, in which the dependence of is seen not only at , but also at in Nd-LSCO and in Eu-LSCO, so at as well Michon et al. (2019). We conclude that the observation of a divergence in the Seebeck coefficient of Bi2201 makes a strong case for the universality of this signature, reminiscent of quantum criticality, among hole-doped cuprates at the pseudogap critical point.
VII Thermal Hall conductivity: New signature of the pseudogap phase
A new signature of the pseudogap phase has recently been discovered in Nd-LSCO and Eu-LSCO: a large negative thermal Hall signal appears suddenly as the doping is reduced below , and it is entirely absent above Grissonnanche et al. (2019). The low-temperature trend of this thermal Hall conductivity cannot be explained by the simple motion of charged carriers, since and have opposite signs as 0. This large negative also persists down to , as confirmed in three cuprate Mott insulators – La2CuO4, Nd2CuO4, and Sr2CuO2Cl2 Boulanger et al. (2020). The phenomenon has since been attributed to phonons Grissonnanche et al. (2020a), because an equally large signal was seen for a current along the direction, i.e. , and phonons are the only excitations in cuprates that travel as easily in directions parallel and perpendicular to the CuO2 planes, as shown from the fact that in La2CuO4 at low Hess et al. (2003). But since phonons are not sensitive to magnetic field on their own, they must be coupled to it through some mechanism (here the expression chiral phonons stands for this sensitivity to a magnetic field).
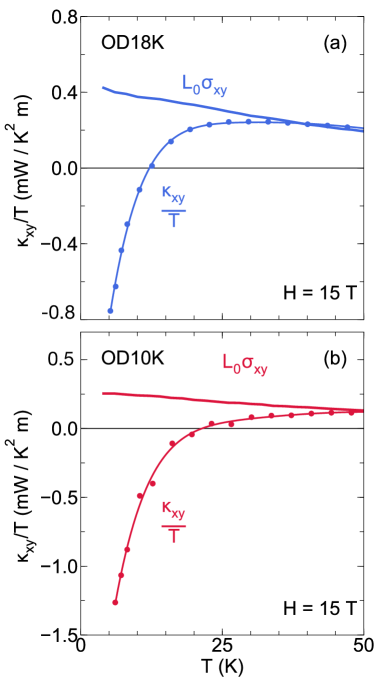
In Fig. 10, we show the thermal Hall conductivity of our two Bi2201 samples, plotted as vs . A very similar qualitative behaviour is observed in both. (Note that our data on OD18K was already reported in ref. Grissonnanche et al., 2019, but not our data on OD10K.) At K, is positive and the thermal and electrical Hall conductivities are equal, i.e. , showing that is entirely coming from the charge carriers that are responsible for the electrical Hall effect and the resistivity. Note that the thermal Hall effect at K provides an independent measurement of how the Hall number changes between OD10K and OD18K, since . We see that at K increases by a factor 1.8, the same factor by which increases (Fig. 5(c)), so that the drop in by a factor 1.8 obtained from electrical measurements (Fig. 6(a)) is confirmed by thermal measurements.
As temperature is reduced, changes sign and becomes increasingly negative as (Fig. 10). By contrast, remains positive and just increases slowly and monotonically as . The negative component of is clearly not due to charge carriers, and phonons are the most likely carriers. The fact that the magnitude of scales with the magnitude of phonon-dominated in the cuprate Mott insulators supports the view that phonons are responsible for the negative Boulanger et al. (2020). At K, the ratio is equal to 0.30% in La2CuO4, 0.37% in Nd2CuO4, and 0.26% in Sr2CuO2Cl2 Boulanger et al. (2020), and the ratio is equal to 0.48% in Nd-LSCO at . In our Bi2201 samples, we estimate the phonon term in the two conductivities as and , and we obtain the ratio % at K and T, for both samples. This ratio is comparable to that found in the other cuprates Boulanger et al. (2020), pointing to a common mechanism. The question is: what property of the pseudogap phase makes phonons become chiral below in hole-doped cuprates?
VIII Summary
We have measured five transport properties of the cuprate material Bi2201 in magnetic fields large enough to suppress superconductivity and reach the normal state in the limit:
the electrical resistivity ,
the electrical Hall coefficient ,
the thermal conductivity ,
the Seebeck coefficient ,
and
the thermal Hall conductivity .
Two dopings just below the pseudogap critical point were investigated,
namely and 0.39 (the absolute values of the hole doping are here estimated from ARPES measurements and do not impact the main conclusions that are drawn from this work, since it is the position of the samples relative to that matters).
For the doping closest to ,
we observe a -linear resistivity down to
K,
with a slope per CuO2 plane that is consistent with Planckian dissipation,
along with a logarithmically diverging Seebeck coefficient, log(1/).
These two properties are typical signatures of quantum criticality.
We also observe a significant drop in the Hall number with decreasing doping, consistent with a rapid loss of carrier density below , concomitant with a drop in the density of states measured by the NMR Knight shift.
The Wiedemann-Franz law is satisfied, confirming that the normal state of the pseudogap phase is metallic.
Finally, the thermal Hall conductivity shows a large negative contribution that we attribute to phonons.
The addition of Bi2201 to the list of cuprate materials in which these properties were already observed,
either in total (Nd-LSCO) or in part (Eu-LSCO, Bi2212, YBCO, Tl2201),
makes a strong case for the universality of the transport signatures of the pseudogap phase in hole-doped cuprates.
IX Acknowledgments
L.T. acknowledges support from the Canadian Institute for Advanced Research (CIFAR) as a CIFAR Fellow and funding from the Natural Sciences and Engineering Research Council of Canada (NSERC; PIN:123817), the Fonds de recherche du Québec – Nature et Technologies (FRQNT), the Canada Foundation for Innovation (CFI), and a Canada Research Chair. C.P. acknowledges support from the EUR grant NanoX n∘ANR-17-EURE-0009 and from the ANR grant NEPTUN n∘ANR-19-CE30-0019-01. This research was undertaken thanks in part to funding from the Canada First Research Excellence Fund. Part of this work was funded by the Gordon and Betty Moore Foundation’s EPiQS Initiative (Grant GBMF5306 to L.T.). Part of this work was performed at the LNCMI, a member of the European Magnetic Field Laboratory.
References
- Keimer et al. (2015) B. Keimer, S. A. Kivelson, M. R. Norman, S. Uchida, and J. Zaanen, Nature 518, 179 (2015).
- Hashimoto et al. (2014) M. Hashimoto, I. M. Vishik, R.-H. He, T. P. Devereaux, and Z.-X. Shen, Nature Physics 10, 483 (2014).
- Loram et al. (1998) J. W. Loram, K. A. Mirza, J. R. Cooper, and J. L. Tallon, Journal of Physics and Chemistry of Solids 59, 2091 (1998).
- Alloul et al. (1989) H. Alloul, T. Ohno, and P. Mendels, Phys. Rev. Lett. 63, 1700 (1989).
- Zheng et al. (2005) G.-q. Zheng, P. L. Kuhns, A. P. Reyes, B. Liang, and C. T. Lin, Phys. Rev. Lett. 94, 047006 (2005).
- Proust and Taillefer (2019) C. Proust and L. Taillefer, Annual Review of Condensed Matter Physics 10, 409 (2019).
- Badoux et al. (2016) S. Badoux, W. Tabis, F. Laliberté, G. Grissonnanche, B. Vignolle, D. Vignolles, J. Béard, D. A. Bonn, W. N. Hardy, R. Liang, N. Doiron-Leyraud, L. Taillefer, and C. Proust, Nature 531, 210 (2016).
- Collignon et al. (2017) C. Collignon, S. Badoux, S. A. A. Afshar, B. Michon, F. Laliberté, O. Cyr-Choinière, J.-S. Zhou, S. Licciardello, S. Wiedmann, N. Doiron-Leyraud, and L. Taillefer, Phys. Rev. B 95, 224517 (2017).
- Taillefer (2010) L. Taillefer, Annual Review of Condensed Matter Physics 1, 51 (2010).
- Martin et al. (1990) S. Martin, A. T. Fiory, R. M. Fleming, L. F. Schneemeyer, and J. V. Waszczak, Phys. Rev. B 41, 846 (1990).
- Daou et al. (2009a) R. Daou, N. Doiron-Leyraud, D. LeBoeuf, S. Y. Li, F. Laliberté, O. Cyr-Choinière, Y. J. Jo, L. Balicas, J.-Q. Yan, J.-S. Zhou, J. B. Goodenough, and L. Taillefer, Nature Physics 5, 31 (2009a).
- Cooper et al. (2009) R. A. Cooper, Y. Wang, B. Vignolle, O. J. Lipscombe, S. M. Hayden, Y. Tanabe, T. Adachi, Y. Koike, M. Nohara, H. Takagi, C. Proust, and N. E. Hussey, Science 323, 603 (2009).
- Legros et al. (2019) A. Legros, S. Benhabib, W. Tabis, F. Laliberté, M. Dion, M. Lizaire, B. Vignolle, D. Vignolles, H. Raffy, Z. Z. Li, P. Auban-Senzier, N. Doiron-Leyraud, P. Fournier, D. Colson, L. Taillefer, and C. Proust, Nature Physics 15, 142 (2019).
- Bruin et al. (2013) J. Bruin, H. Sakai, R. Perry, and A. P. Mackenzie, Science 339, 804 (2013).
- Löhneysen et al. (1994) H. v. Löhneysen, T. Pietrus, G. Portisch, H. G. Schlager, A. Schröder, M. Sieck, and T. Trappmann, Phys. Rev. Lett. 72, 3262 (1994).
- Bianchi et al. (2003) A. Bianchi, R. Movshovich, I. Vekhter, P. G. Pagliuso, and J. L. Sarrao, Phys. Rev. Lett. 91, 257001 (2003).
- Michon et al. (2019) B. Michon, C. Girod, S. Badoux, J. Kacmarcik, Q. Ma, M. Dragomir, H. A. Dabkowska, B. D. Gaulin, J.-S. Zhou, S. Pyon, T. Takayama, H. Takagi, S. Verret, N. Doiron-Leyraud, C. Marcenat, L. Taillefer, and T. Klein, Nature 567, 218 (2019).
- Daou et al. (2009b) R. Daou, O. Cyr-Choinière, F. Laliberté, D. LeBoeuf, N. Doiron-Leyraud, J.-Q. Yan, J.-S. Zhou, J. B. Goodenough, and L. Taillefer, Phys. Rev. B 79, 180505(R) (2009b).
- Laliberté et al. (2011) F. Laliberté, J. Chang, N. Doiron-Leyraud, E. Hassinger, R. Daou, M. Rondeau, B. J. Ramshaw, R. Liang, D. A. Bonn, W. N. Hardy, S. Pyon, T. Takayama, H. Takagi, I. Sheikin, L. Malone, C. Proust, K. Behnia, and L. Taillefer, Nature Communications 2, 432 (2011).
- Michon et al. (2018) B. Michon, A. Ataei, P. Bourgeois-Hope, C. Collignon, S. Y. Li, S. Badoux, A. Gourgout, F. Laliberté, J.-S. Zhou, N. Doiron-Leyraud, and L. Taillefer, Phys. Rev. X 8, 041010 (2018).
- Grissonnanche et al. (2019) G. Grissonnanche, A. Legros, S. Badoux, E. Lefrançois, V. Zatko, M. Lizaire, F. Laliberté, A. Gourgout, J. S. Zhou, S. Pyon, T. Takayama, H. Takagi, S. Ono, N. Doiron-Leyraud, and L. Taillefer, Nature 571, 376 (2019).
- Boulanger et al. (2020) M.-E. Boulanger, G. Grissonnanche, S. Badoux, A. Allaire, É. Lefrançois, A. Legros, A. Gourgout, M. Dion, C. Wang, X. Chen, R. Liang, W. Hardy, D. Bonn, and L. Taillefer, Nature Communications 11, 5325 (2020).
- Grissonnanche et al. (2020a) G. Grissonnanche, S. Thériault, A. Gourgout, M. E. Boulanger, E. Lefrançois, A. Ataei, F. Laliberté, M. Dion, J. S. Zhou, S. Pyon, T. Takayama, H. Takagi, N. Doiron-Leyraud, and L. Taillefer, Nature Physics 16, 1108 (2020a).
- Kawasaki et al. (2010) S. Kawasaki, C. Lin, P. L. Kuhns, A. P. Reyes, and G.-q. Zheng, Phys. Rev. Lett. 105, 137002 (2010).
- (25) M. Ito, S. Kawasaki, and G.-q. Zheng, In preparation.
- Kondo et al. (2004) T. Kondo, T. Takeuchi, T. Yokoya, S. Tsuda, S. Shin, and U. Mizutani, Journal of electron spectroscopy and related phenomena 137, 663 (2004).
- Putzke et al. (2021) C. Putzke, S. Benhabib, W. Tabis, J. Ayres, Z. Wang, L. Malone, S. Licciardello, J. Lu, T. Kondo, T. Takeuchi, N. E. Hussey, J. R. Cooper, and A. Carrington, Nature Physics (2021), online.
- Ono et al. (2000) S. Ono, Y. Ando, T. Murayama, F. F. Balakirev, J. B. Betts, and G. S. Boebinger, Phys. Rev. Lett. 85, 638 (2000).
- Balakirev et al. (2003) F. F. Balakirev, J. B. Betts, A. Migliori, S. Ono, Y. Ando, and G. S. Boebinger, Nature 424, 912 (2003).
- Proust et al. (2005) C. Proust, K. Behnia, R. Bel, D. Maude, and S. I. Vedeneev, Phys. Rev. B 72, 214511 (2005).
- Konstantinovic et al. (2002) Z. Konstantinovic, G. Le Bras, A. Forget, D. Colson, F. Jean, G. Collin, M. Ocio, and C. Ayache, Phys. Rev. B 66, 020503(R) (2002).
- Vedeneev and Maude (2004) S. I. Vedeneev and D. K. Maude, Phys. Rev. B 70, 184524 (2004).
- Fruchter et al. (2007) L. Fruchter, H. Raffy, F. Bouquet, and Z. Z. Li, Phys. Rev. B 75, 092502 (2007).
- Ding et al. (2019) Y. Ding, L. Zhao, H.-T. Yan, Q. Gao, J. Liu, C. Hu, J.-W. Huang, C. Li, Y. Xu, Y.-Q. Cai, H.-T. Rong, D.-S. Wu, C.-Y. Song, H.-X. Zhou, X.-L. Dong, G.-D. Liu, Q.-Y. Wang, S.-J. Zhang, Z.-M. Wang, F.-F. Zhang, F. Yang, Q.-J. Peng, Z.-Y. Xu, C.-T. Chen, and X. J. Zhou, Chinese Physics Letters 36, 017402 (2019).
- Kondo et al. (2011) T. Kondo, Y. Hamaya, A. D. Palczewski, T. Takeuchi, J. S. Wen, Z. J. Xu, G. Gu, J. Schmalian, and A. Kaminski, Nature Physics 7, 21 (2011).
- Peng et al. (2018) Y. Y. Peng, R. Fumagalli, Y. Ding, M. Minola, S. Caprara, D. Betto, M. Bluschke, G. M. De Luca, K. Kummer, E. Lefrançois, M. Salluzzo, H. Suzuki, M. Le Tacon, X. J. Zhou, N. B. Brookes, B. Keimer, L. Braicovich, M. Grilli, and G. Ghiringhelli, Nature Materials 17, 697 (2018).
- Ono and Ando (2003) S. Ono and Y. Ando, Phys. Rev. B 67, 104512 (2003).
- Shakeripour et al. (2009) H. Shakeripour, C. Petrovic, and L. Taillefer, New Journal of Physics 11, 055065 (2009).
- Collignon et al. (2021) C. Collignon, A. Ataei, A. Gourgout, S. Badoux, M. Lizaire, A. Legros, S. Licciardello, S. Wiedmann, J.-Q. Yan, J.-S. Zhou, Q. Ma, B. D. Gaulin, N. Doiron-Leyraud, and L. Taillefer, Phys. Rev. B 103, 155102 (2021).
- Grissonnanche et al. (2016) G. Grissonnanche, F. Laliberté, S. Dufour-Beauséjour, M. Matusiak, S. Badoux, F. F. Tafti, B. Michon, A. Riopel, O. Cyr-Choiniere, J. C. Baglo, B. J. Ramshaw, R. Liang, D. A. Bonn, W. N. Hardy, S. Kramer, D. LeBoeuf, D. Graf, N. Doiron-Leyraud, and L. Taillefer, Phys. Rev. B 93, 064513 (2016).
- Matt et al. (2015) C. E. Matt, C. G. Fatuzzo, Y. Sassa, M. Månsson, S. Fatale, V. Bitetta, X. Shi, S. Pailhès, M. H. Berntsen, T. Kurosawa, M. Oda, N. Momono, O. J. Lipscombe, S. M. Hayden, J.-Q. Yan, J.-S. Zhou, J. B. Goodenough, S. Pyon, T. Takayama, H. Takagi, L. Patthey, A. Bendounan, E. Razzoli, M. Shi, N. C. Plumb, M. Radovic, M. Grioni, J. Mesot, O. Tjernberg, and J. Chang, Phys. Rev. B 92, 134524 (2015).
- Boebinger et al. (1996) G. S. Boebinger, Y. Ando, A. Passner, T. Kimura, M. Okuya, J. Shimoyama, K. Kishio, K. Tamasaku, N. Ichikawa, and S. Uchida, Phys. Rev. Lett. 77, 5417 (1996).
- Laliberté et al. (2016) F. Laliberté, W. Tabis, S. Badoux, B. Vignolle, D. Destraz, N. Momono, T. Kurosawa, K. Yamada, H. Takagi, N. Doiron-Leyraud, C. Proust, and L. Taillefer, arXiv:1606.04491 (2016).
- Ando et al. (2004) Y. Ando, S. Komiya, K. Segawa, S. Ono, and Y. Kurita, Phys. Rev. Lett. 93, 267001 (2004).
- Yoshida et al. (2009) T. Yoshida, M. Hashimoto, S. Ideta, A. Fujimori, K. Tanaka, N. Mannella, Z. Hussain, Z.-X. Shen, M. Kubota, K. Ono, S. Komiya, Y. Ando, H. Eisaki, and S. Uchida, Phys. Rev. Lett. 103, 037004 (2009).
- Cyr-Choinière et al. (2018) O. Cyr-Choinière, R. Daou, F. Laliberté, C. Collignon, S. Badoux, D. LeBoeuf, J. Chang, B. J. Ramshaw, D. A. Bonn, W. N. Hardy, R. Liang, J.-Q. Yan, J.-G. Cheng, J.-S. Zhou, J. B. Goodenough, S. Pyon, T. Takayama, H. Takagi, N. Doiron-Leyraud, and L. Taillefer, Phys. Rev. B 97, 064502 (2018).
- Frachet et al. (2020) M. Frachet, I. Vinograd, R. Zhou, S. Benhabib, S. Wu, H. Mayaffre, S. Krämer, S. K. Ramakrishna, A. P. Reyes, J. Debray, T. Kurosawa, N. Momono, M. Oda, S. Komiya, S. Ono, M. Horio, J. Chang, C. Proust, D. LeBoeuf, and M.-H. Julien, Nature Physics 16, 1064 (2020).
- Bourgeois-Hope et al. (2019) P. Bourgeois-Hope, S. Li, F. Laliberté, S. Badoux, S. Hayden, N. Momono, T. Kurosawa, K. Yamada, H. Takagi, N. Doiron-Leyraud, and L. Taillefer, arXiv:1910.08126 (2019).
- Adachi et al. (2011) T. Adachi, Y. Tanabe, K. Suzuki, Y. Koike, T. Suzuki, T. Kawamata, and I. Watanabe, Phys. Rev. B 83, 184522 (2011).
- Kurashima et al. (2018) K. Kurashima, T. Adachi, K. M. Suzuki, Y. Fukunaga, T. Kawamata, T. Noji, H. Miyasaka, I. Watanabe, M. Miyazaki, A. Koda, R. Kadono, and Y. Koike, Phys. Rev. Lett. 121, 057002 (2018).
- Ikuta et al. (2003) H. Ikuta, M. Matsuura, and T. Biwa, Physica C: Superconductivity 388, 361 (2003).
- Girod et al. (2021) C. Girod, D. LeBoeuf, A. Demuer, G. Seyfarth, S. Imajo, K. Kindo, Y. Kohama, M. Lizaire, A. Legros, A. Gourgout, H. Takagi, T. Kurosawa, M. Oda, N. Momono, J. Chang, S. Ono, G.-q. Zheng, C. Marcenat, L. Taillefer, and T. Klein, arXiv:2101.09221 (2021).
- Grissonnanche et al. (2020b) G. Grissonnanche, Y. Fang, A. Legros, S. Verret, F. Laliberté, C. Collignon, J. Zhou, D. Graf, P. Goddard, L. Taillefer, and B. J. Ramshaw, arXiv:2011.13054 (2020b).
- Tallon and Loram (2001) J. L. Tallon and J. Loram, Physica C: Superconductivity 349, 53 (2001).
- Verret et al. (2017) S. Verret, O. Simard, M. Charlebois, D. Sénéchal, and A. M. S. Tremblay, Phys. Rev. B 96, 125139 (2017).
- Fang et al. (2020) Y. Fang, G. Grissonnanche, A. Legros, S. Verret, F. Laliberte, C. Collignon, A. Ataei, M. Dion, J. Zhou, D. Graf, M. J. Lawler, P. Goddard, L. Taillefer, and B. J. Ramshaw, arXiv:2004.01725 (2020).
- Storey (2016) J. G. Storey, Europhysics Letters 113, 27003 (2016).
- Kunisada et al. (2020) S. Kunisada, S. Isono, Y. Kohama, S. Sakai, C. Bareille, S. Sakuragi, R. Noguchi, K. Kurokawa, K. Kuroda, Y. Ishida, S. Adachi, R. Sekine, T. K. Kim, C. Cacho, S. Shin, T. Tohyama, K. Tokiwa, and T. Kondo, Science 369, 833 (2020).
- Caprara et al. (2017) S. Caprara, C. Di Castro, G. Seibold, and M. Grilli, Phys. Rev. B 95, 224511 (2017).
- Maharaj et al. (2017) A. V. Maharaj, I. Esterlis, Y. Zhang, B. J. Ramshaw, and S. A. Kivelson, Phys. Rev. B 96, 045132 (2017).
- Hawthorn et al. (2007) D. G. Hawthorn, S. Y. Li, M. Sutherland, E. Boaknin, R. W. Hill, C. Proust, F. Ronning, M. A. Tanatar, J. Paglione, L. Taillefer, D. Peets, R. Liang, D. A. Bonn, W. N. Hardy, and N. N. Kolesnikov, Phys. Rev. B 75, 104518 (2007).
- Proust et al. (2002) C. Proust, E. Boaknin, R. W. Hill, L. Taillefer, and A. P. Mackenzie, Phys. Rev. Lett. 89, 147003 (2002).
- Kondo et al. (2005) T. Kondo, T. Takeuchi, U. Mizutani, T. Yokoya, S. Tsuda, and S. Shin, Phys. Rev. B 72, 024533 (2005).
- Sakamoto et al. (2016) H. Sakamoto, K. Ogawa, T. Kondo, S. Shin, M. Matsunami, H. Ikuta, and T. Takeuchi, Journal of the Physical Society of Japan 85, 104710 (2016).
- Paul and Kotliar (2001) I. Paul and G. Kotliar, Phys. Rev. B 64, 184414 (2001).
- Hess et al. (2003) C. Hess, B. Büchner, U. Ammerahl, L. Colonescu, F. Heidrich-Meisner, W. Brenig, and A. Revcolevschi, Phys. Rev. Lett. 90, 197002 (2003).