Cracking urban mobility
Abstract
Assessing the resilience of a road network is instrumental to improve existing infrastructures and design new ones. Here we apply the optimal path crack model (OPC) to investigate the mobility of road networks and propose a new proxy for resilience of urban mobility. In contrast to static approaches, the OPC accounts for the dynamics of rerouting as a response to traffic jams. Precisely, one simulates a sequence of failures (cracks) at the most vulnerable segments of the optimal origin-destination paths that are capable to collapse the system. Our results with synthetic and real road networks reveal that their levels of disorder, fractions of unidirectional segments and spatial correlations can drastically affect the vulnerability to traffic congestion. By applying the OPC to downtown Boston and Manhattan, we found that Boston is significantly more vulnerable than Manhattan. This is compatible with the fact that Boston heads the list of American metropolitan areas with the highest average time waste in traffic. Moreover, our analysis discloses that the origin of this difference comes from the intrinsic spatial correlations of each road network. Finally, we argue that, due to their global influence, the most important cracks identified with OPC can be used to pinpoint potential small rerouting and structural changes in road networks that are capable to substantially improve urban mobility.
I Introduction
Traffic congestion is part of the daily life in a metropolitan region. In the top 20 cities in the US, it is estimated that the average daily commuter wastes more than 85 hours/year in traffic congestion Reed and Kidd (2018). Boston heads this list with a 160+ hours/year average delay. The numbers are even worst in cities like Moscow, London, Bogota, or Mexico City, where the average time wasted per year exceeds 200 hours. This inefficiency not only impacts on life quality and the environment, but it also compromises economic growth. A recent study using data from 88 US metropolitan areas suggests that a seemingly harmless average delay of 4.5 minutes for each one-way auto commute in a city is enough to slow down job growth Sweet (2014).
To proper assess urban mobility, one needs to account for the impact of road congestion in global traffic Louf and Barthelemy (2014); Colak et al. (2016); Solé-Ribalta et al. (2018); Barbosa et al. (2018); Barthelemy (2019). Li et al. Li et al. (2015) proposed to apply Percolation Theory to evaluate how global connectivity is lost when vulnerable roads are congested. Their static analysis for different hours of the day gives insight into normal and rush-hour traffic and helped identifying vulnerable roads González et al. (2008); Colak et al. (2016); Olmos et al. (2018); Zeng et al. (2019). However, in reality, users are actively evaluating their routes and taking alternative paths to avoid traffic jams Zhu and Levinson (2015); Lima et al. (2016); Zhang et al. (2019). Thus, the probability that a road gets congested depends, not only on its average level of traffic, but also on the likelihood that users take it in their route Wang et al. (2012); Guo et al. (2019).

Without central planning, travellers usually choose the route that minimizes their travelling time. However, when a road segment gets congested, a new optimal route needs to be found. The optimal path crack model (OPC) was introduced as a general framework to study the resilience of a network infrastructure to a sequence of optimal path failures Andrade et al. (2009); Oliveira et al. (2011). The OPC is described as follows. Let us consider a square lattice of size with periodic boundary conditions in the horizontal direction and fixed boundary conditions at the top and bottom. To each link, a travelling time is randomly assigned according to a given probability distribution , with . Using Dijkstra’s algorithm Dijkstra (1959), the first optimal path is identified which minimizes the total travelling time between the bottom and the top of the lattice. We then search and remove the most vulnerable link along this path, defined as the one with the highest travelling time. The next optimal path is identified, which cannot contain the removed link, and its vulnerable link is also removed. We proceed iteratively until the lattice is disrupted and no more paths can be found. The OPC is then the set of all removed links. In the limit of strong disorder, all cracks are located on a single self-similar connected line of fractal dimension equal to Andrade et al. (2009). As a matter of fact, this exponent value is statistically identical to the fractal dimension previously found for the optimal path line under strong disorder Cieplak et al. (1994, 1996); Porto et al. (1997, 1999), “strands” in Invasion Percolation Cieplak et al. (1994, 1996), paths on Minimum Spanning Trees Dobrin and Duxbury (2001), and watersheds on uncorrelated landscapes Oliveira et al. (2011); Schrenk et al. (2012). In the case of weak disorder, the cracks spread all over the entire network before global connectivity is lost, so that the total number of removed links scales as , where is the topological dimension of the lattice Andrade et al. (2009).
So far, all studies on OPC considered non-directed networks. However, road networks always have a non-negligible fraction of one-way roads, which is expected to substantially affect the traffic dynamics Schwartz et al. (2002); Buzna et al. (2006); Sánchez et al. (2002). In addition, by contrast to previous static approaches, the fact that OPC accounts for the dynamics of rerouting as a response to traffic jams suggests that this model may be a better proxy for resilience of urban mobility. It is under this framework that here we investigate the behavior of OPC when applied to synthetic and real road networks. This paper is organized as follows. In Section II, we study the role of disorder and unidirectionality on the OPC model applied to synthetic road networks. In Section III, the OPC is applied to the real road networks of Manhattan and downtown Boston. In Section IV, we present the conclusions of our study.
II Role of disorder and unidirectionality on OPC
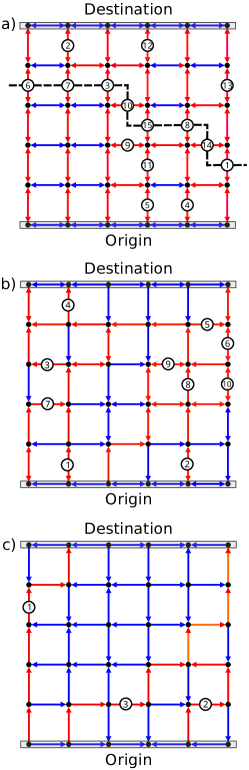
In order to better understand the combined role of disorder and unidirectionality on the OPC, we applied the model to synthetic road networks in which the links are assigned to be unidirectional with probability and bidirectional with probability . For we recover the OPC of a fully bidirectional lattice, while for all links are unidirectional. Disorder is introduced by assigning the travelling times of unidirectional links according to a hyperbolic distribution , truncated between and , where is the parameter that controls the disorder. Typical realizations of the OPC model for small networks generated with weak disorder are shown in Fig. 1. Note that each bidirectional link in the network has distinct travelling times associated to its two directions. As previously observed Andrade et al. (2009), the set of OPC cracks generated in fully bidirectional networks () always contains a contiguous subset that spans the entire system from left to right, regardless of the level of disorder. In the presence of any amount of unidirectional links (), however, the cracks do not necessarily form a contiguous fracture that divides the network into two pieces. Moreover, the larger the value of , rarer is the occurrence of this spanning fracture. When the unidirectional links are assigned independently at random, there is always global connectivity (percolation), but sink nodes and closed loops are formed de Noronha et al. (2018). The links belonging to such closed loop will never be part of a shortest path and thus the fracture does not need to be contiguous, as they also contribute to separate the lattice into two pieces.
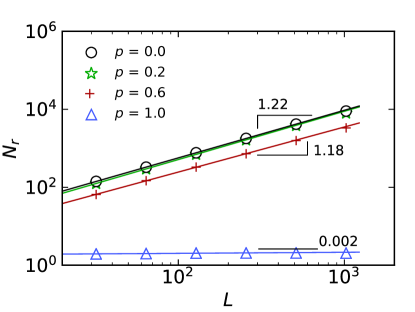
Figure 2 shows the logarithmic dependence of the number of removed links on the linear size of the lattice , for lattices with sizes varying in the range and weak disorder in their distribution of travelling times (). For , the numerical results are consistent with , where . Thus, provided that a non-zero fraction of links is bidirectional, the set of all removed links is compact, as reported for networks with only bidirectional links () Andrade et al. (2009). Nevertheless, the fraction of removed links is a monotonic decreasing function of , meaning that the prefactor of the power-law relation decreases too (see Fig. 2). Surprisingly, in the limit case of a completely unidirectional lattice, , we find that , with . Our result therefore indicates that the OPC set at this point belongs to a different universality class. Moreover, since , the fraction of removed links for an infinite lattice (thermodynamic limit) is zero for .
The statistics of the OPC set generated under weak disorder suggests that its dimension does crossover from , for , to at . This crossover is analogous to what is observed at the theta point of polymer systems de Gennes (1979); Chang and Aharony (1991); Poole et al. (1989). At high temperatures, the configurations of a polymer chain are well described by a self-avoiding random walk, as the only relevant interactions are excluded volume. However, at the theta-temperature, the attractive forces are no longer negligible, and the statistics are then different. Also, in ranked surfaces, when occupying links sequentially, but suppressing global connectivity, the fractal dimension of the set of links that are not occupied due to this constraint changes from at the percolation threshold to above it Schrenk et al. (2012). For the case of OPC, we consider the following crossover Ansatz:
| (1) |
where is the crossover exponent, for and equal to a nonzero constant at . The inset in Fig. 2 shows the data collapse obtained with this tricritical scaling for different lattice sizes and values of , with . By fitting the power-law regime of the scaling function , we estimate . From the Ansatz, we expect that,
| (2) |
what is verified, within error bars. This behavior confirms that the universality class of OPC is robust and only breaks down for a fully unidirectional lattice ().
For the case of local travelling times with strong disorder, (see Fig. 3), the OPC results for are also consistent with the behavior previously observed for fully bidirectional networks (), namely, Andrade et al. (2009). As in the weak disorder case, it is only for that the finite-size scaling of the system becomes noticeably different, with . A rather small number of removed links is therefore sufficient to block a fully directed lattice subjected to strong disorder. Summing up, our analysis with synthetic road networks shows that the higher the fraction of unidirectional segments and the level of disorder are, the lower is the resilience for urban mobility.


III OPC for real road networks
Next, we show that the OPC can be effectively used as a proxy for urban mobility. In general, the fraction of one-way roads changes from city to city. Here we apply the OPC method to two metropolitan areas in US, namely, Manhattan and downtown Boston, the latter being the top one in the rank of North America for average time waste in traffic Reed and Kidd (2018). For this purpose, we obtained the road network structures of both urban areas from OpenStreetMap OpenStreetMap contributors (2019). Their corresponding average travelling times per road were downloaded from Directions API Google Google (2019), specifically for November 21th of 2018 at 4:00 am. This off-peak data set has been chosen because, by construction, the travelling times should somehow reflect the freeway-state of the streets and avenues constituting a given urban mobility system. In order to assess the efficiency of these road networks to urban traffic, the OPC is numerically calculated for different pairs of origin-destination (OD) sites. Precisely, for each OPC realization, one site of the network is selected at random to be the center of a circle of radius . A point on this circle is then randomly chosen and the closest road sites to the center and to this point are taken as the origin and destination, respectively, only if the distance between them is equal to within a tolerance of . Here, due to the fact that road segments composing the urban networks have different travelling times as well as lengths , an optimal path is identified among all possible paths during the OPC process as the one with the minimum sum of over all its road segments.
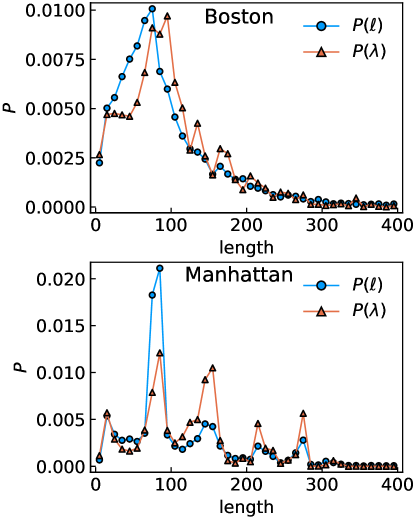
OPC simulations have then been performed with OD realizations for Boston and Manhattan. A typical realization of the OPC for downtown Boston is shown in Fig. 4. One should note that the bidirectional links (two-way streets and avenues) are in fact composed of two unidirectional ones of contrary directions that can be removed independently during the OPC process. In Fig. 5, we show how the average number of removed sites varies with the distance for both urban areas. The smaller is, less resilient is the road network. These results indicate that Boston is systematically much more vulnerable than Manhattan, regardless of the origin-destination distance , what is consistent with their relative positions in the national rank of urban mobility. Moreover, the same behavior can be observed if, instead of , we quantify the result of each OPC process in terms of the sum , where is equal to the length of the removed road segment at iteration . Interestingly, as shown in the inset of Fig. 5, these two measures are, in fact, linearly related , with and for Boston and Manhattan, respectively. For all practical purposes, this indicates the absence of spatial statistical correlations in the OPC process of selecting from the distribution of segment lengths of both road networks. As shown in Fig. 6, the distributions and for a given road network display similar qualitative features in shape. More important, these results for Boston and Manhattan indicate that the variable is selected by the OPC process over the entire range of values. One should note that, although the OPC process tends to pick larger values of from more frequently, this does not imply the presence of statistical correlations among links in the road networks. Such a behavior clearly reflects a local feature of the network that is captured by the OPC but cannot explain the substantial differences in the resilience of Boston and Manhattan, since the OPC results for both road networks follow the same tendency.
We now investigate the origin of the substantial difference between the resilience of Boston and Manhattan. Figure 7 shows the distributions of travelling time per segment length obtained for their corresponding road networks. Clearly, the disorder is weak in both cases and the modest difference between them is not compatible with the large discrepancy observed in their resilience. Furthermore, the fraction of unidirectional links found for downtown Boston is , while the value for Manhattan is . However, our results from synthetic road networks indicate that, for similar levels of disorder, the resilience of the system should decrease with the value of . As a consequence, the observed difference in the resilience of Boston and Manhattan also cannot stem from their distinct values. One therefore can only rely on the particular features of the intrinsic spatial correlations that should be present in these urban systems to justify their very distinct responses. In order to test for this hypothesis, we performed additional OPC simulations preserving the geometry of both networks, but shuffling the values of among randomly chosen pairs of road segments. The results presented in Fig. 5 are rather surprising and twofold. First, they show that the effect of suppressing the spatial correlations is to practically collapse the curves against of both cities to a single curve, therefore demonstrating the generality and comparative power of the OPC method for urban mobility. Second, the fact that the values of systematically increase for Boston and decrease for Manhattan, as compared to the results using the real (non-shuffled) data sets, corroborates the ability of our approach to properly capture negative and positive effects of spatial correlations on urban mobility.
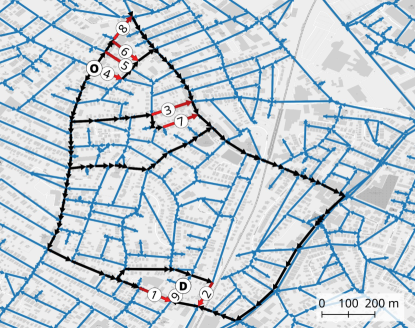
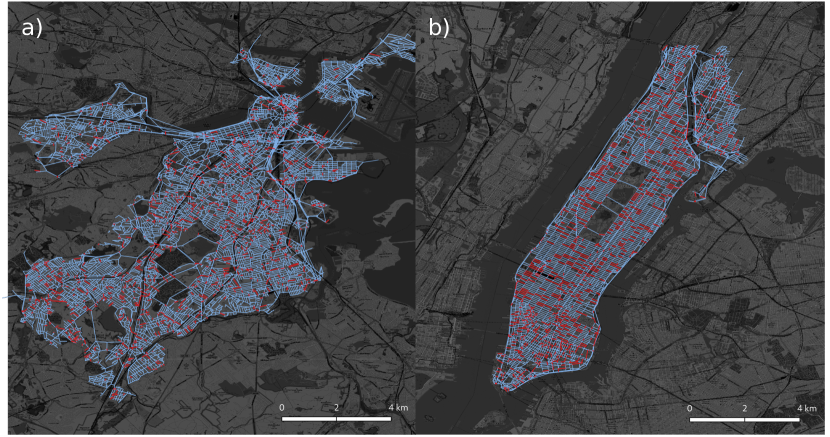
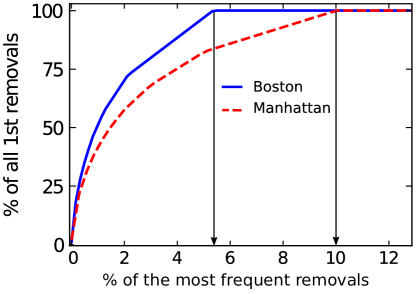
One question that naturally arises is how the OPC method can be used to enhance urban mobility. A possible answer is to prioritize rerouting and structural improvements based on the identification of those road segments that are more frequently appearing among the first removals in all OPC sequences. In Fig. 8 are the road maps for the two urban areas, where the highlighted road segments (thick and red) correspond to all those removed first, considering all OPC samples performed with OD distances m. For downtown Boston (see Fig. 8a), we find that only a percentage of of all road segments is removed, while is the value for Manhattan (see Fig. 8b). The cumulative dependence of the percentage of all first removals on the percentage of the most frequent ones is shown in Fig. 9. These results suggest that, as compared to Manhattan, a relatively small number of potential local changes in Boston might be very efficient in improving urban mobility. The fact that Manhattan is much more resilient should therefore increase the costs of improvements.
IV Conclusions
In summary, we proposed a proxy for resilience of urban mobility based on OPC. Our results with synthetic and real road networks suggest that their vulnerability to traffic congestion are strongly dependent on the level of disorder, fraction of unidirectional segments and intrinsic spatial correlations. These observations have practical implications in the design and restructuring for improved urban mobility. With OPC, we obtain the list of most vulnerable links, defined as the ones with the highest travelling time along the sequence of shortest origin-destination paths. The vulnerability of such a link might stem from many design factors, such as, the capacity of the road, speed limit, number of crossroads or traffic-light dynamics. We conclude that OPC is a general and powerful method to access urban mobility, and gives practical insight that can effectively help identifying and mitigating vulnerabilities of real road networks.
Acknowledgements.
We gratefully acknowledge financial support from the Brazilian agencies CNPq, CAPES and FUNCAP, the National Institute of Science and Technology for Complex Systems in Brazil, and from the Portuguese Foundation for Science and Technology (FCT) under Contracts no. UIDB/00618/2020 and UIDP/00618/2020.References
- Reed and Kidd (2018) T. Reed and J. Kidd, Tech. Rep., IRIX Research, United States (2018).
- Sweet (2014) M. Sweet, Urban Studies 51, 2088 (2014).
- Louf and Barthelemy (2014) R. Louf and M. Barthelemy, Sci. Rep. 4, 1 (2014).
- Colak et al. (2016) S. Colak, A. Lima, and M. C. González, Nat. Commun. 7, 10793 (2016).
- Solé-Ribalta et al. (2018) A. Solé-Ribalta, S. Gómez, and A. Arenas, Networks Spat. Econ. 18, 33 (2018).
- Barbosa et al. (2018) H. Barbosa, M. Barthelemy, G. Ghoshal, C. R. James, M. Lenormand, T. Louail, R. Menezes, J. J. Ramasco, F. Simini, and M. Tomasini, Phys. Rep. 734, 1 (2018).
- Barthelemy (2019) M. Barthelemy, Nature Reviews Physics 1, 406 (2019).
- Li et al. (2015) D. Li, B. Fu, Y. Wang, G. Lu, Y. Berezin, H. E. Stanley, and S. Havlin, Proc. Natl. Acad. Sci. U. S. A. 112, 669 (2015).
- González et al. (2008) M. C. González, C. A. Hidalgo, and A.-L. Barabási, Nature 453, 779 (2008).
- Olmos et al. (2018) L. E. Olmos, S. Çolak, S. Shafiei, M. Saberi, and M. C. González, Proc. Natl. Acad. Sci. U. S. A. 115, 12654 (2018).
- Zeng et al. (2019) G. Zeng, D. Li, S. Guo, L. Gao, Z. Gao, H. Eugene Stanley, and S. Havlin, Proc. Natl. Acad. Sci. U. S. A. 116, 23 (2019).
- Zhu and Levinson (2015) S. Zhu and D. Levinson, PLoS One 10, e0134322 (2015).
- Lima et al. (2016) A. Lima, R. Stanojevic, D. Papagiannaki, P. Rodriguez, and M. C. Gonzalez, J. R. Soc. Interface 13 (2016).
- Zhang et al. (2019) L. Zhang, G. Zeng, D. Li, H. J. Huang, H. Eugene Stanley, and S. Havlin, Proc. Natl. Acad. Sci. U. S. A. 116, 8673 (2019).
- Wang et al. (2012) P. Wang, T. Hunter, A. M. Bayen, K. Schechtner, and M. C. González, Sci. Rep. 2, 1001 (2012).
- Guo et al. (2019) S. Guo, D. Zhou, J. Fan, Q. Tong, T. Zhu, W. Lv, D. Li, and S. Havlin, EPJ Data Sci. 8, 28 (2019).
- Andrade et al. (2009) J. S. Andrade, E. A. Oliveira, A. A. Moreira, and H. J. Herrmann, Phys. Rev. Lett. 103, 225503 (2009).
- Oliveira et al. (2011) E. A. Oliveira, K. J. Schrenk, N. A. M. Araújo, H. J. Herrmann, and J. S. Andrade, Phys. Rev. E 83, 046113 (2011).
- Dijkstra (1959) E. W. Dijkstra, Numer. Math. 1, 269 (1959).
- Cieplak et al. (1994) M. Cieplak, A. Maritan, and J. R. Banavar, Phys. Rev. Lett. 72, 2320 (1994), ISSN 00319007.
- Cieplak et al. (1996) M. Cieplak, A. Maritan, and J. R. Banavar, Phys. Rev. Lett. 76, 3754 (1996), ISSN 10797114.
- Porto et al. (1997) M. Porto, S. Havlin, S. Schwarzer, and A. Bunde, Phys. Rev. Lett. 79, 4060 (1997).
- Porto et al. (1999) M. Porto, N. Schwartz, S. Havlin, and A. Bunde, Phys. Rev. E 60, R2448 (1999).
- Dobrin and Duxbury (2001) R. Dobrin and P. M. Duxbury, Phys. Rev. Lett. 86, 5076 (2001), ISSN 00319007.
- Schrenk et al. (2012) K. J. Schrenk, N. A. M. Araújo, J. S. Andrade, and H. J. Herrmann, Sci. Rep. 2, 348 (2012).
- Schwartz et al. (2002) N. Schwartz, R. Cohen, D. ben-Avraham, A.-L. Barabási, and S. Havlin, Phys. Rev. E 66, 015104(R) (2002).
- Buzna et al. (2006) L. Buzna, K. Peters, and D. Helbing, Physica A 363, 132 (2006).
- Sánchez et al. (2002) A. D. Sánchez, J. M. López, and M. A. Rodríguez, Phys. Rev. Lett. 88, 048701 (2002).
- de Noronha et al. (2018) A. W. T. de Noronha, A. A. Moreira, A. P. Vieira, H. J. Herrmann, J. S. Andrade, and H. A. Carmona, Phys. Rev. E 98, 062116 (2018).
- de Gennes (1979) P.-G. de Gennes, Scaling concepts in polymer physics (Cornell University Press, Ithaca, New York, 1979).
- Chang and Aharony (1991) I. Chang and A. Aharony, J. Phys. I 1, 313 (1991).
- Poole et al. (1989) P. H. Poole, A. Coniglio, N. Jan, and H. E. Stanley, Phys. Rev. B 39, 495 (1989).
- OpenStreetMap contributors (2019) OpenStreetMap contributors, Planet dump retrieved from https://planet.osm.org, https://www.openstreetmap.org (2019).
- Google (2019) Google, Google Directions API, https://developers.google.com/maps/documentation/directions/start (2019).