acmlicensed
\isbn978-1-4503-6708-0/20/04
\acmPrice$15.00
\toappearPermission to make digital or hard copies of all or part of this work for personal or classroom use is granted without fee provided that copies are not made or distributed for profit or commercial advantage and that copies bear this notice and the full citation on the first page. Copyrights for components of this work owned by others than the author(s) must be honored. Abstracting with credit is permitted. To copy otherwise, or republish, to post on servers or to redistribute to lists, requires prior specific permission and/or a fee. Request permissions from permissions@acm.org.
CHI ’20, April 25–30, 2020, Honolulu, HI, USA.
© 2020 Copyright is held by the owner/author(s). Publication rights licensed to ACM.
ACM ISBN 978-1-4503-6708-0/20/04 …$15.00.
http://dx.doi.org/10.1145/3313831.3376399
Urban Mosaic: Visual Exploration of
Streetscapes Using Large-Scale Image Data
Abstract
Urban planning is increasingly data driven, yet the challenge of designing with data at a city scale and remaining sensitive to the impact at a human scale is as important today as it was for Jane Jacobs. We address this challenge with Urban Mosaic, a tool for exploring the urban fabric through a spatially and temporally dense data set of 7.7 million street-level images from New York City, captured over the period of a year. Working in collaboration with professional practitioners, we use Urban Mosaic to investigate questions of accessibility and mobility, and preservation and retrofitting. In doing so, we demonstrate how tools such as this might provide a bridge between the city and the street, by supporting activities such as visual comparison of geographically distant neighborhoods, and temporal analysis of unfolding urban development.
doi:
https://doi.org/10.1145/3313831.3376399keywords:
Urban planning; Interactive visualization; Data analysis; Urban data<ccs2012> <concept> <concept_id>10003120.10003121</concept_id> <concept_desc>Human-centered computing Human computer interaction (HCI)</concept_desc> <concept_significance>500</concept_significance> </concept> <concept> <concept_id>10003120.10003145.10003147.10010365</concept_id> <concept_desc>Human-centered computing Visual analytics</concept_desc> <concept_significance>300</concept_significance> </concept> <concept> <concept_id>10003120.10003145.10003151.10011771</concept_id> <concept_desc>Human-centered computing Visualization toolkits</concept_desc> <concept_significance>300</concept_significance> </concept> </ccs2012>
[500]Human-centered computing Human computer interaction (HCI) \ccsdesc[300]Human-centered computing Visual analytics \ccsdesc[300]Human-centered computing Visualization toolkits
"A sense of place is built up, in the end, from many little things too, some so small people take them for granted, and yet the lack of them takes the flavor out of the city."
(Jane Jacobs, Downtown is for People)
1 Introduction
For those of us living in or visiting the world’s major cities, their dynamism and complexity are immediately apparent. Yet urban planners and designers must work in a context where any single intervention, perhaps aimed at altering just one aspect, can have a wide ranging impact on a variety of interrelated components [13], affecting things at both a macro city scale and a micro human scale. Examples of changes at a city scale include, suburbanization, economic deconcentration, modification to transport infrastructure, rezoning and/or gentrification of neighborhoods, and major renewal projects. Examples of changes at a human scale, on the other hand, are reflected in the city’s urban fabric, and include aspects that make a city livable, encourage walking, and contribute to the perception of safety; in other words affect the day to day lives of its inhabitants. This might be manifested in lighting, shadow, sky exposure, open-front shops, the details of building facades, etc. [33].
Responding to these challenges at the city scale, planners and designers have been aided by a rapid growth in data from urban environments, and so are able to turn to computational methods and large-scale data analysis, which increase understanding by quantifying different aspects of the city (e.g., [37, 14, 15, 30, 71, 68, 49]). However, while sensitivity to the impact of change at a human scale remains as important today as it was for Jane Jacobs and others in the 1950s and 1960s [48], analyses of suitable data, which emphasize qualitative, visual details, are often difficult and time-consuming to perform. Although there is an increasing availability of street-view images, which support a degree of virtual assessment and auditing of the built environment, their distribution is often temporally sparse and so analysis is limited.
This paper introduces Urban Mosaic, a tool for visually exploring the urban fabric. It responds to the challenges practitioners face by employing a newly available spatially and temporally dense data set of street-level images from New York City (NYC) Urban Mosaic is a visual exploration system designed to help practitioners in urban planning and design gain insight into the human scale impact of changes in the urban fabric. It utilizes state-of-the-art computer vision techniques for image similarity search and clustering, together with efficient spatio-temporal selection and aggregation over the image metadata to visually explore and map this image data set. It further allows the analysis to be augmented using spatio-temporal urban data from a variety of other sources (e.g., census, transport, crime, weather, housing market, zoning, noise complaints). The image data set used in this work contains 7.7 million images captured in the Manhattan and Brooklyn boroughs between April 2016 and April 2017 using car-mounted cameras. Urban Mosaic has been developed as a collaboration between researchers in urban planning, visual analytics, and HCI. We include a detailed description of system features as a way to offer necessary background to our approach. In order to better understand the needs and potential use cases of practitioners, we undertook a requirements gathering process that included: representatives of Kohn Pedersen Fox (KPF), a major architectural practice specializing in data-driven urban design and urban data analytics; Draw Brooklyn, a practice run by the former Chief Urban Designer of NYC; and an occupational therapist specializing in urban accessibility for older people. We refer to our interactions with these practitioners, which include formative evaluation sessions, throughout the paper to offer the perspective of potential future users.
Contributions. The work reported in this paper has both practical and theoretical implications, and contributes to HCI knowledge in two ways. From a theoretical perspective, we demonstrate the potential for images from large-scale street-view data sets to help bridge data-driven urban planning and design at the city scale and at the human scale. From a practical perspective, we present a tool that enables professionals to combine quantitative spatio-temporal urban data sets with qualitative spatio-temporal data sets of urban images, and use these to solve the real problems they identified.
2 Background
The built environment’s impact on public health, social well-being and quality of life has been demonstrated with regard to levels of physical activity [32, 89], social inclusion [84, 18], social capital [75], willingness to walk [44], perceptions of safety [7], pedestrian fatalities [74], impact on pedestrians with special needs [29], and risk of cardiovascular or respiratory diseases [78, 25]. Features such as wide sidewalks, greenery, townhouse stoops, street-level activity, and ground floor properties with detail and windows, all contribute to a vibrant street life that attracts more people to public spaces and increases safety. This was Jane Jacobs’ now famous “eyes on the streets” theory [41], which has greatly influenced our understanding of how the built environment at a human scale affects crime [42, 63] and perceptions of safety [7]. Safety from accidents, such as tripping or falling, caused by potholes, obstructions, bad lighting, and slippery surfaces (due either to weather conditions or surface material), is also a key concern, particularly for older adults, pregnant women and people with disabilities [2]. Analysis of the built environment’s impact on these public health and quality of life issues typically involves time-consuming and costly in-field auditing, which requires trained auditors to be present at the site in question to make assessments and record their observations based on auditing protocols [19, 39, 23, 57].
While a rapid growth in urban data gathering has resulted in the development of new tools and practices that offer urban planners and designers significant opportunities and benefits at the city scale (e.g., [37, 14, 30, 71, 73]), there have been far fewer such developments at the human scale. Efforts to quantify and assess the visual appearance of the built environment have typically been limited in terms of the number and area of locations that can be covered, since they mainly rely on in-field data collection and assessment procedures [76, 69]. Recently however, the advent of new computer vision algorithms has made it possible to use image data to measure the characteristics of the built environment [34, 60], and the introduction of Google Street View (GSV) [5] and Microsoft Streetside [46], which provide free panoramic images captured by specifically designed vehicle-mounted cameras, has offered new data sources. This has enabled researchers to tackle questions in urban planning, urban design, urban sociology, criminology and public health from a new perspective [6, 26, 60, 61]. GSV in particular has made virtual auditing possible [76, 11, 10, 45, 22], expanding and diversifying geographical coverage, and reducing time and labor requirements. However, while trained experts can now use GSV in assessments, they must manually explore whole collections of images to identify features of interest [34]. An additional layer of difficulty is added when satisfaction criteria are based on external data; for example, identifying pavements that might pose a danger to pedestrians only under certain weather conditions, or assessing the impact of construction projects. GSV now includes a timeline feature which allows users to view temporal change. However, data are often very sparse in this regard and so not typically suitable for monitoring the evolution of a location of interest, and therefore reducing the usefulness of GSV images. A temporally dense collection of images on the other hand makes it possible to visualize not only the different blocks, neighborhoods, and boroughs of a city, but also changes in their physical appearance over extended periods.
This research was facilitated, and in part motivated, by the availability of a new data set comprising of images captured in NYC over the course of a year. The data has been generated by cameras mounted on top of regular vehicles, and the images were captured at regular intervals as the cars travel throughout the city. This meant that photographs could be taken continuously and, since these vehicles have been on the streets throughout the year, often repeating locations, it has resulted in a data set that is temporally dense, covering not only different times of the day but various seasons as well. However, without specialized hardware, and with no human intervention, there is also no guarantee that consecutive photographs were taken to uniformly cover the streets, or that photographs were taken with the correct focus. Yet having such a dense data set creates the opportunity to conduct temporal analyses and comparison of architectural features across geographically distant locations. Because of this it allows for assessment of the urban fabric at a scale not previously practical.
3 Related Work
Concern for planning and designing the urban built environment, and supporting the practice of professionals working in these fields, has been relatively limited at CHI. Prior work includes Underkoffler and Ishi [86], who present a luminous-tangible workbench as a system supporting urban planning, and White and Feiner [88] who offer augmented reality support for site visits, by visualizing relevant data. More recently, Mahyar et al. [55] introduced a system for engaging communities in elaborating and evaluating urban design ideas through micro-activities; and Pang et al. [66] describe employing a location-based game to investigate transit commuters’ use of community information. However, recent work by Saha et al. [77], introducing “Project Sidewalk", is of particular relevance to the research we present here. Project Sidewalk a is web-based tool that takes a crowd-sourcing approach to virtual assessment of urban built environments, with both paid crowd-workers and volunteers identifying and labeling accessibility issues. Among the key issues they raise, regarding the ongoing viability of their approach, are the age of GSV panoramas and the quality and age of labels provided.
However, the increasing availability of urban data sets creates opportunities to analyze and visualize cities in new ways. This has resulted in a number of visual analytics systems designed to interactively explore and analyze data [30, 65, 27], and seek insight into transportation and mobility [4, 94], air pollution [70], real-estate ownership [40], and shadow impact on public spaces [58]. A comprehensive survey of research into urban visual analytics is presented in Zheng et al. [95]. One area of new activity that can be revealing is geo-tagged social network data. Urban Pulse [59] uses computational topology techniques and data from Twitter and Flickr to visualize spatio-temporal activity across various resolutions, and Urban Space Explorer [43] proposes an approach to explore public-space-related activity. Another is using computer vision algorithms to assess the built environment through street-view images, for example to: assess and map greenery and openness in urban settings [52, 50], quantify the daily exposure of urban residents to eye-level street greenery [91], extract land use information [51], measure visual quality [83], visual enclosure [92], urban form [81] and sky exposure [20] of street spaces, and assess traffic signs [12], curb ramps [38] and urban landmarks [47]. Street-level images have also been used to predict relationships between a city’s built environment and socioeconomic conditions [6], and as the basis for automatically extracting a city’s most distinctive visual elements [26].
Querying large-scale image data sets is a key element of the computer vision techniques that enable these new strands of research. Prior to 2012 this was largely based on image features extracted by local descriptors such as SIFT [54] or HOG [24]. However, recent work focuses on feature extraction through convolutional neural network (CNN); for example, pre-trained on image data sets (e.g., ImageNet) [82], based on a fine-tuned CNN model [8], or using the feature representation extracted from an intermediate layer of a pre-trained CNN [79, 85]. See [96] for a survey of content-based image retrieval. We build on this prior research to show how geographically and temporally dense street-level image data can support the work of professional practitioners in urban planning, design and related disciplines. To do this we present a novel system that enables users to explore a first of its kind collection of images by visually composing contextual queries and searching for visually similar images. We enhance this with support for spatiotemporal analysis of these images in conjunction with other urban data sets.
4 Introducing Urban Mosaic
Urban Mosaic, is a novel system for gaining insight into the human-scale impact of city-wide urban development through exploration of a temporally and geographically dense image data set, utilizing spatio-temporal selection and aggregation, image similarity, and clustering queries, which can be augmented with additional spatio-temporal urban data. First we describe the street-level image data set that motivated our work and underpins our discussion of Urban Mosaic in this paper. We then discuss its system architecture, our use of deep convolutional neural networks to extract feature embeddings, our methods for efficiently computing image similarity, and the Urban Mosaic user interface. Urban Mosaic is currently a working prototype, which we are using to probe the potential needs and wants of professional practitioners, and to explore alternative use cases.
4.1 Motivation
Our work is motivated by the emergence of new image data sets that offer spatially and temporally dense representations of cities, and their potential for aiding urban design and planning practitioners in auditing and assessing urban environments. Current assessment practices involve in-field auditing which requires visiting neighborhoods on foot, taking pictures, most often on just a single day. In addition to the cost of training and hiring auditors to carry out this work, it is time-consuming and can involve extensive travel [28]. Weather conditions and potential safety concerns [96] place further constraints on the capacity to undertake frequent or city-wide audits. This can mean important accessibility problems, such as the potentially hazardous condition of a damaged sidewalk after heavy rain, or under snow in winter, may not be captured during auditing.
Moving beyond the basic logistical challenges of undertaking an in-field audit, practitioners must also find common elements across these large collections of images; functionality that is typically not present even in virtual auditing tools. For example, an urban designer might wish to identify specific architectural articulations, e.g., a certain column type or window design that signifies architectural style, and indicates important factors such as estimated year of construction and building materials. Extracting this level of detail is costly and time consuming, particularly when undertaken through in-field auditing across the city, but also when attempted manually through exploring collections such as GSV. It can also be crucial to audit and assess urban environments for safety on an ongoing basis. For example, to know the condition of curb cuts or crossings under different weather conditions. If not properly maintained, they can pose a potentially life threatening hazard, specifically to the more vulnerable groups such as seniors or people with movement or vision impairment.
In our work on Urban Mosaic, we aim to facilitate the early stages of assessing and auditing the built environment, enabling practitioners to combine quantitative and qualitative data and perform fast queries of visual features over a large, spatially and temporally dense collection of street-level images. Urban Mosaic can provide earlier insights into how the city might be experienced, enabling visual comparison of geographically distant areas, and identifying similarity by architectural features and urban data sets, such as census data. Urban Mosaic will not replace the need to visit neighborhoods and experience them in person, but it can provide insight to help filter those areas that need visiting, and build a richer picture to augment those neighborhoods that are audited.
4.2 Data Set of Street-Level Images
The street-level image data used in this research was gracefully provided by Carmera. The data has been generated by cameras mounted on vehicles. These cameras, each orthogonal to the other and facing a particular direction, capture images at regular intervals as the cars travel throughout NYC. Unlike GSV, where cars are deployed specifically to capture street-level images, these are vehicles making journeys as part of the driver’s regular day-to-day activity. Because of this, the quality of images may vary due to illumination, weather, traffic conditions, or blurriness (e.g., due to vehicular speed). The mobile phone also records metadata for each image in the data set: time, location, and camera orientation. This data is more temporally dense than data sets such as GSV or Microsoft Streetside. We employ a subset of the full data, covering the boroughs of Manhattan and Brooklyn between April 2016 to April 2017, and totaling 7.77 million images.
4.3 System Architecture
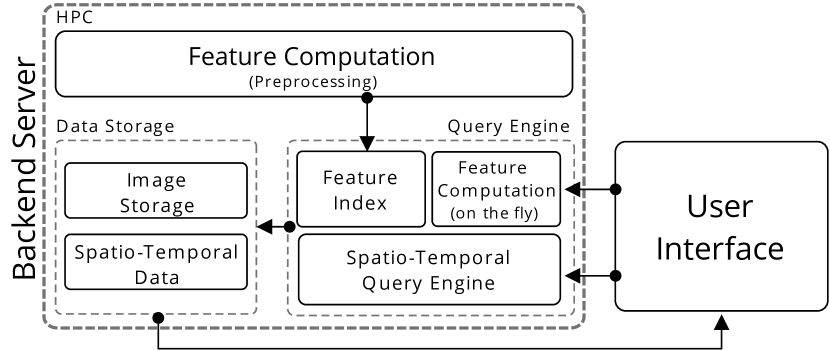
Our description of Urban Mosaic is broadly divided into two parts. First we discuss the backend server, which is responsible for enabling real-time responses to queries, followed by the user interface where these queries are composed (Fig. 1).
Query engine and data storage. The Urban Mosaic query engine supports: (1) spatio-temporal selection and aggregation queries; and (2) image similarity and clustering queries. Spatio-temporal selection queries first perform a coarse temporal query to satisfy the time period constraint, and then the resulting coordinate points are tested in parallel against the spatial constraint. To handle spatio-temporal aggregation queries we again first run a coarse temporal query, which we pass to RasterJoin [93] to compute the required spatial aggregation. For image similarity and clustering queries we preprocess a feature index to compute and store the images’ features, and use this to perform similarity queries. Images are stored as individual files on disk, while metadata and other spatio-temporal data are stored using MonetDBLite [72].
Image feature embedding. We use the intermediate layers of a pre-trained CNN as a representation of the visual information of an image. We adopt two approaches to achieve our goal of capturing semantic similarity: one for computing a coarse similarity measure for clustering queries, and another for the feature-based image similarity search. The first follows [85], and derives a compact feature vector of size 512 from the convolutional layer activations of multiple regions of a single image. This produces a feature vector that coarsely captures general aspects of the scene, to assess overall image similarity and group images into relevant clusters. The second, used for image similarity search, follows [79] and employs a fully-connected layer of VGG16 [82] as a compact and fixed-length feature descriptor of a image or region of a image. We compute a feature vector of size 4096 for each image region in a and a grid. Each image is represented by 20 4096-sized feature vectors in total. Two images are said to be similar if the similarity measure between at least one pair of feature vectors from the two images is below a given threshold.
Efficient image similarity computation. We compute similarity between two images and as the angular distance between the corresponding feature vectors and :
While this is straightforward for two images, a brute force search through all the feature vectors does not scale when working with several million images. The main challenges in enabling interactive similarity queries are twofold: (1) size: since a given image is composed of 20 4096-sized and one 512-sized feature vectors, it requires a total of 322 KB space. A data set consisting of 7.7M images will therefore require over 2.5 TB; and (2) complex floating point operations: a single comparison requires (or for clustering queries) floating point operations, which while reasonable for a small number of comparisons, cannot be done interactively over the entire data.
We overcome this by trading off accuracy for speed using a locality sensitive hashing (LSH) [21] scheme to encode the feature vectors, and performing the query using the hashed data. Given a set of input vectors in , the family of hash functions making up this LSH scheme is defined as follows: choose a random -dimensional vector where each coordinate is drawn from a 1-dimensional Gaussian distribution. The hash function corresponding to is defined as:
Then, given two vectors and in :
The idea then is to estimate the above probability to compute the angular distance between any two vectors. To do this, we first generate -dimensional vectors as described above, where = 4096 (or 512). Given a -dimensional vector , define the hash value as follows:
Then, the angle between two vectors and can be estimated using and as follows:
Note that since is a vector, each dimension of this vector can be stored using a single bit. In other words, the space required to store a single hash value is just bits, thus reducing the space required to store the hashed feature vectors of our data to 21 GB (using ) instead of the over 2.5 TB required for storing the original feature vectors. Moreover, the main operation in the above equation is the XNOR operation over bits, which is available as an intrinsic operation on current CPUs making this computation extremely efficient.
4.4 User Interface
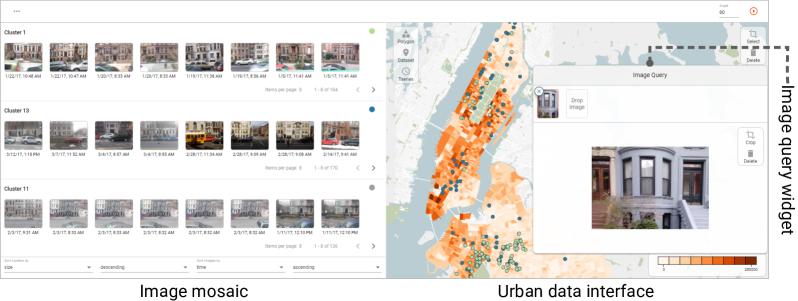
The Urban Mosaic user interface consists of three main components, shown in Fig. 2. We discuss each of these in turn.
Image query widget. This widget allows users to compose image query constraints. Users can either upload images of interest or use the images already in the underlying database. The widget also allows users to optionally crop query images. When multiple images are part of the query constraint, the query returns images that satisfy all the constraints (i.e., an intersection operation is performed). Fig. 3 illustrates an example of composing image queries using Urban Mosaic.
Urban data interface. The urban data interface allows users to visualize the spatial and temporal distributions of urban data sets using a map and a time series widget respectively. Based on their exploration of these urban data sets, users can select regions of interest over the map, and temporal ranges using the time series, to act as additional constraints on the image query. Urban data sets can be visualized as heatmaps at different spatial resolutions, e.g., neighbourhood, block, street or as a high resolution grid. Users can optionally apply a custom polygonal partition of the city to provide spatial resolution, by uploading polygonal data. The map may also be used to visualize the results from the image query as a heatmap.
Image mosaic. The image mosaic widget is used to display clusters of similar images returned from image queries. Users can sort clusters, and images within a cluster, using data attributes from other urban data sets that are loaded into Urban Mosaic (e.g., noise complaints, temperature) or by image attributes from metadata (e.g., image date, car id). Users can also visualize the spatial distribution of one or more selected clusters on the map, enabling them to more quickly identify locations where images are found with similar attributes to those in the selected cluster(s). Image mosaic is paginated to allow for queries that return large numbers of clusters. A workspace widget provides a space for the user to save the potentially large number of images of interest that might result from multiple queries over the data undertaken during a session. These saved images can be exported, along with any other urban data associated with them during analysis.
4.4.1 Practitioner perspective
In an earlier prototype of Urban Mosaic, practitioners found selecting between resolutions (e.g., or grid) when performing similarity search unnecessarily complex, and so in the prototype reported here the search is performed on all feature vectors, irrespective of its image region. Another feature introduced as a response to practitioner feedback is the facility to aggregate spatial urban data on multiple levels (e.g., neighbourhood, census tract). This was implemented because urban planners from Draw Brooklyn were particularly interested in analyzing the distribution of historical buildings at a census tract level.
5 Using Urban Mosaic
Urban Mosaic has been developed as a collaboration between researchers in visual analytics, HCI, and urban planning. However, to better understand the requirements practitioners might have, and the use cases this type of tool might facilitate, we undertook a series of interviews with practitioners from KPF, Draw Brooklyn and a research occupational therapist from NYU who specializes in urban accessibility for older people. In this section we provide a detailed presentation of two of the use cases that emerged from these interviews. In the first, we help identify locations were accessibility solutions for some may not always mean increased accessibility for all, and in the second we show how sensitivity towards preserving the urban fabric should extend beyond neighborhoods considered historic. All figures in this section are Urban Mosaic screenshots edited for privacy, and to provide a clearer graphic explanation of the tasks undertaken.
5.1 Accessibility and Mobility
Sidewalks are arguably the most important pedestrian-dedicated planned public spaces; and so inclusive, accessible streets, which serve a variety of users, are a mark of how effective a city is at the human scale. Title II of the Americans with Disabilities Act (ADA), requires pedestrian crossings to be accessible to people with disabilities [87], and one challenge experienced by wheelchair users is coping with raised curbs. This can be mitigated with the addition of a short ramp cutting through the curb. Among the regulations guiding the use of curb ramps, is the requirement that a “detectable warning", in the form of a tactile square, be installed on all the ramp-cuts for visually impaired pedestrians. These tactile pavings are distinctive, often yellow or red, with a bumpy surface created to be detectable with cane, feet or by guide dogs, and a bar pattern that serves as a directional guide.
In a 2014 study, the installation of these tactile pavings ranked as the least observed curb-cut regulation in Manhattan, with more than 88 percent of the curbs having no detectable warning surface installed [56]. However, following legal action the city has agreed to upgrade all curbs to meet ADA ramp and tactile paving requirements [35]. This requires an assessment of the condition and quality of all the city’s 162,000 curbs. The size of the task ahead becomes apparent when we see, by way of comparison, that 40 auditors were trained and employed for the 2014 study, in which less than 1% of curbs were assessed. Here we describe how Urban Mosaic can help with this task.
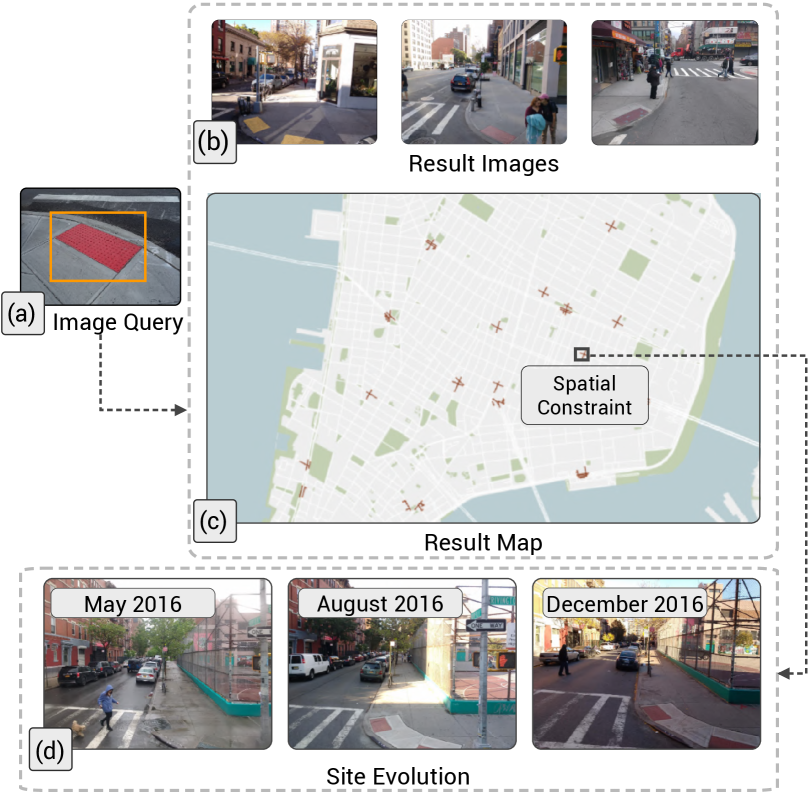
Tracing the installation of tactile pavings. The first step in our assessment analysis is to select example images of tactile pavings installed on city curb ramps. We use a reference image (Fig. 4(a)) to provide the initial query input for our search, which will return clusters of similar images from the data set. These images are tagged with geo-location metadata, and so we are able to visualize the locations where images of tactile pavings were found on the city map (Fig. 4(c)). It is also possible to map the street corners where no images of tactile pavings were found, but it is important to remember that the lack of an image does not necessarily mean there is no tactile paving installed on the curb ramp at that site. In some cases this may be because the location has not been sufficiently covered in the database of images, it may also be because image quality (e.g., poor focus) was not sufficiently good for the algorithm to clearly identify the feature. Urban Mosaic was used for visual confirmation and query refinement of the results, as shown in Fig. 4(b).
The next step is to manually select a particular location of interest on the map, where tactile pavings are present, in order to gain some insight into the condition of the tactile, and how long the tactile pavings have been in place. The selection of a particular location provides a spatial constraint for filtering our query results (Fig. 4(c)). We then sort the resulting images by the time that the picture was taken (from the image metadata) to analyze the location over time. Looking over the sorted images from the selected location, we are able to identify that in May 2016 there was a damaged tactile pavement that became potentially dangerous to pedestrians because of a puddle of water (Fig. 4(d) top). However, the tactile paving was later repaired (Fig. 4(d) middle), and remained in good condition until the end of the year (Fig. 4(d) bottom).
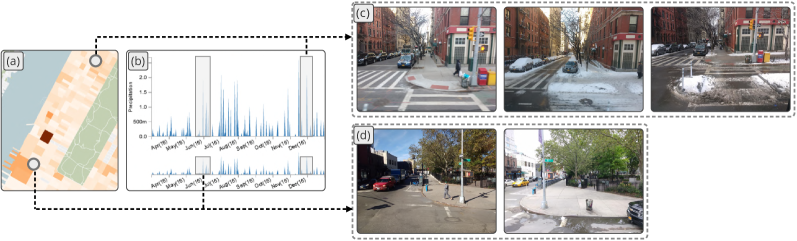
Tactile paving that may be a hazard for older adults. Our work with an occupational therapist began with an exploration of features in the urban fabric that might be associated with older adults falls. We introduced our assessment analysis of tactile pavings as a possible model for finding something that might be helpful. We learnt that the raised bumps in these tactile pavings are themselves often a cause of problems for older adults [64], and that these problems are exacerbated in bad weather. With Urban Mosaic we are able to combine data sets and image search to filter down areas of interest, and with the temporally dense data set of street-level images we can investigate the same location in different weather conditions. Next, we use Urban Mosaic to identify neighborhoods with a larger population of older adults, and then to query how the curb ramp and tactile pavings look under different weather conditions in specific locations.
The first step in our extended assessment is to identify neighborhoods with a larger population of older adults. To do this we load and map NYC census data. We then zoom in on two neighborhoods: Hell’s Kitchen (towards the bottom of the map in Fig. 5(a)) and Upper West Side (towards the top). These provide a spatial constraint to our tactile paving image query, and we are able to identify examples from within each neighborhood. We then add a temporal constraint from weather data (Fig. 5(b)), so that the query only returns images taken on days when there was some precipitation (rain and/or snow). We highlight three images from Upper West Side (Fig. 5(c)) which show the same street corner with different snow covering—no snow (left), uncleared snow (middle), and slushysnow (right). Note that the two snow scenarios are particularly dangerous for older adults, increasing the likelihood of falls. Similarly, we show two examples from Hell’s Kitchen from another street corner (Fig. 5(d)), without rain (left) and after rain (right). There are two interesting points to note in this example: (1) this corner does not have a tactile paving; and (2) the right image was taken after the rain stopped which can be seen by most of the area having dried out. However, the presence of puddles next to the curb indicates an area of concern for pedestrians, particularly older adults.
Because we are able to filter our image queries based on other spatial (e.g., census) and temporal (e.g., weather) data sets, we can present a detailed picture of particular locations of interest, based on the presence of tactile paving, and on a combination of demographic factors and weather conditions. This will allow the occupational therapist we are working with to (1) explore and identify unfamiliar neighborhoods that are causes of concern for older adults’ pedestrian safety; (2) provide materials to inform discussions with residents, and plan specific strategies to support older adults’ mobility and help prevent falls; and (3) use the examples to help create maps that can guide resilience training activities that must take place on good weather days, but which are sensitive to conditions on bad weather days. This use case responds to a requirement to better understand the urban fabric in locations that may be geographically distant and unfamiliar, and to be sensitive to how the built environment in these locations are affected by different weather conditions. The ability to qualitatively reflect the temporal variation in a single location is particularly useful in this context.
5.1.1 Practitioner perspective
The ability to explore the same neighborhood under different weather conditions, in relatively fine-grained detail, supports a key task for our collaborating occupational therapist. Her practice involves developing resilience plans with older adults that aid mobility around their immediate neighborhood, and reduce the number and likelihood of falls. The program she runs is designed around in-field exploration and discussion of walking experiences. As the locations these sessions take place in can be almost anywhere across the city, she will rarely have a detailed knowledge of the particular hazards faced. However, there are potentially hazardous features that she will commonly look out for, such as a stoop without railings up the stairs, curb cuts where rainfall and snow might accumulate, areas with a risk of black ice, and tactile paving stones that can be problematic to people who use walking supports. As she explained during a requirements discussion, “It would be great if I was able to select neighborhoods where there are high concentration of seniors as well as poor street conditions, from broken sidewalks to accumulation of rainwater, and then do a comparative analysis between different neighborhoods.”
She envisioned Urban Mosaic as a tool to support route planning, which is an important aspect of planning for resilience training. Combining collections of images taken under different weather conditions with other types of data, such as the pattern of shadow at different times of the year, can help identify locations that are likely to be particularly prone to black ice. As she explained, “If seniors know the areas with higher risk of fall in advance, like those that get very little sunlight or much shade in the winter which can be the potential hot-spots for black ice, they can plan their walk to avoid those.” During our formative evaluations she further explained that, “Looking at images from snowy days, I can evaluate the areas that are going to be the most problematic, like this segment or cross walk. If there is going to be the accumulation of water or snow then this area is a particularly bad one”. Moreover, while there are a set of common mobility challenges older adults face, each different neighborhood is also likely to vary in important ways. Our aim with Urban Mosaic is to support virtual pre-visits that can help improve understanding about the particular hazards faced, “Every neighborhood that we choose has its own challenges and what I like about the tool is that you can define what the main problem is, e.g inclement weather or obstruction, and these are the issues we’re going to help the seniors identify and be safe around”.
However, something we learned as our discussions progressed was that for her program, the best way to use the information that Urban Mosaic can generate is typically using printed maps, and these maps should present information in a simple manner so that they can be a prompt for discussion and training. During an evaluation session we were told, “When you go to the meeting centers, some of them don’t even have WiFi available or a computer screen, everything is very low-tech. I print out the maps, I take a highlighter and I show them: here is your block, these are the problematic locations. So something I can translate to a hard copy that can be handed out is what works best at this stage”. We were asked, “Is there a way to present that data in the form of a map, can you generate the hard copy of the map with the locations indicated on it?”, and instructed that “the more user friendly the better and the more simplistic we can make them the better, because then it is going to be beneficial to everybody, not just people with higher education”. This is a focus for ongoing work.
5.2 Preservation and Retrofitting
In a large and dynamic city such as NYC, demands for new development are often in conflict with a desire to protect the particular character of individual neighborhoods, with Jane Jacobs’ fight to protect Greenwich Village in the face of Robert Moses’ West Village Urban Renewal and the Lower Manhattan Expressway project being the iconic example [36, 41]. The different architectural styles present across the city reflect and define the rhythm of different neighborhoods. For example, the design of building facades has significant impact on pedestrians’ walking experiences. The fine detail and vertical articulation of facades, the presence of narrow units, and display windows, all contribute to making a walk seem shorter and less tiring; and such features lead to more inviting and walkable neighborhoods, helping to create a livelier city [33]. Reflecting this, the regulation codes for construction, renovation, and repair, can differ based on neighborhood characteristics, with some districts designated historic, or some individual buildings designated landmarks [62, 31]. However, the presence of these positive architectural features is arguably even more important in diverse locations beyond the historic neighborhoods where regulation helps protect them; and yet it is precisely these locations where the risk of unsympathetic development is greatest. Protecting the urban fabric in neighborhoods not already designated historic is an important and challenging task, made more difficult by the geographic spread of the neighborhoods in question. Here we demonstrate how Urban Mosaic can support these activities by collating examples of particular architectural features, and mapping their density across geographically distant locations.
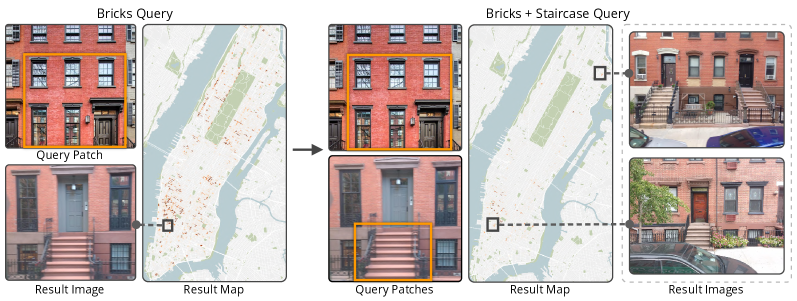
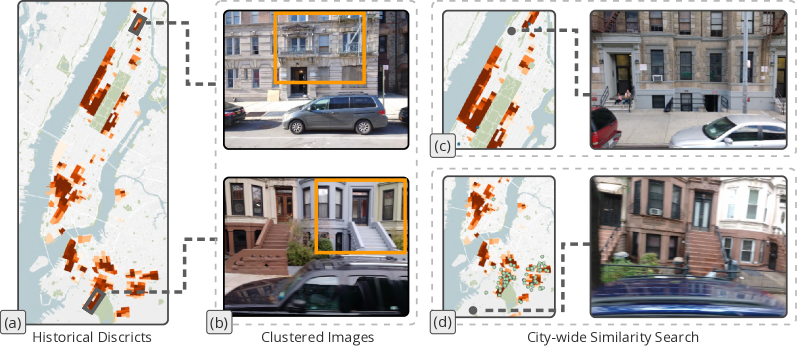
Assessing urban fabric preservation. NYC neighborhoods are often characterized by particular architectural features and materials; for example the walk-up steps and stoop common among Brooklyn brownstones, and the limestone used to build many Beaux-Arts style Manhattan townhouses. The first step in our assessment analysis is to load data containing locations of historic buildings in NYC, visualizing it as a heatmap over the neighborhoods of the city (Fig. 6(a)). We then select two neighborhoods that are designated historic , Hamilton Heights in Manhattan and Park Slope in Brooklyn. We then query the most common images found, and select buildings that display typical characteristics of each neighborhood (Fig. 6(b)).
The next step is to identify neighborhoods where buildings with these positive architectural features are present in a beneficial density, but which have not been designated historic. Buildings with these features are typically desirable, and locations where they are found are often associated with gentrification and rapid redevelopment. Using Urban Mosaic, we can identify such neighborhoods by selecting salient regions from images exemplifying the architectural features of interest, and using these as input to city-wide image queries (one for each feature of interest, highlighted by the orange rectangles in Fig. 6(b)). This identifies a neighborhood in West Harlem with a number of buildings with similar features to those expected in a Manhattan limestone townhouse (highlighted by the black circle on the map in Fig. 6(c)), and a neighborhood in Sunset Park with a number of buildings with similar features to those expected in a Brooklyn brownstone (Fig. 6(d)). Without the regulatory protections afforded by the designation of historic neighborhood status, there is an increased risk that redevelopment will include construction that is unsympathetic to such neighborhood’s particular character, and to the lived-experience of residents. This danger may be increased in neighborhoods that are home to underrepresented communities or with low socioeconomic indicators. Because of this, our analysis may be furthered using Urban Mosaic to compare neighborhoods by demographic and other indicators, e.g. age, income, employment, education, housing costs, etc. If, for example, we compare the median income of Sunset Park with that of Park Slope, we see that income in the neighborhood designated historic is markedly higher. This use case responds to a requirement for monitoring preservation and retrofitting in a context where gentrification and excessive redevelopment is often a pressing issue of concern for many residents of the neighborhoods affected. This type of query was raised by both urban design practices as important.
5.2.1 Practitioner perspective
For practitioners such as our collaborators at KPF and Draw Brooklyn, the challenge is often to make comparisons between multiple different neighborhoods, which may be geographically distant, along a variety of different parameters. Both pushed us to further develop the capacity to include additional data sets so that, for example, the visual experience associated with architectural features might be considered in relation to particular demographic or zoning characteristics of a neighborhood. For KPF, “this can bring analytics into the experience and feeling of a neighbourhood” and help planners “visually assess the characteristics of the neighbourhood and find those common to that specific zone type”, which might help in planning and designing new neighborhood regeneration projects as “planners can first select the features they think visually describe that neighborhood and assess how common these features are within that region and also in another neighbourhood”. Image clusters “can describe the visual characteristics in a faster way", and exploring temporally dense image data might enable planners “to see how the neighborhood fabric is deteriorating through time”.
Similarly, for Draw Brooklyn, the ability to query on visible architectural characteristics and compare other factors, such as zoning and demographics was a way to consider the varying impact of initiatives such as Active Design [3]. They wanted to be able to explore the building wall plane across neighborhoods, “where the sidewalk meets the private property line”, as this is important for preserving characteristics that contribute to the active feeling of a neighborhood, and also for planning features that enhance an active experience. For example, open-front stores and transparency change peoples’ perception of distance such that, “a walk along 5th Avenue feels much shorter and much less tiring since the street canopy and architectural articulation of the facades of adjacent buildings are rich and varied. Sidewalks should be designed like football fields: people need something interesting to see every 10 yards". However, many of these features, such as the vertical rhythm of the buildings or buildings spaced closely together, are more prevalent in the same historical neighborhoods where gentrification and aggressive over-development can become a problem.
During evaluations, both KPF and Draw Brooklyn drew attention towards adding a natural language capacity to support the translation between textual queries and visual search. As one practitioner from Draw Brooklyn put it, adding this feature “allows users to tag images with keywords, then the user can create a new gallery based on this keyword”.
6 Discussion
The availability of geographically and temporally dense data sets of street-level images, combined with computer vision and visual search techniques, has the potential to offer powerful new tools to support the work of architects, and urban planners and designers. For example, facilitating new forms of virtual audit and assessment. While virtual auditing with publicly available tools such as GSV has started to explore this space and address some of the limitations of in-field auditing [76, 11, 10, 45, 22], three key challenges have been noted. First, these approaches have typically required trained experts to manually explore large collections of images [67, 97, 9]; second, these collections of images, while geographically dense, are temporally sparse, making it difficult to track change over time [76, 17, 16, 67]; and third, these approaches do not integrate external data that might filter image data or capture the additional features required by many audit tools [80, 90, 17]. Similar challenges have been noted when a crowdsourcing approach to accessibility auditing at scale was adopted [77]. Even for practices using data-informed methods, assessing the qualities of different neighborhoods typically involves a manual, time-consuming process of documenting different locations, or a similarly time-consuming process of virtually walking through neighborhoods in GSV.
With Urban Mosaic, we begin to address each of these challenges. First, we are able to provide an automated first pass visual search for features of interest, which can significantly reduce the overhead of manually searching through GSV and refine the geographical scale of virtual auditing. Second, we offer a dense temporal granularity that facilitates comparison of the same location over multiple points in time, supporting greater insight into the qualitative, human-scale impact on changes to the urban fabric; as illustrated in our case study, Tracing the installation of tactile paving. Third, we offer practitioners the ability to incorporate additional spatio-temporal data sets, such as weather, demographics, zoning, property values, crime, etc. to further filter or inform visual search; as illustrated in our use cases Assessing urban fabric preservation and Tactile paving that may be a hazard for older adults. Building on the capacities that are emerging through current virtual audit and assessment practices, Urban Mosaic does not replace the need to visit selected locations, rather we aim to support practitioners’ informed decision making by helping to filter and refine the selection of neighborhoods and locations to visit, and by providing new insights into temporal changes in the urban fabric. Our collaborating practitioners have to date been supportive of these attempts to provide fast, efficient alternatives for many of the tasks conventionally done through manual, time consuming methods; a practitioner from Draw Brooklyn commented that "it can dramatically transform the way cities are planned and operated".
In developing Urban Mosaic, we have incorporated roughly 7.7 million images taken over the course of a year in two boroughs of NYC. To explore what amounts to several terabytes of data, we utilize computer vision techniques to extract image features. However, even working with computed features can be slow enough to hamper visual exploration [53], and so we use an LSH-based index to reduce the memory footprint of the workable data and allow for fast query response times.
6.1 Limitations and future work
This research is part of ongoing inquiry into the opportunities that new image data sets and new techniques for visual search offer practitioners such as urban planners and designers. The work we report here includes these practitioners in requirements gathering and formative evaluation activities. These interactions have highlighted a number of particular areas for future research, including the integration of a natural language tool to translate text input into visual search and providing printable output in the form of maps or other reports. However, to more fully understand these opportunities, and their wider impact on the work of these professionals, future research should include longitudinal user evaluation studies with Urban Mosaic being used in the day-to-day practice of our collaborators, and be expanded to include a wider diversity of possible future users.
7 Conclusion
In this paper we introduced Urban Mosaic, a visual analysis tool for the interactive search and exploration of the urban fabric of NYC, and demonstrated the potential of large-scale street-level image data sets to support urban planning and design. We have described our work with professional practitioners to surface opportunities and requirements for employing these data, and shown how they might offer a route towards staying sympathetic to the impact at a human-scale caused by city-scale changes. We also presented two detailed use cases that demonstrate how Urban Mosaic responds to these opportunities and requirements; and we have shown how the combination of geographically and temporally dense image data can be combined with other spatio-temporal urban data to provide a bridge between the city and the street.
8 Acknowledgements
We would like to thank Carmera for providing the NYC image data set that motivated this work. We also thank our colleagues from Kohn Pedersen Fox, Draw Brooklyn, and New York University for their help in this research. This work was supported in part by: the Moore-Sloan Data Science Environment at NYU; NASA; NSF awards CNS-1229185, CCF-1533564, CNS-1544753, CNS-1730396, CNS-1828576, CNS-1626098; CNPq grant 305974/2018-1; FAPERJ grant E-26/202.915/2019; and the NVIDIA NVAIL at NYU. C. T. Silva is partially supported by the DARPA D3M program. Any opinions, findings, and conclusions or recommendations expressed in this material are those of the authors and do not necessarily reflect the views of DARPA. We also thank Nvidia Corporation for donating GPUs used in this research.
References
- [1]
- [2] Mahdi Aghaabbasi, Mehdi Moeinaddini, Muhammad Zaly Shah, Zohreh Asadi-Shekari, and Mehdi Arjomand Kermani. 2018. Evaluating the capability of walkability audit tools for assessing sidewalks. Sustainable Cities and Society 37 (2018), 475 – 484.
- [3] American Institute of Architects New York Chapter. 2007. Fit-City: Promoting Physical Activity through Design. (2007).
- [4] Gennady Andrienko and Natalia Andrienko. 2008. Spatio-temporal aggregation for visual analysis of movements. In 2008 IEEE Symposium on Visual Analytics Science and Technology. 51–58.
- [5] Dragomir Anguelov, Carole Dulong, Daniel Filip, Christian Frueh, Stéphane Lafon, Richard Lyon, Abhijit Ogale, Luc Vincent, and Josh Weaver. 2010. Google Street View: Capturing the world at street level. Computer 43, 6 (2010), 32–38.
- [6] Sean M. Arietta, Alexei A. Efros, Ravi Ramamoorthi, and Maneesh Agrawala. 2014. City Forensics: Using Visual Elements to Predict Non-Visual City Attributes. IEEE Transactions on Visualization and Computer Graphics 20, 12 (2014), 2624–2633.
- [7] Raja Noriza Raja Ariffin and Rustam Khairi Zahari. 2013. Perceptions of the urban walking environments. Procedia-Social and Behavioral Sciences 105 (2013), 589–597.
- [8] Artem Babenko, Anton Slesarev, Alexandr Chigorin, and Victor Lempitsky. 2014. Neural codes for image retrieval. In European conference on computer vision. Springer, 584–599.
- [9] Michael D.M. Bader, Stephen J. Mooney, Yeon Jin Lee, Daniel Sheehan, Kathryn M. Neckerman, Andrew G. Rundle, and Julien O. Teitler. 2015. Development and deployment of the Computer Assisted Neighborhood Visual Assessment System (CANVAS) to measure health-related neighborhood conditions. Health & place 31 (2015), 163–172.
- [10] Hannah M. Badland, Simon Opit, Karen Witten, Robin A. Kearns, and Suzanne Mavoa. 2010. Can virtual streetscape audits reliably replace physical streetscape audits? Journal of Urban Health 87, 6 (2010), 1007–1016.
- [11] Hannah M. Badland, Grant M. Schofield, Karen Witten, Philip J. Schluter, Suzanne Mavoa, Robin A. Kearns, Erica A. Hinckson, Melody Oliver, Hector Kaiwai, Victoria G. Jensen, and others. 2009. Understanding the Relationship between Activity and Neighbourhoods (URBAN) Study: research design and methodology. BMC Public Health 9, 1 (2009), 224.
- [12] Vahid Balali, Armin Ashouri Rad, and Mani Golparvar-Fard. 2015. Detection, classification, and mapping of US traffic signs using Google Street View images for roadway inventory management. Visualization in Engineering 3, 1 (2015), 15.
- [13] Michael Batty. 2009. Cities as Complex Systems: Scaling, Interaction, Networks, Dynamics and Urban Morphologies. (2009).
- [14] Michael Batty. 2013. Big data, smart cities and city planning. Dialogues in Human Geography 3, 3 (2013), 274–279.
- [15] Richard A. Becker, Ramon Caceres, Karrie Hanson, Ji Meng Loh, Simon Urbanek, Alexander Varshavsky, and Chris Volinsky. 2011. A tale of one city: Using cellular network data for urban planning. IEEE Pervasive Computing 10, 4 (2011), 18–26.
- [16] Eran Ben-Joseph, Jae Seung Lee, Ellen K. Cromley, Francine Laden, and Philip J. Troped. 2013. Virtual and actual: relative accuracy of on-site and web-based instruments in auditing the environment for physical activity. Health & place 19 (2013), 138–150.
- [17] John R. Bethlehem, Joreintje D. Mackenbach, Maher Ben-Rebah, Sofie Compernolle, Ketevan Glonti, Helga Bárdos, Harry R. Rutter, Hélène Charreire, Jean-Michel Oppert, Johannes Brug, and Jeroen Lakerveld. 2014. The SPOTLIGHT virtual audit tool: a valid and reliable tool to assess obesogenic characteristics of the built environment. International journal of health geographics 13, 1 (2014), 52.
- [18] R. Devon Bise, John C. Rodgers III, Michael A. Maguigan, Brian Beaulieu, William Keith, Chanda L. Maguigan, and Qingmin Meng. 2018. Sidewalks as Measures of Infrastructure Inequities. Southeastern Geographer 58, 1 (2018), 39–57.
- [19] Ross C. Brownson, Christine M. Hoehner, Kristen Day, Ann Forsyth, and James F. Sallis. 2009. Measuring the Built Environment for Physical Activity: State of the Science. American Journal of Preventive Medicine 36, 4, Supplement (2009), S99 – S123.e12.
- [20] Roberto Carrasco-Hernandez, Andrew R.D. Smedley, and Ann R. Webb. 2015. Using urban canyon geometries obtained from Google Street View for atmospheric studies: Potential applications in the calculation of street level total shortwave irradiances. Energy and Buildings 86 (2015), 340–348.
- [21] Moses S. Charikar. 2002. Similarity Estimation Techniques from Rounding Algorithms. In Proceedings of the Thiry-fourth Annual ACM Symposium on Theory of Computing (STOC ’02). ACM, New York, NY, USA, 380–388.
- [22] Hélène Charreire, Joreintje D Mackenbach, M Ouasti, Jeroen Lakerveld, Sofie Compernolle, M Ben-Rebah, Martin McKee, Johannes Brug, Harry Rutter, and J-M Oppert. 2014. Using remote sensing to define environmental characteristics related to physical activity and dietary behaviours: a systematic review (the SPOTLIGHT project). Health & place 25 (2014), 1–9.
- [23] Kelly J. Clifton, Andréa D. Livi Smith, and Daniel Rodriguez. 2007. The development and testing of an audit for the pedestrian environment. Landscape and Urban Planning 80, 1 (2007), 95 – 110.
- [24] Navneet Dalal and Bill Triggs. 2005. Histograms of oriented gradients for human detection. In 2005 IEEE Computer Society Conference on Computer Vision and Pattern Recognition, Vol. 1. 886–893 vol. 1.
- [25] Ana V. Diez Roux. 2003. Residential environments and cardiovascular risk. Journal of Urban Health 80, 4 (2003), 569–589.
- [26] Carl Doersch, Saurabh Singh, Abhinav Gupta, Josef Sivic, and Alexei Efros. 2012. What Makes Paris Look like Paris? ACM Transactions on Graphics 31, 4 (2012).
- [27] Harish Doraiswamy, Eleni Tzirita Zacharatou, Fabio Miranda, Marcos Lage, Anastasia Ailamaki, Cláudio T. Silva, and Juliana Freire. 2018. Interactive Visual Exploration of Spatio-Temporal Urban Data Sets Using Urbane. In Proceedings of the 2018 International Conference on Management of Data. 1693–1696.
- [28] James Emery, Carolyn Crump, and Philip Bors. 2003. Reliability and validity of two instruments designed to assess the walking and bicycling suitability of sidewalks and roads. American Journal of Health Promotion 18, 1 (2003), 38–46.
- [29] Marcos A.G. Ferreira and Suely da Penha Sanches. 2007. Proposal of a Sidewalk Accessibility Index. Journal of Urban and Environmental Engineering 1, 1 (2007), 1–9.
- [30] Nivan Ferreira, Jorge Poco, Huy T Vo, Juliana Freire, and Cláudio T. Silva. 2013. Visual exploration of big spatio-temporal urban data: A study of New York City taxi trips. IEEE Transactions on Visualization and Computer Graphics 19, 12 (2013), 2149–2158.
- [31] Greenwich Village Society for Historic Preservation. 2017. Twenty years of preserving Federal-era row-houses. (2017).
- [32] Ann Forsyth, Mary Hearst, J. Michael Oakes, and Kathryn H. Schmitz. 2008. Design and Destinations: Factors Influencing Walking and Total Physical Activity. Urban Studies 45, 9 (2008), 1973–1996.
- [33] Jan Gehl. 2013. Cities for people. Island press.
- [34] Edward L. Glaeser, Scott Duke Kominers, Michael Luca, and Nikhil Naik. 2018. Big data and big cities: The promises and limitations of improved measures of urban life. Economic Inquiry 56, 1 (2018), 114–137.
- [35] Gothamist. 2019. NYC Agrees To Make All Sidewalk Curbs Accessible To The Disabled . (March 2019). Retrieved August 15, 2019 from http://gothamist.com/2019/03/21/sidewalk_curbs_accessible_nyc.php
- [36] Roberta Brandes Gratz. 2010. The Battle for Gotham: New York in the Shadow of Robert Moses and Jane Jacobs. Bold Type Books.
- [37] Mary Hammon. 2015. Data-Driven: Leveraging the potential of big data for planning. (April 2015). Retrieved September 11, 2019 from https://www.planning.org/planning/2015/apr/datadriven.htm
- [38] Kotaro Hara, Jin Sun, Robert Moore, David Jacobs, and Jon Froehlich. 2014. Tohme: detecting curb ramps in Google Street View using crowdsourcing, computer vision, and machine learning. In Proceedings of the 27th annual ACM symposium on User interface software and technology. ACM, 189–204.
- [39] Chester Wollaeger Harvey. 2014. Measuring streetscape design for livability using spatial data and methods. (2014).
- [40] Tuan-Anh Hoang-Vu, Vicki Been, Ingrid Gould Ellen, Max Weselcouch, and Juliana Freire. 2014. Towards Understanding Real-Estate Ownership in New York City: Opportunities and Challenges. In Proceedings of the International Workshop on Data Science for Macro-Modeling (DSMM’14). ACM, New York, NY, USA, Article 15, 15:1–15:2 pages.
- [41] Jane Jacobs. 1961. The Death and Life of Great American Cities. Random House, New York.
- [42] C. Ray Jeffery. 1977. Crime prevention through environmental design. Sage Publications Beverly Hills, CA.
- [43] Alireza Karduni, Isaac Cho, Ginette Wessel, William Ribarsky, Eric Sauda, and Wenwen Dou. 2017. Urban Space Explorer: A Visual Analytics System for Urban Planning. IEEE Computer Graphics and Applications 37, 5 (2017), 50–60.
- [44] Peter T. Katzmarzyk, Kara D. Denstel, Kim Beals, Jordan Carlson, Scott E. Crouter, Thomas L. McKenzie, Russell R. Pate, Susan B. Sisson, Amanda E. Staiano, Heidi Stanish, Dianne S. Ward, Melicia Whitt-Glover, and Carly Wright. 2018. Results from the United States 2018 Report Card on Physical Activity for Children and Youth. Journal of Physical Activity and Health 15, S2 (2018), S422–S424.
- [45] Cheryl M. Kelly, Jeffrey S. Wilson, Elizabeth A. Baker, Douglas K. Miller, and Mario Schootman. 2012. Using Google Street View to audit the built environment: inter-rater reliability results. Annals of Behavioral Medicine 45 (2012), S108–S112.
- [46] Johannes Kopf, Billy Chen, Richard Szeliski, and Michael Cohen. 2010. Street slide: browsing street level imagery. In ACM Transactions on Graphics, Vol. 29. ACM, 96:1–96:8.
- [47] Christian Lander, Frederik Wiehr, Nico Herbig, Antonio Krüger, and Markus Löchtefeld. 2017. Inferring landmarks for pedestrian navigation from mobile eye-tracking data and Google Street View. In Proceedings of the 2017 CHI Conference Extended Abstracts on Human Factors in Computing Systems. 2721–2729.
- [48] Peter L. Laurence. 2006. The death and life of urban design: Jane Jacobs, The Rockefeller Foundation and the new research in urbanism, 1955–1965. Journal of Urban Design 11, 2 (2006), 145–172.
- [49] Freddy Lécué, Simone Tallevi-Diotallevi, Jer Hayes, Robert Tucker, Veli Bicer, Marco Luca Sbodio, and Pierpaolo Tommasi. 2014. Star-city: semantic traffic analytics and reasoning for city. In Proceedings of the 19th international conference on Intelligent User Interfaces. ACM, 179–188.
- [50] Xiaojiang Li, Carlo Ratti, and Ian Seiferling. 2017. Mapping urban landscapes along streets using Google street view. In International cartographic conference. Springer, 341–356.
- [51] Xiaojiang Li and Chuanrong Zhang. 2016. Urban Land Use Information Retrieval Based on Scene Classification of Google Street View Images.. In SDW@ GIScience. 41–46.
- [52] Xiaojiang Li, Chuanrong Zhang, Weidong Li, Robert Ricard, Qingyan Meng, and Weixing Zhang. 2015. Assessing street-level urban greenery using Google Street View and a modified green view index. Urban Forestry & Urban Greening 14, 3 (2015), 675–685.
- [53] Zhicheng Liu and Jeffrey Heer. 2014. The Effects of Interactive Latency on Exploratory Visual Analysis. IEEE Transactions on Visualization and Computer Graphics 20, 12 (2014), 2122–2131.
- [54] David G. Lowe. 2004. Distinctive Image Features from Scale-Invariant Keypoints. Int. J. Comput. Vision 60, 2 (2004), 91–110.
- [55] Narges Mahyar, Michael R James, Michelle M Ng, Reginald A Wu, and Steven P Dow. 2018. CommunityCrit: Inviting the Public to Improve and Evaluate Urban Design Ideas through Micro-Activities. In Proceedings of the 2018 CHI Conference on Human Factors in Computing Systems. 195.
- [56] Manhattan Borough President. 2018. Accessible Manhattan: Making Sidewalks Safe and Navigable for All. (2018).
- [57] Wesley E. Marshall and Norman W. Garrick. 2010. Effect of street network design on walking and biking. Transportation Research Record 2198, 1 (2010), 103–115.
- [58] Fabio Miranda, Harish Doraiswamy, Marcos Lage, Luc Wilson, Mondrian Hsieh, and Claudio T. Silva. 2019. Shadow Accrual Maps: Efficient Accumulation of City-Scale Shadows Over Time. IEEE Transactions on Visualization and Computer Graphics 25, 3 (2019), 1559–1574.
- [59] Fabio Miranda, Harish Doraiswamy, Marcos Lage, Kai Zhao, Bruno Gonçalves, Luc Wilson, Mondrian Hsieh, and Cláudio T Silva. 2016. Urban Pulse: Capturing the rhythm of cities. IEEE transactions on visualization and computer graphics 23, 1 (2016), 791–800.
- [60] Nikhil Naik, Jade Philipoom, Ramesh Raskar, and César Hidalgo. 2014. Streetscore-predicting the perceived safety of one million streetscapes. In Proceedings of the 2014 IEEE Conference on Computer Vision and Pattern Recognition Workshops. 779–785.
- [61] Nikhil Naik, Ramesh Raskar, and César A. Hidalgo. 2016. Cities Are Physical Too: Using Computer Vision to Measure the Quality and Impact of Urban Appearance. American Economic Review 106, 5 (2016), 128–32.
- [62] New York City Landmarks Preservation Commission. 2013. Rules of the New York City Landmarks Preservation Commission, Title 63, Rules of the City of New York . (2013).
- [63] Oscar Newman. 1972. Defensible space. Macmillan New York.
- [64] Marcus Ormerod, Rita Newton, Hamish MacLennan, Mohamed Faruk, Sibylle Thies, Laurence Kenney, David Howard, and Chris Nester. 2015. Older people’s experiences of using tactile paving. Proceedings of the Institution of Civil Engineers - Municipal Engineer 168, 1 (2015), 3–10.
- [65] Thomas Ortner, Johannes Sorger, Harald Steinlechner, Gerd Hesina, Harald Piringer, and Eduard Gröller. 2017. Vis-A-Ware: Integrating Spatial and Non-Spatial Visualization for Visibility-Aware Urban Planning. IEEE Transactions on Visualization and Computer Graphics 23, 2 (2017), 1139–1151.
- [66] Carolyn Pang, Rui Pan, Carman Neustaedter, and Kate Hennessy. 2019. City Explorer: The Design and Evaluation of a Location-Based Community Information System. In Proceedings of the 2019 CHI Conference on Human Factors in Computing Systems. 341:1–341:15.
- [67] Christine B Phillips, Jessa K Engelberg, Carrie M Geremia, Wenfei Zhu, Jonathan M Kurka, Kelli L Cain, James F Sallis, Terry L Conway, and Marc A Adams. 2017. Online versus in-person comparison of Microscale Audit of Pedestrian Streetscapes (MAPS) assessments: reliability of alternate methods. International journal of health geographics 16, 1 (2017), 27.
- [68] Achilleas Psyllidis, Alessandro Bozzon, Stefano Bocconi, and Christiaan Titos Bolivar. 2015. A platform for urban analytics and semantic data integration in city planning. In International conference on computer-aided architectural design futures. Springer, 21–36.
- [69] Marnie Purciel, Kathryn M. Neckerman, Gina S. Lovasi, James W. Quinn, Christopher Weiss, Michael D.M. Bader, Reid Ewing, and Andrew Rundle. 2009. Creating and validating GIS measures of urban design for health research. Journal of Environmental Psychology 29, 4 (2009), 457 – 466.
- [70] Huamin Qu, Wing-Yi Chan, Anbang Xu, Kai-Lun Chung, Kai-Hon Lau, and Ping Guo. 2007. Visual Analysis of the Air Pollution Problem in Hong Kong. IEEE Transactions on Visualization and Computer Graphics 13, 6 (2007), 1408–1415.
- [71] Daniele Quercia and Diego Saez. 2014. Mining urban deprivation from foursquare: Implicit crowdsourcing of city land use. IEEE Pervasive Computing 13, 2 (2014), 30–36.
- [72] Mark Raasveldt and Hannes Mühleisen. 2018. MonetDBLite: An Embedded Analytical Database. CoRR abs/1805.08520 (2018).
- [73] Jonathan Reades, Francesco Calabrese, Andres Sevtsuk, and Carlo Ratti. 2007. Cellular census: Explorations in urban data collection. IEEE Pervasive computing 6, 3 (2007), 30–38.
- [74] Richard A. Retting, Susan A. Ferguson, and Anne T. McCartt. 2003. A Review of Evidence-Based Traffic Engineering Measures Designed to Reduce Pedestrian-Motor Vehicle Crashes. American Journal of Public Health 93, 9 (2003), 1456–1463.
- [75] Shannon H. Rogers, Kevin H. Gardner, and Cynthia H. Carlson. 2013. Social capital and walkability as social aspects of sustainability. Sustainability 5, 8 (2013), 3473–3483.
- [76] Andrew G. Rundle, Michael D.M. Bader, Catherine A. Richards, Kathryn M. Neckerman, and Julien O. Teitler. 2011. Using Google Street View to audit neighborhood environments. American journal of preventive medicine 40, 1 (2011), 94–100.
- [77] Manaswi Saha, Michael Saugstad, Hanuma Teja Maddali, Aileen Zeng, Ryan Holland, Steven Bower, Aditya Dash, Sage Chen, Anthony Li, Kotaro Hara, and Jon Froehlich. 2019. Project Sidewalk: A Web-based Crowdsourcing Tool for Collecting Sidewalk Accessibility Data At Scale. In Proceedings of the 2019 CHI Conference on Human Factors in Computing Systems. 62:1–62:14.
- [78] James F. Sallis, Myron F. Floyd, Daniel A. Rodríguez, and Brian E. Saelens. 2012. Role of built environments in physical activity, obesity, and cardiovascular disease. Circulation 125, 5 (2012), 729–737.
- [79] Ali Sharif Razavian, Hossein Azizpour, Josephine Sullivan, and Stefan Carlsson. 2014. CNN features off-the-shelf: an astounding baseline for recognition. In Proceedings of the 2014 IEEE Conference on Computer Vision and Pattern Recognition Workshops. 806–813.
- [80] Farjana Shatu and Tan Yigitcanlar. 2018. Development and validity of a virtual street walkability audit tool for pedestrian route choice analysis-SWATCH. Journal of transport geography 70 (2018), 148–160.
- [81] Qiaomu Shen, Wei Zeng, Yu Ye, Stefan Müller Arisona, Simon Schubiger, Remo Burkhard, and Huamin Qu. 2018. StreetVizor: Visual Exploration of Human-Scale Urban Forms Based on Street Views. IEEE Transactions on Visualization and Computer Graphics 24, 1 (2018), 1004–1013.
- [82] Karen Simonyan and Andrew Zisserman. 2015. Very Deep Convolutional Networks for Large-Scale Image Recognition. In 3rd International Conference on Learning Representations.
- [83] Jingxian Tang and Ying Long. 2018. Measuring visual quality of street space and its temporal variation: Methodology and its application in the Hutong area in Beijing. Landscape and Urban Planning (2018).
- [84] Christina M. Thornton, Terry L. Conway, Kelli L. Cain, Kavita A. Gavand, Brian E. Saelens, Lawrence D. Frank, Carrie M. Geremia, Karen Glanz, Abby C. King, and James F. Sallis. 2016. Disparities in pedestrian streetscape environments by income and race/ethnicity. SSM-population health 2 (2016), 206–216.
- [85] Giorgos Tolias, Ronan Sicre, and Hervé Jégou. 2016. Particular object retrieval with integral max-pooling of CNN activations. (2016).
- [86] John Underkoffler and Hiroshi Ishii. 1999. Urp: a luminous-tangible workbench for urban planning and design. In Proceedings of the SIGCHI conference on Human Factors in Computing Systems. ACM, 386–393.
- [87] United States Department of Justice Civil Rights Division. 2010. Curb Ramps and Pedestrian Crossings Under Title II of the ADA. (2010).
- [88] Sean White and Steven Feiner. 2009. SiteLens: situated visualization techniques for urban site visits. In Proceedings of the SIGCHI conference on human factors in computing systems. ACM, 1117–1120.
- [89] Joel E. Williams, Martin Evans, Karen A. Kirtland, Marlo M. Cavnar, Patricia A. Sharpe, Matthew J. Neet, and Annette Cook. 2005. Development and Use of a Tool for Assessing Sidewalk Maintenance as an Environmental Support of Physical Activity. Health Promotion Practice 6, 1 (2005), 81–88.
- [90] Jeffrey S Wilson, Cheryl M Kelly, Mario Schootman, Elizabeth A Baker, Aniruddha Banerjee, Morgan Clennin, and Douglas K Miller. 2012. Assessing the built environment using omnidirectional imagery. American journal of preventive medicine 42, 2 (2012), 193–199.
- [91] Yu Ye, Daniel Richards, Yi Lu, Xiaoping Song, Yu Zhuang, Wei Zeng, and Teng Zhong. 2018. Measuring daily accessed street greenery: A human-scale approach for informing better urban planning practices. Landscape and Urban Planning (2018).
- [92] Li Yin and Zhenxin Wang. 2016. Measuring visual enclosure for street walkability: Using machine learning algorithms and Google Street View imagery. Applied geography 76 (2016), 147–153.
- [93] Eleni Tzirita Zacharatou, Harish Doraiswamy, Anastasia Ailamaki, Cláudio T. Silva, and Juliana Freire. 2017. GPU rasterization for real-time spatial aggregation over arbitrary polygons. Proceedings of the VLDB Endowment 11, 3 (2017), 352–365.
- [94] Wei Zeng, Chi-Wing Fu, Stefan M. Arisona, Alexander Erath, and Huamin Qu. 2014. Visualizing Mobility of Public Transportation System. IEEE Transactions on Visualization and Computer Graphics 20, 12 (2014), 1833–1842.
- [95] Yixian Zheng, Wenchao Wu, Yuanzhe Chen, Huamin Qu, and Lionel M. Ni. 2016. Visual Analytics in Urban Computing: An Overview. IEEE Transactions on Big Data 2, 3 (2016), 276–296.
- [96] Wengang Zhou, Houqiang Li, and Qi Tian. 2017. Recent Advance in Content-based Image Retrieval: A Literature Survey. CoRR abs/1706.06064 (2017).
- [97] Wenfei Zhu, Yuliang Sun, Jonathan Kurka, Carrie Geremia, Jessa K Engelberg, Kelli Cain, Terry Conway, James F Sallis, Steven P Hooker, and Marc A Adams. 2017. Reliability between online raters with varying familiarities of a region: Microscale Audit of Pedestrian Streetscapes (MAPS). Landscape and urban planning 167 (2017), 240–248.