Constraining the lensing of binary neutron stars from their stochastic background
Abstract
Gravitational wave (GW) transients from binary neutron star (BNS) coalescences can, in principle, be subject to gravitational lensing thereby increasing the amplitude and signal-to-noise ratio. We estimate the rate of lensed BNS events resolvable by LIGO and Virgo and find that it is constrained by the current non-detection of a stochastic GW background. Following closely the formalism we developed previously Buscicchio et al. (2020) in the context of binary black hole lensing, we show that at current sensitivities the fraction of BNS coalescences with lensing magnifications is less than and therefore such events should not be expected in the near future. We also make predictions for projected future sensitivities.
I Introduction
Two binary binary neutron star (BNS) mergers have been detected so far Abbott et al. (2017, 2020a). The event GW190814 Abbott et al. (2020b) may also contain a neutron star. Forthcoming detector upgrades will provide better sensitivity, allowing us to probe ever larger spacetime volumes and detect more events Abbott et al. (2018a). Currently, the observed GW events involving neutron stars are loud and individually resolvable Finn and Chernoff (1993); Cutler and Flanagan (1994). However, many more events will lie below the threshold for detection, individually indistinguishable from the instrument noise. All these events are drawn from the same overall population. The unresolvable GW events, including those involving neutron stars, will pile up across the detector bandwidth and give a stochastic background of gravitational waves (SGWB). Such signal is subject to dedicated searches by current ground-based interferometers Abbott et al. (2019a, 2018b); Hernandez Vivanco et al. (2019).
A fraction of BNS events will be gravitationally lensed; this has the effect of increasing the GW amplitude by a factor , where is the lensing magnification. The lensing of a GW depends on the intervening gravitational potential, and different events will experience different lensing magnifications. Multiply imaged GWs, phasing and wave-optics effects may also occur depending on the specific potential Treu (2010); Dai et al. (2017); Li et al. (2018); Hannuksela et al. (2019); Dai et al. (2020); Pang et al. (2020).
In Buscicchio et al. (2020) we considered the analogous situation for binary black hole (BBH) GW events. That paper described in detail the formalism to quantify the impact of lensing on the amplitude and detection rate of individual events, as well as the amplitude of the associated SGWB (see also Mukherjee et al. (2020)). Subsequently, we leveraged the non detection of a stochastic background to get constraints on the probability of individual BBHs being lensed. In order to do so, we framed in a single statistical picture the observational data from GW detectors (i.e. individual events, stochastic background), their inferred properties, and the implication on the observation of lensed events.
In this paper we reapply the techniques from Buscicchio et al. (2020) to the analysis of BNS events. Using constraints on the BNS merger rate density after the first two observing runs Abbott et al. (2019b), and the confirmed non-detection of a stochastic background Abbott et al. (2019a), we report the implication on the expected number of lensed BNS observations, both in the weak and strong lensing regime. Throughout we follow the conventions of Buscicchio et al. (2020).
II Models
We employ a semi-analytical model for the lensing probability as a function of redshift out to redshifts . This model applies to magnifications up to , as described in Dai et al. (2017) (i.e. it includes both strong and weak lensing). For details of our implementation of this lensing model we refer the interested reader to Appendix A of Buscicchio et al. (2020).
It is also necessary to model the BNS population. We neglect neutron star spins and matter effects (e.g. tides) as well as any orbital eccentricity in the binary. Under these simplifying assumptions a binary is described by the two component masses, and . We model the distribution of component masses, , in three different scenarios. The first two match those employed in the rates analysis of GWTC-1 Abbott et al. (2019b) (see Section VII.C). The third is included to investigate the effect of the width of the mass distribution.
-
•
“Uniform”; the component masses are drawn independently from a uniform distribution in the range [0.82.3].
-
•
“Gaussian”; the component masses are drawn from a Gaussian distribution with mean 1.33 and standard deviation 0.09.
-
•
“Fixed”; all neutron star masses are equal to .
We choose to model the redshift evolution of the BNS merger rate by tracking the star formation rate. For details, see Equation 5 and Figure 1 of Buscicchio et al. (2020). In a slight deviation from the previous study, we keep the population extinction (i.e. ) fixed at high redshifts (i.e. ) (following Madau-Dickinson Madau and Dickinson (2014)) while increasing the slope of the local merger rate (). We fix the local rate () to the estimates provided in Abbott et al. (2019b), while varying (see Table 1). We focus on results from one pipeline search only (pyCBC Usman et al. (2016)); analogous results have been computed for other pipelines (e.g. GstLAL Sachdev et al. (2019)) and differences are at the level of %.
| Mass | Sensitivity | ||
|---|---|---|---|
| Uniform | |||
| Design | |||
| Gaussian | |||
| Design | |||
| Fixed | |||
| Design |
By changing the value of , we effectively set the level of the BNS stochastic background (see Equation 7 in Buscicchio et al. (2020)), including the effect of lensing, to a marginally detectable level. As in Buscicchio et al. (2020), this is done for two different detector network sensitivities (namely the existing “O1+O2” sensitivity and a projected future “Design” sensitivity).
This section has briefly described the various modelling assumptions made for (i) the lensing probability, (ii) the properties of the BNS population, and (iii) the cosmological evolution of the BNS merger rate. We refer the reader to the Appendices in Buscicchio et al. (2020) for a more detailed discussion of the impact of these assumptions on the results of our analysis.
III Results
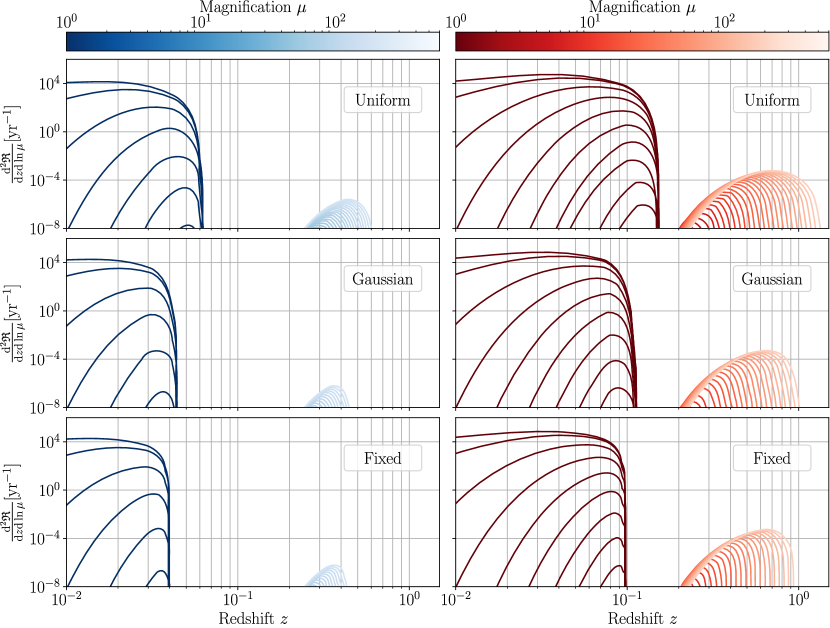
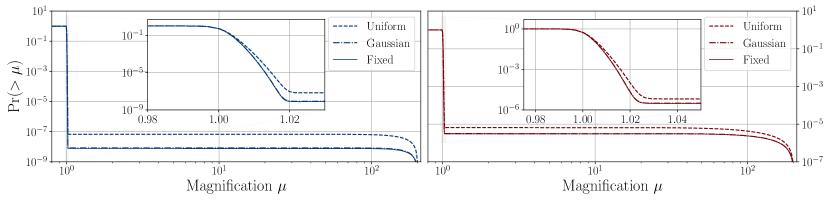
The main result of our calculation is shown in Fig. 1. Here we plot the probability of a BNS event having a magnification above a certain value. Across all three models that we considered for the BNS masses and redshift distribution, the fraction of lensed events with magnification is lower than for the “O1O2” sensitivity. We find it extremely unlikely on statistical ground that a significantly lensed binary neutron star will be observed in the near future. These complementary cumulative distributions shows a large drop just above and then a very prominent plateau out to magnifications of before dropping to zero. This behaviour can be understood by looking at the contribution of lensed events broken down by redshift as shown in Fig. 2. The main contribution to the observed BNS population (left blob in the plots of Fig. 2) gives the high probability near . The gap at intermediate redshifts visible is responsible for the plateau. And finally, in our model, there are no events with , and this is responsible for the final drop off.
At design sensitivity we expect a slightly higher fraction of lensed events (). This can be seen in right panel of Fig. 1 where a non detection of a stochastic signal yields a higher value for the plateau.
IV Discussion
A SGWB from BNS events has not yet been observed and is expected to be subdominant with respect to the background from BBH events. The current non-detection places a constraint on the redshift evolution of the BNS merger rate; in particular it limits the rise in the rate at redshifts around . This in turn has important implications for the lensing of individual BNS events. Here, we have used the current non-detection of a SGWB to constrain the probability that an individual BNS event is magnified by more than a certain amount. In particular we find that the probability that is less than . This probability increases slightly for detectors upgraded towards design sensitivity, but remains small. Therefore significantly lensed BNS events should not be expected in the near future.
Acknowledgements.
The authors thanks Matteo Bianconi for useful comments. AV acknowledges the support of the Royal Society and Wolfson Foundation. PS acknowledges NWO Veni Grant No. 680-47-460. Computational work was performed using the University of Birmingham’s BlueBEAR HPC service.References
- Buscicchio et al. (2020) R. Buscicchio, C. J. Moore, G. Pratten, P. Schmidt, et al., Phys. Rev. Lett. 125, 141102 (2020), arXiv:2006.04516 [astro-ph.CO] .
- Abbott et al. (2017) B. P. Abbott, R. Abbott, T. D. Abbott, et al., Phys. Rev. Lett. 119, 161101 (2017), arXiv:1710.05832 [gr-qc] .
- Abbott et al. (2020a) B. P. Abbott, R. Abbott, T. D. Abbott, et al., ApJ 892, L3 (2020a), arXiv:2001.01761 [astro-ph.HE] .
- Abbott et al. (2020b) R. Abbott, T. D. Abbott, S. Abraham, et al., ApJ 896, L44 (2020b), arXiv:2006.12611 [astro-ph.HE] .
- Abbott et al. (2018a) B. P. Abbott, R. Abbott, T. D. Abbott, et al., LRR 21, 3 (2018a), arXiv:1304.0670 [gr-qc] .
- Finn and Chernoff (1993) L. S. Finn and D. F. Chernoff, Phys. Rev. D 47, 2198 (1993), arXiv:gr-qc/9301003 [gr-qc] .
- Cutler and Flanagan (1994) C. Cutler and É. E. Flanagan, Phys. Rev. D 49, 2658 (1994), arXiv:gr-qc/9402014 [gr-qc] .
- Abbott et al. (2019a) B. P. Abbott, R. Abbott, T. D. Abbott, et al., Phys. Rev. D 100, 061101 (2019a), arXiv:1903.02886 [gr-qc] .
- Abbott et al. (2018b) B. P. Abbott, R. Abbott, et al., Phys. Rev. Lett. 120, 091101 (2018b), arXiv:1710.05837 [gr-qc] .
- Hernandez Vivanco et al. (2019) F. Hernandez Vivanco, R. Smith, E. Thrane, et al., Phys. Rev. D 100, 043023 (2019), arXiv:1903.05778 [gr-qc] .
- Treu (2010) T. Treu, ARA&A 48, 87 (2010), arXiv:1003.5567 [astro-ph.CO] .
- Dai et al. (2017) L. Dai, T. Venumadhav, and K. Sigurdson, Phys. Rev. D 95, 044011 (2017), arXiv:1605.09398 [astro-ph.CO] .
- Li et al. (2018) S.-S. Li, S. Mao, Y. Zhao, and Y. Lu, MNRAS 476, 2220 (2018), arXiv:1802.05089 [astro-ph.CO] .
- Hannuksela et al. (2019) O. A. Hannuksela, K. Haris, K. K. Y. Ng, et al., ApJ 874, L2 (2019), arXiv:1901.02674 [gr-qc] .
- Dai et al. (2020) L. Dai, B. Zackay, T. Venumadhav, et al., arXiv e-prints (2020), arXiv:2007.12709 [astro-ph.HE] .
- Pang et al. (2020) P. T. H. Pang, O. A. Hannuksela, T. Dietrich, et al., MNRAS 495, 3740 (2020), arXiv:2002.04893 [astro-ph.HE] .
- Mukherjee et al. (2020) S. Mukherjee, T. Broadhurst, J. M. Diego, et al., arXiv e-prints (2020), arXiv:2006.03064 [astro-ph.CO] .
- Abbott et al. (2019b) B. P. Abbott, R. Abbott, et al., Physical Review X 9, 031040 (2019b), arXiv:1811.12907 [astro-ph.HE] .
- Madau and Dickinson (2014) P. Madau and M. Dickinson, ARA&A 52, 415 (2014), arXiv:1403.0007 [astro-ph.CO] .
- Usman et al. (2016) S. A. Usman, A. H. Nitz, I. W. Harry, et al., CQG 33, 215004 (2016), arXiv:1508.02357 [gr-qc] .
- Sachdev et al. (2019) S. Sachdev, S. Caudill, H. Fong, et al., arXiv e-prints (2019), arXiv:1901.08580 [gr-qc] .