Vol.0 (2015) No.0, 000–000
22institutetext: Graduate University of the Chinese Academy of Sciences, Beijing 100049, China
33institutetext: Department of Astronomy, Yunnan University, Kunming 650091, China
Searching for -ray emission from LOTAAS pulsars
Abstract
The LOw-Frequency ARray (LOFAR) has recently conducted a survey (LOFAR Tied-Array All-sky Survey; LOTAAS) for pulsars in the Northern hemisphere that resulted in discoveries of 73 new pulsars. For the purpose of studying the properties of these pulsars, we search for their -ray counterparts using the all-sky survey data obtained with the Large Area Telescope (LAT) onboard the Fermi Gamma-Ray Space Telescope (Fermi). We analyze the LAT data for 70 LOTAAS pulsars (excluding two millisecond pulsars and one with the longest known spin period of 23.5 s). We find one candidate counterpart to PSR J101730, which should be searched for the -ray pulsation signal once its timing solution is available. For other LOTAAS pulsars, we derive their 0.3–500 GeV flux upper limits. In order to compare the LOTAAS pulsars with the known -ray pulsars, we also derive the 0.3–500 GeV -ray fluxes for 112 of the latter contained in the Fermi LAT fourth source catalog. Based on the properties of the -ray pulsars, we derive upper limits on the spin-down luminosities of the LOTAAS pulsars. The upper limits are not very constraining but help suggest that most of the LOTAAS pulsars probably have erg s-1 spin-down luminosities and are not expected to be detectable with Fermi LAT.
keywords:
stars: pulsars — stars: neutron — gamma rays: stars1 Introduction
Since the discovery of the first radio pulsar signal in 1967 (Hewish et al., 1968), nearly 3000 pulsars have been found (Manchester et al., 2005), resulting from different surveys mainly at radio bands. Among them, approximately 2000 are “young” radio pulsars (in this paper, “young” pulsars are used to distinguish them from most of the others, the old “recycled” millisecond pulsars; MSPs). These pulsars are believed to be born in supernova explosions, while in total there are possibly 100,000 of them in our Galaxy (e.g., Swiggum et al. 2014). The new generation radio telescopes such as the Five-hundred-meter Aperture Spherical Telescope (FAST) and the near-future Square Kilometer Array (SKA) will potentially be able to find and study most of these pulsars (e.g., Qian et al. 2019; Keane et al. 2015) and thus lead to a more complete understanding of the physical properties of the radio pulsar population.
Recently, a survey for radio pulsars in the Northern hemisphere at the very low frequency range of 119–151 MHz was carried out with the LOw-Frequency ARray (LOFAR; van Haarlem et al. 2013). This LOFAR Tied-Array All-sky Survey (LOTAAS) has resulted in the discovery of 73 new radio pulsars (Sanidas et al., 2019). These LOTAAS pulsars probably represent a sample of pulsars that are bright at low frequencies and are found to have longer spin periods than the known young pulsar population. It is thus interesting to study their overall properties, checking if there are any other differences between them and the known young pulsar population or other pulsar groups based on survey methods.
From the beginning of the -ray astronomy, it has been learnt and pointed out that pulsars are potential high-energy objects with -rays emitted from the magnetosphere due to their high surface magnetic fields (e.g., Romani & Yadigaroglu 1995). Observations conducted with The Fermi Gamma-Ray Space Telescope (Fermi), which was launched in 2008, have confirmed that pulsars are the dominant -ray sources in our Galaxy (Abdo et al., 2013). The Large Area Telescope (LAT) onboard Fermi has been scanning the whole sky at the energy band of 0.1–500 GeV and thus far 253 pulsars, according to the latest results provided by the Fermi LAT Multiwavelength Coordinating Group (MCG)111https://confluence.slac.stanford.edu/display/GLAMCOG/Public+List+of+LAT-Detected+Gamma-Ray+Pulsars, have been detected with pulsed -ray emission. Among them, 135 are young pulsars. The -ray properties of these pulsars allow a deep probe into the emission mechanism of pulsars (e.g., Pierbattista et al. 2012).
Taking advantage of the all-sky -ray data collected by LAT, we carried out the search for -ray counterparts to the LOTAAS pulsars. The results of any detection or upper limits provide constraints on properties of this very low-frequency pulsar sample. In this paper, we report the results from our search. Below in Section 2, we describe the analysis of the Fermi LAT data and provide the results. In Section 3, we discuss the implication of the results.
2 LAT Data Analysis and Results
2.1 LAT data and source models
LAT is a -ray imaging instrument that continuously scans the whole sky in the GeV band (Atwood et al., 2009). In the analysis, we selected 0.1–500 GeV LAT events inside a region centered at the position of each of our targets. The time period of the LAT data was from 2008-08-04 15:43:36 (UTC) to 2019-08-14 02:23:15 (UTC). The updated Fermi Pass 8 database was used. Following the recommendations of the LAT team222http://fermi.gsfc.nasa.gov/ssc/data/analysis/scitools/, we excluded the events with zenith angles larger than 90 degrees (to prevent the Earth’s limb contamination) and with quality flags of ‘bad’.
For each of the targets, we constructed a source model. The sources, which are listed in the Fermi LAT fourth source catalog (4FGL; Abdollahi et al. 2020) and within a 20 degree radius circular region from a target, were included in the source model. The spectral forms of the sources are provided in 4FGL. In our analysis, we set the spectral parameters of the sources within 5 degrees of a target as free parameters, and fixed the other parameters at their catalog values. The background Galactic and extragalactic diffuse spectral models gll_iem_v07.fits and the file iso_P8R3_SOURCE_V2_v1.txt, respectively, were also included in the source model, and the normalizations of the two models were set as free parameters.
2.2 LOTAAS pulsars
Among the 73 radio pulsars discovered by LOTAAS, two are MSPs and PSR J0250+58 has the longest spin period ( s) among the known pulsars (Sanidas et al., 2019). We excluded these three pulsars from our target list; the former are presumably exceptions in the LOTAAS pulsar sample and the latter was studied in detail by Tan et al. (2018). Assuming power-law emission for each of the LOTAAS pulsars in the source models at their positions given in Sanidas et al. (2019), we performed standard binned likelihood analysis of the LAT data using Fermitools. To avoid the relatively large uncertainties of the instrument response function of LAT and the strong background emission (or possible contamination from nearby sources) in the Galactic plane in the low energy range of GeV, we included events in the energy range of 0.3–500 GeV for the likelihood analysis. We re-fit the source models using gtlike to the LAT data. With the fitted source models, the Test Statistic (TS) map of a region centered at each of the pulsar targets was calculated (using gttsmap). All the catalog sources were included in the source models. A TS value at a given position is a measurement of the fit improvement for including a source at the position, and is approximately the square of the detection significance of the source (Abdollahi et al., 2020). From the TS maps, we found only two possibly detected sources near the positions of PSR J101730 and PSR J171546. For the other 68 targets without any significantly detected sources at their positions, we derived 95% flux upper limits, which are given in Table LABEL:tab1.
| Source | R.A. | Decl. | Flux/10-13 |
|---|---|---|---|
| name | (h:m) | (∘:′) | (erg cm-2 s-1) |
| J003935 | 00:39.1 | +35:45 | 6.3 |
| J005969 | 00:59.5 | +69:55 | 14 |
| J010080 | 01:00.3 | +80:22 | 4.4 |
| J010713 | 01:07.6 | +13:25 | 3.1 |
| J011563 | 01:15.6 | +63:24 | 6.1 |
| J0121+14 | 01:22.0 | 14:16 | 8.4 |
| J013933 | 01:40.0 | +33:37 | 2.0 |
| J021058 | 02:11.0 | +58:44 | 11 |
| J030222 | 03:02.5 | +22:50 | 1.5 |
| J030511 | 03:05.1 | +11:23 | 4.9 |
| J031713 | 03:17.9 | +13:29 | 5.3 |
| J034923 | 03:49.9 | +23:41 | 15 |
| J042132 | 04:21.4 | +32:54 | 17 |
| J045445 | 04:54.9 | +45:28 | 15 |
| J051851 | 05:18.3 | +51:25 | 4.1 |
| J074243 | 07:42.6 | +43:33 | 1.9 |
| J081137 | 08:11.2 | +37:28 | 1.8 |
| J0813+22 | 08:13.9 | 22:01 | 2.2 |
| J085733 | 08:57.8 | +33:48 | 4.5 |
| J092830 | 09:29.0 | +30:38 | 3.9 |
| J093533 | 09:35.1 | +33:11 | 0.88 |
| J122600 | 12:26.2 | +00:03 | 7.1 |
| J123502 | 12:35.9 | -02:05 | 5.8 |
| J130338 | 13:03.3 | +38:13 | 4.1 |
| J133410 | 13:34.5 | +10:05 | 3.3 |
| J134466 | 13:43.9 | +66:33 | 14 |
| J140411 | 14:04.6 | +11:57 | 2.6 |
| J142652 | 14:27.0 | +52:10 | 1.7 |
| J152940 | 15:29.2 | +40:49 | 9.4 |
| J162358 | 16:23.8 | +58:49 | 1.3 |
| J163523 | 16:35.1 | +23:31 | 1.8 |
| J163840 | 16:38.8 | +40:05 | 8.5 |
| J164313 | 16:43.8 | +13:25 | 3.8 |
| J165562 | 16:55.9 | +62:02 | 2.0 |
| J165733 | 16:57.7 | +33:03 | 6.1 |
| J170735 | 17:07.0 | +35:56 | 6.5 |
| J171378 | 17:13.5 | +78:09 | 2.2 |
| J172235 | 17:22.1 | +35:18 | 3.9 |
| J173563 | 17:35.1 | +63:19 | 2.3 |
| J174027 | 17:40.5 | +27:13 | 8.5 |
| J174138 | 17:41.2 | +38:54 | 7.4 |
| J174512 | 17:45.7 | +12:51 | 3.3 |
| J174542 | 17:45.8 | +42:53 | 8.9 |
| J174959 | 17:49.6 | +59:51 | 1.5 |
| J180917 | 18:09.1 | +17:04 | 15 |
| J181007 | 18:10.7 | +07:03 | 2.9 |
| J181422 | 18:14.6 | +22:23 | 12 |
| J184815 | 18:48.9 | +15:17 | 4.9 |
| J184925 | 18:49.8 | +25:58 | 14 |
| J191056 | 19:10.7 | +56:55 | 0.82 |
| J191632 | 19:16.1 | +32:24 | 6.8 |
| J193353 | 19:33.0 | +53:32 | 2.7 |
| J195330 | 19:53.8 | +30:13 | 3.0 |
| J195700 | 19:57.6 | 00:01 | 2.3 |
| J195856 | 19:58.0 | +56:49 | 8.3 |
| J200622 | 20:06.6 | +22:04 | 3.2 |
| J202221 | 20:22.4 | +21:11 | 2.3 |
| J203666 | 20:36.8 | +66:44 | 8.3 |
| J205112 | 20:51.4 | +12:48 | 2.8 |
| J205317 | 20:53.8 | +17:18 | 16 |
| J205721 | 20:57.8 | +21:26 | 14 |
| J212224 | 21:22.7 | +24:24 | 11 |
| J212336 | 21:23.8 | +36:24 | 3.4 |
| J220922 | 22:09.9 | +21:17 | 1.6 |
| J230631 | 23:06.2 | +31:23 | 6.1 |
| J232947 | 23:29.6 | +47:42 | 2.7 |
| J233601 | 23:36.6 | 01:51 | 12 |
| J235031 | 23:50.7 | +31:39 | 4.9 |
2.2.1 PSR J1017+30
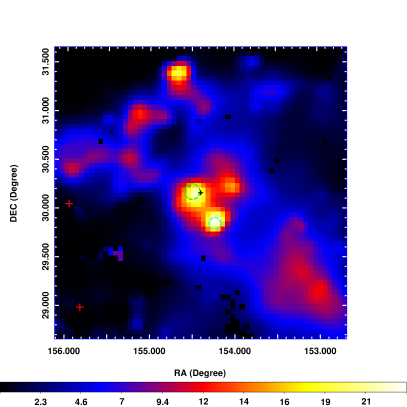
There are two -ray sources, clearly separated with each other, near the position of PSR J101730 with TS values of 22 (Figure 1). We ran gtfindsrc in Fermitools to determine their positions and obtained R.A.=154\fdg50, Decl.=30\fdg18 (equinox J2000.0) for the northeast (NE) one and R.A.=154\fdg23, Decl.=29\fdg85 (equinox J2000.0) for the southwest (SW) one. The 1 nominal uncertainties are 0\fdg05 and 0\fdg04, respectively. PSR J101730 is 0\fdg09 away from the position of the NE source, but given the positional uncertainty of 3′ in the LOTAAS survey (Sanidas et al., 2019), the two sources match in position (see Figure 1), i.e., the NE source could be the -ray counterpart to PSR J101730.
Including the NE and SW sources in the source model, we re-performed the likelihood analysis to the 0.3–500 GeV data, in which a power law was assumed for the two sources. Note that pulsars’ -ray emission can generally be described with an exponentially cutoff power law (Abdo et al., 2013), but since the detection significance of the NE source was low, we chose to use a simple power law instead (we tested the former model, but no higher significant results were obtained). We obtained 0.3 and photons s-1 cm-2 for the NE source with a TS value of 15 (0.3, photons s-1 cm-2 for the SW source with a TS value of 16). We also tested to use the data from 0.1 GeV, was nearly the same but the flux was increased to photons s-1 cm-2 and TS Therefore the NE source was detected at .
We extracted the -ray spectra of the NE source by performing maximum likelihood analysis of the LAT data in 10 evenly divided energy bands in logarithm from 0.1–500 GeV. In the extraction, the spectral normalizations of the sources within 5 degree from it were set as free parameters, while all the other parameters of the sources were fixed at the values obtained from the above maximum likelihood analysis. For the results, we kept only spectral data points when TS is greater than 5 (2 significance) and derived 95% flux upper limits otherwise. The flux and TS values of the spectral data points are provided in Table 2.
| PSR J101730 | PSR J171546 | ||||
| Band | TS | TS | |||
| (GeV) | (GeV) | (erg cm-2 s-1) | (erg cm-2 s-1) | ||
| 0.15 | 0.1–0.2 | 0.90.5 | 9 | 1.6 | 2 |
| 0.36 | 0.2–0.5 | 0.8 | 2 | 0.7 | 4 |
| 0.84 | 0.5–1.3 | 0.3 | 2 | 0.2 | 0 |
| 1.97 | 1.3–3.0 | 0.2 | 2 | 0.2 | 2 |
| 4.62 | 3.0–7.1 | 0.140.08 | 5 | 0.1 | 0 |
| 10.83 | 7.1–16.6 | 0.2 | 1 | 0.2 | 0 |
| 25.37 | 16.6–38.8 | 0.4 | 3 | 0.50.2 | 17 |
| 59.46 | 38.8–91.0 | 0.3 | 0 | 0.3 | 0 |
| 139.36 | 91.0–213.3 | 0.8 | 0 | 2.0 | 2 |
| 326.60 | 213.3–500.0 | 1.9 | 0 | 1.6 | 0 |
Note: is the energy flux (). Fluxes without uncertainties are the 95 upper limits.
Since pulsars’ -ray emission is stable (Abdo et al., 2013), we checked the long-term variability of the NE source by calculating its variability index TSvar. Following the procedure introduced in Nolan et al. (2012), we derived fluxes of 14 time bins for its -ray emission, with each bin containing 300-day data. If the fluxes are constant, TSvar would be distributed as with 13 degrees of freedom. Variable sources would be identified with TSvar larger than 27.7 (at a 99% confidence level). The computed TSvar for the NE source is 8.1, indicating that there was no significant long-term variability in its -ray emission.
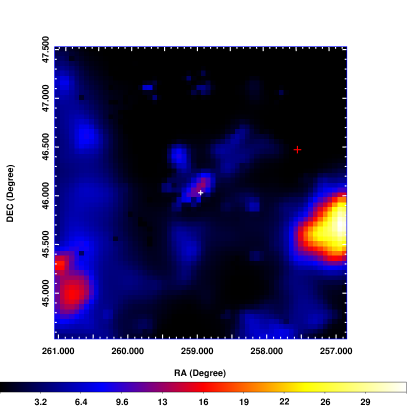
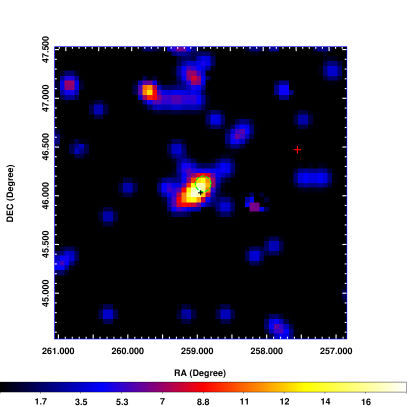
2.2.2 PSR J1715+46
The 0.3–500 GeV -ray emission near the position of PSR J171546 only had TS12 (left panel of Figure 2), but detailed analysis indicated that it was more significant in a high energy range of 16 GeV. We thus calculated the 16–210 GeV TS map of a region centered at PSR J171546 and a TS value of was found (right panel of Figure 2). We ran gtfindsrc to determine the position and obtained R.A.=258\fdg91, Decl.=46\fdg14 (equinox J2000.0) with a 1 nominal uncertainty of 0\fdg05. PSR J171546 is 0\fdg09 away from this position. Considering 3′ positional uncertainty of the radio position, the pulsar matches in position with the -ray source. Using the -ray position, we re-performed the likelihood analysis. The obtained results were 0.3, photons s-1 cm-2 in the 0.3–500 GeV band (with a TS value of 14), or 0.2, photons s-1 cm-2 in the 16–210 GeV band (with a TS value of 16).
Similarly to analysis to the data of PSR J101730, we also extracted the -ray spectrum of PSR J171546 and searched for its long-term variability. The obtained spectral data points are provided in Table 2. We note that the -ray emission was only significantly detected in 16.6–38.8 GeV band with a TS value of 17. The computed TSvar for PSR J171546 in 16–210 GeV band is 15.3, indicating that there was no significant long-term variability in the -ray source.
3 Discussion
Having analyzed Fermi LAT data for 70 young pulsars discovered by LOTAAS, we have found that at the positions of two of them, PSR J101730 and PSR J171546, there was a -ray source respectively. The two sources were faint, and the detection significances were only . For the -ray source to PSR J171546, our spectral analysis showed that the detection was mostly at the energy range of 16–39 GeV. Such emission is not consistent with the general -ray properties of pulsars, as most of their spectra have an exponential cutoff at several GeV (Abdo et al., 2013). Therefore we only suggest the -ray source at the position of PSR J101730 as a candidate counterpart. In the near future, once the timing solution of PSR J101730 is obtained, further data analysis to search for the pulsation signal at -rays would be able to verify if it is the counterpart. For PSR J171546, we derived its 0.3–500 GeV flux upper limit, which is erg cm2 s-1.
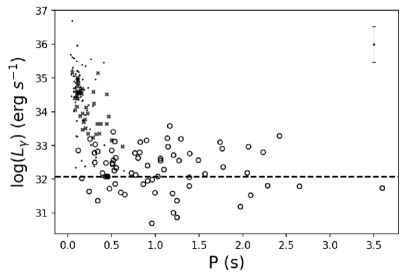
Because of the lack of the period derivatives of the LOTAAS pulsars, their properties such as the spin-down luminosities and surface magnetic fields can not be estimated. In Figure 3, we show of the known -ray pulsars and the luminosity upper limits obtained for the LOTAAS pulsars, where for the former see appendix A and for the latter their distances were estimated from the dispersion measures (Sanidas et al., 2019). The former have erg s-1 and spin period s, where 41 of the gu pulsars have questionable distance values (marked with crosses in Figure 3; see appendix A). We note that the sensitivity limit of the Fermi LAT survey is approximately erg cm-2 s-1 (Abdollahi et al., 2020), and assuming 1 kpc distance for a pulsar, the luminosity limit would be erg s-1. Thus the -ray pulsar detection has reached this indicative limit (Figure 3). For a few LOTAAS pulsars, the upper limits are below erg s-1, and several of them have s. The comparison shows that our search is likely sensitive enough and should have been able to detect some of the LOTAAS pulsars if they have -ray emission similar to those of the -ray pulsars. It is interesting to note that PSR J101730 is right at the range bottom for the -ray pulsars, which helps not rule out our identification of its -ray counterpart.
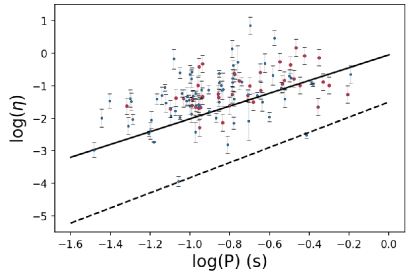
For -ray pulsars, relationship is often considered (Pierbattista et al., 2012; Abdo et al., 2013). Thus -ray efficiency . Since for pulsars , and considering magnetic dipole radiation from pulsars (e.g., Lyne & Graham-Smith 2012), , we can find and . In Figure 4, we show and of the -ray pulsars. A possible trend between them is seen. We test to fit the data points with function , and obtain and , where 41 gu pulsars with questionable distances were not included in the fitting. This possible trend is close to the relationship as well as predicted from considering curvature radiation from -ray pulsars (see details in Kalapotharakos et al. 2019), while note that is unknown and probably around 1012 G. However, since at any given , there is a large scatter in , the fit is not good (with reduced ). We find that we may define a lower limit line to the data points with (Figure 4), for which we specifically require to match the theoretical prediction of curvature radiation from pulsars.
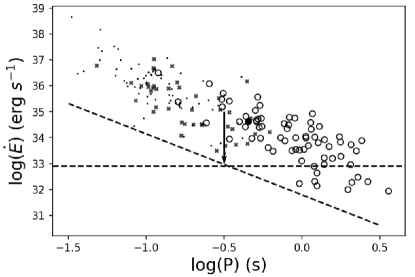
Using this lower limit, we may set constraints on of the LOTAAS pulsars. Since , where is the -ray luminosity upper limits for the LOTAAS pulsars, we then have . With the lower limit relationship given above, the upper limits on of the LOTAAS pulsars are calculated, which are shown in Figure 5. In this calculation for PSR J101730, the luminosity of the candidate -ray counterpart is used. For comparison, we also include of the -ray pulsars in the figure. The -ray pulsars generally have erg s-1, and a death line around this value for -ray emission of pulsars has been considered (Wang & Hirotani, 2011; Smith et al., 2019). Most of the LOTAAS pulsars have upper limits above this value, and are mixed with the -ray pulsars in Figure 5. However because of the large scatters of , for example, the solid line possibly describing and of the -ray pulsars in Figure 4 would increase 100 times and thus lower of the LOTAAS pulsars 100 times correspondingly, which will move most the LOTAAS pulsars below erg s-1. In addition, considering the indicative luminosity limit of the LAT survey for pulsars and still using this relationship, we have , which is shown in Figure 5. Most of the LOTAAS pulsars will also be moved below this detection line. Therefore it is possible that most of the LOTAAS pulsars could have low and thus low -ray emission, not to be expected detectable with Fermi LAT.
As a summary, we have conducted analysis of the Fermi LAT data to search for -ray emission from the newly discovered 70 LOTAAS pulsars, and only found a candidate counterpart to one of them, PSR J101730. For this pulsar, once its long-term timing solution is obtained, a search for its pulsation signal in the -ray emission of the candidate can be conducted for the purpose of verifying if it is the -ray counterpart. We provide the 0.3–500 GeV flux upper limits for the non-detections. By comparing the LOTAAS pulsars with the known -ray pulsars, we estimate the upper limits for the LOTAAS pulsars. The upper limits are not very constraining, and it is likely that most of the LOTAAS pulsars have low, erg s-1 and are not expected to have detectable -ray emission.
Acknowledgements.
We thank anonymous referees for very helpful suggestions. This research made use of the High Performance Computing Resource in the Core Facility for Advanced Research Computing at Shanghai Astronomical Observatory. This research was supported by the National Program on Key Research and Development Project (Grant No. 2016YFA0400804) and the National Natural Science Foundation of China (11633007, U1738131). Z.W. acknowledges the support by the Original Innovation Program of the Chinese Academy of Sciences (E085021002).Appendix A Known -ray pulsars
There are 121 young -ray pulsars listed in 4FGL (Abdollahi et al., 2020). Searching in the Australia Telescope National Facility (ATNF) pulsar catalog (Manchester et al., 2005) and references provided at MCG, we found distance values for 112 of them, which are given in Table LABEL:tab:gr. However it can be noted that 53 of 121 -ray pulsars are marked with ‘gu’ at MCG, which indicates that these pulsars were discovered in LAT data and/or using an LAT seed position. As most of the gu pulsars have not been detected at radio frequencies, they are probably assigned with ‘heuristic’ distances (see Abdo et al. 2013). We searched references for gu pulsars in Table LABEL:tab:gr and found no radio detection reported for 41 of them. To be cautious, we marked these 41 gu pulsars in Table LABEL:tab:gr with , indicating that their distance values are questionable.
Using the spectral parameters given in 4FGL, we derived 0.3–500 GeV flux . For the pulsars without distance uncertainties, we assumed 30% uncertainties (e.g., Camilo et al. 2009). We calculated the luminosities from , where is the distance and is the beam correction factor. Following Abdo et al. (2013), we adopted . {ThreePartTable} {TableNotes}
Distances without errors are assumed to have 30% uncertainties.
-ray pulsars without (reported) radio detection.
| Source | P | Distancea | /1033 | Flux/10-12 | Luminosity |
|---|---|---|---|---|---|
| name | (s) | (kpc) | (erg s-1) | (erg cm-2 s-1) | (1033erg s-1) |
| J00026216g | 0.12 | 6.36 | 150 | 14.71.2 | 7143 |
| J00077303 | 0.32 | 1.40.3 | 450 | 387.23.1 | 9139 |
| J01064855 | 0.083 | 3.11.1 | 29 | 17.50.8 | 2014 |
| J02056449 | 0.066 | 1.950.04 | 27000 | 40.81.1 | 49.92.5 |
| J02486021 | 0.22 | 2.00.2 | 210 | 22.51.3 | 10.82.2 |
| J03573205g | 0.44 | 0.83 | 5.9 | 53.11.0 | 4.42.6 |
| J03595414g | 0.079 | 3.45 | 1300 | 17.71.3 | 2515 |
| J05144408 | 0.32 | 0.97 | 2.5 | 3.90.3 | 0.430.27 |
| J05342200 | 0.033 | 20.5 | 460000 | 100017 | 490240 |
| J05406919 | 0.051 | 49.7 | 150000 | 17.01.1 | 50303034 |
| J05543107g | 0.46 | 1.9 | 56 | 17.00.7 | 7.34.4 |
| J06223749g | 0.33 | 1.6 | 27 | 14.30.6 | 4.42.6 |
| J06310646g | 0.11 | 4.58 | 100 | 15.31.4 | 3823 |
| J06311036 | 0.29 | 1.00.2 | 170 | 27.91.2 | 14.75.9 |
| J06330632g | 0.30 | 1.35 | 120 | 80.92.3 | 1811 |
| J06331746 | 0.24 | 0.250.08 | 32 | 370011 | 1610 |
| J06591414 | 0.38 | 0.290.03 | 38 | 11.30.4 | 0.1140.024 |
| J07291448 | 0.25 | 3.50.4 | 280 | 3.60.8 | 3.11.0 |
| J07422822 | 0.17 | 2.10.5 | 140 | 11.61.0 | 5.52.7 |
| J08354510 | 0.089 | 0.280.02 | 6900 | 770027 | 7210 |
| J09084913 | 0.11 | 2.60.9 | 490 | 15.52.5 | 2.51.3 |
| J09405428 | 0.088 | 3.00.5 | 1900 | 12.6.9 | 0.2180.074 |
| J10165857 | 0.11 | 2.90.6 | 2600 | 54.23.6 | 6527 |
| J10195749 | 0.16 | 10.91 | 180 | 17.32.3 | 250150 |
| J10235746g | 0.11 | 2.08 | 11000 | 111.76.9 | 5835 |
| J10285819 | 0.091 | 2.30.3 | 840 | 204.24.7 | 4913 |
| J10445737g | 0.14 | 1.9 | 800 | 82.32.6 | 3621 |
| J10485832 | 0.12 | 2.70.4 | 2000 | 150.43.3 | 15091 |
| J10556028 | 0.10 | 3.83 | 1200 | 16.61.7 | 2918 |
| J10575226 | 0.20 | 0.30.2 | 30 | 252.82.3 | 0.240.33 |
| J10575851g | 0.62 | 0.8 | 17 | 12.010.88 | 0.920.56 |
| J11056037g | 0.19 | 1.53 | 120 | 21.41.7 | 6.03.6 |
| J11056107 | 0.063 | 51 | 2500 | 15.72.0 | 10.44.4 |
| J11126103 | 0.064 | 4.5 | 4500 | 16.42.8 | 4025 |
| J11196127 | 0.41 | 8.40.4 | 2300 | 33.52.1 | 28032 |
| J11245916 | 0.14 | 4.80.7 | 12000 | 41.61.6 | 12037 |
| J11516108 | 0.10 | 2.22 | 390 | 9.040.93 | 5.33.2 |
| J12086238g | 0.44 | 3 | 1500 | 30.82.5 | 3320 |
| J12535820 | 0.26 | 1.64 | 5 | 3.260.99 | 1.050.71 |
| J13416220 | 0.19 | 12.6 | 1400 | 16.92.8 | 320199 |
| J13506225g | 0.14 | 1.3 | 130 | 36.92.3 | 7.44.5 |
| J13576429 | 0.17 | 2.50.5 | 3100 | 19.31.3 | 22.220.90 |
| J14106132 | 0.050 | 15.64.2 | 10000 | 18.94.7 | 410240 |
| J14136205g | 0.11 | 2.15 | 830 | 155.34.8 | 8652 |
| J14186058g | 0.11 | 1.60.7 | 4900 | 24012 | 10091 |
| J14206048 | 0.068 | 5.60.9 | 10000 | 10011 | 390130 |
| J14226138g | 0.34 | 4.8 | 96 | 51.92.7 | 14086 |
| J14295911g | 0.12 | 1.95 | 770 | 81.04.3 | 3722 |
| J14596053g | 0.10 | 1.84 | 910 | 86.22.3 | 3521 |
| J15095850 | 0.089 | 2.60.5 | 520 | 97.22.8 | 13051 |
| J15225735g | 0.10 | 2.1 | 1200 | 55.82.6 | 2918 |
| J15285838g | 0.36 | 1.1 | 22 | 15.41.3 | 2.21.4 |
| J15315610 | 0.084 | 2.10.3 | 900 | 15.71.9 | 15.19.3 |
| J16145048 | 0.23 | 5.15 | 1600 | 16.24.4 | 5234 |
| J16235005g | 0.085 | 1.3 | 270 | 5.63.3 | 11.46.9 |
| J16244041g | 0.17 | 1.8 | 39 | 23.11.1 | 8.95.4 |
| J16484611 | 0.16 | 4.50.7 | 210 | 37.72.2 | 9028 |
| J17024128 | 0.18 | 4.80.6 | 340 | 24.24.0 | 4514 |
| J17051906 | 0.30 | 0.75 | 6.1 | 3.640.46 | 0.240.15 |
| J17094429 | 0.10 | 2.30.3 | 1153.28.0 | 930240 | |
| J17183825 | 0.075 | 3.60.4 | 1300 | 79.74.8 | 12027 |
| J17303350 | 0.14 | 3.49 | 1200 | 26.14.9 | 3824 |
| J17323131 | 0.20 | 0.60.1 | 150 | 166.73.4 | 8.22.7 |
| J17393023 | 0.11 | 3.07 | 300 | 20.03.2 | 2314 |
| J17401000 | 0.15 | 1.23 | 230 | 1.950.37 | 0.350.22 |
| J17412054 | 0.41 | 0.380.02 | 9.5 | 96.31.9 | 1.040.11 |
| J17463239g | 0.20 | 0.8 | 33 | 42.52.6 | 3.32.0 |
| J17472958 | 0.10 | 4.80.8 | 2500 | 121.36.7 | 92.131.1 |
| J18012451 | 0.12 | 5.20.5 | 2600 | 24.22.6 | 41.89.2 |
| J18032149g | 0.11 | 1.3 | 640 | 69.83.8 | 14.18.5 |
| J18092332 | 0.15 | 1.71.0 | 430 | 362.36.2 | 3439 |
| J18131246g | 0.048 | 2.63 | 6200 | 177.24.1 | 15088 |
| J18261256 | 0.11 | 1.55 | 3600 | 340.08.8 | 9859 |
| J18271446g | 0.50 | 0.7 | 14 | 24.71.7 | 1.440.88 |
| J18281101 | 0.072 | 4.77 | 1600 | 29.65.0 | 80.350.1 |
| J18331034 | 0.062 | 4.70.4 | 34000 | 56.44.6 | 11021 |
| J18365925 | 0.17 | 0.50.3 | 11 | 537.72.9 | 5.87.0 |
| J18370604 | 0.096 | 4.77 | 2000 | 35.25.8 | 9660 |
| J18380537g | 0.15 | 2 | 5900 | 9.11.0 | 4427 |
| J18440346g | 0.11 | 4.3 | 4300 | 41.82.8 | 9256 |
| J18460919g | 0.23 | 1.53 | 34 | 32.01.0 | 8.95.4 |
| J18530004 | 0.10 | 5.34 | 210 | 10.21.7 | 3522 |
| J18570143 | 0.14 | 4.57 | 450 | 22.33.6 | 5635 |
| J19060722g | 0.11 | 1.91 | 1000 | 55.55.6 | 2415 |
| J19070602 | 0.11 | 3.20.3 | 2800 | 240.95.2 | 16031 |
| J19130904 | 0.16 | 3 | 160 | 19.31.9 | 2113 |
| J19131011 | 0.036 | 4.61 | 2900 | 11.52.5 | 2919 |
| J19251720 | 0.076 | 5.06 | 950 | 9.11.5 | 2817 |
| J19321916g | 0.21 | 1.5 | 410 | 48.93.5 | 13.17.9 |
| J19322220 | 0.14 | 10.9 | 750 | 3.840.98 | 5536 |
| J19352025 | 0.08 | 4.6 | 4600 | 21.51.9 | 5433 |
| J19523252 | 0.039 | 2.00.5 | 3700 | 118.42.3 | 12064 |
| J19542836g | 0.092 | 1.96 | 1000 | 8.82.9 | 4124 |
| J19575033g | 0.37 | 1.36 | 5.3 | 20.10.63 | 4.42.7 |
| J19582846g | 0.29 | 1.95 | 340 | 86.32.8 | 3924 |
| J20063102 | 0.16 | 6.03 | 220 | 8.71.4 | 3824 |
| J20173625g | 0.17 | 0.656 | 12 | 56.83.8 | 2.91.8 |
| J20213651 | 0.10 | 102 | 3400 | 424.15.4 | 16066 |
| J20223842 | 0.08 | 4.6 | 4700 | 14.52.1 | 170110 |
| J20214026 | 0.27 | 1.50.4 | 120 | 645.58.8 | 360190 |
| J20283332g | 0.18 | 0.9 | 35 | 51.51.5 | 5.03.0 |
| J20303641 | 0.20 | 31 | 32 | 39.21.8 | 230140 |
| J20304415g | 0.23 | 0.72 | 32 | 36.71.5 | 2.31.4 |
| J20324127 | 0.14 | 3.70.6 | 270 | 130.73.8 | 27.69.0 |
| J20432740 | 0.096 | 1.80.3 | 56 | 7.220.52 | 1.890.64 |
| J20552539g | 0.32 | 0.62 | 4.9 | 46.590.96 | 2.11.3 |
| J21114606g | 0.16 | 2.7 | 1400 | 39.61.2 | 3521 |
| J21394716g | 0.28 | 0.8 | 3.1 | 22.480.98 | 1.71.0 |
| J22084056 | 0.64 | 0.75 | 0.81 | 2.680.43 | 0.180.11 |
| J22296114 | 0.052 | 0.80.15 | 22000 | 187.82.7 | 20076 |
| J22385903g | 0.16 | 2.83 | 890 | 49.71.6 | 47.628.6 |
| J22405832 | 0.14 | 7.70.7 | 220 | 8.41.0 | 5312 |
| \insertTableNotes |
References
- Abdo et al. (2013) Abdo, A. A., Ajello, M., Allafort, A., et al. 2013, ApJS, 208, 17
- Abdollahi et al. (2020) Abdollahi, S., Acero, F., Ackermann, M., et al. 2020, ApJS, 247, 33
- Atwood et al. (2009) Atwood, W. B., Abdo, A. A., Ackermann, M., et al. 2009, ApJ, 697, 1071
- Camilo et al. (2009) Camilo, F., Ng, C. Y., Gaensler, B. M., et al. 2009, ApJ, 703, L55
- Hewish et al. (1968) Hewish, A., Bell, S. J., Pilkington, J. D. H., Scott, P. F., & Collins, R. A. 1968, Nature, 217, 709
- Kalapotharakos et al. (2019) Kalapotharakos, C., Harding, A. K., Kazanas, D., et al. 2019, ApJ, 883, L4
- Keane et al. (2015) Keane, E., Bhattacharyya, B., Kramer, M., et al. 2015, in Advancing Astrophysics with the Square Kilometre Array (AASKA14), 40
- Lyne & Graham-Smith (2012) Lyne, A., & Graham-Smith, F. 2012, Pulsar Astronomy
- Manchester et al. (2005) Manchester, R. N., Hobbs, G. B., Teoh, A., & Hobbs, M. 2005, AJ, 129, 1993
- Nolan et al. (2012) Nolan, P. L., Abdo, A. A., Ackermann, M., et al. 2012, ApJS, 199, 31
- Pierbattista et al. (2012) Pierbattista, M., Grenier, I. A., Harding, A. K., & Gonthier, P. L. 2012, A&A, 545, A42
- Qian et al. (2019) Qian, L., Pan, Z., Li, D., et al. 2019, Science China Physics, Mechanics, and Astronomy, 62, 959508
- Romani & Yadigaroglu (1995) Romani, R. W., & Yadigaroglu, I. A. 1995, ApJ, 438, 314
- Sanidas et al. (2019) Sanidas, S., Cooper, S., Bassa, C. G., et al. 2019, A&A, 626, A104
- Smith et al. (2019) Smith, D. A., Bruel, P., Cognard, I., et al. 2019, ApJ, 871, 78
- Swiggum et al. (2014) Swiggum, J. K., Lorimer, D. R., McLaughlin, M. A., et al. 2014, ApJ, 787, 137
- Tan et al. (2018) Tan, C. M., Bassa, C. G., Cooper, S., et al. 2018, ApJ, 866, 54
- van Haarlem et al. (2013) van Haarlem, M. P., Wise, M. W., Gunst, A. W., et al. 2013, A&A, 556, A2
- Wang & Hirotani (2011) Wang, R., & Hirotani, K. 2011, ApJ, 736, 127