CO observations toward HI-rich Ultra Diffuse Galaxies
Abstract
We present CO observations toward a sample of six Hi-rich Ultra-diffuse galaxies (UDGs) as well as one UDG (VLSB-A) in the Virgo Cluster with the IRAM 30-m telescope. CO =1-0 is marginally detected at 4 level in AGC122966, as the first detection of CO emission in UDGs. We estimate upper limits of molecular mass in other galaxies from the non-detection of CO lines. These upper limits and the marginal CO detection in AGC122966 indicate low mass ratios between molecular and atomic gas masses. With the star formation efficiency derived from the molecular gas, we suggest that the inefficiency of star formation in such Hi-rich UDGs is likely caused by the low efficiency in converting molecules from atomic gas, instead of low efficiency in forming stars from molecular gas.
keywords:
galaxies: ISM; galaxies: star formation1 Introduction
Ultra-diffuse galaxies (UDGs) are extremely low surface brightness galaxies at the optical and near-IR wavelengths (Papastergis, Adams & Romanowsky, 2017). They have drawn much attention from both observers and theorists since the discovery of 47 UDGs in the Coma cluster (van Dokkum, et al., 2015). Observations of UDGs mainly focused on optical and near-IR studies (van Dokkum, et al., 2015; van der Burg, Muzzin & Hoekstra, 2016; Yagi, et al., 2016), which show that the stellar components are much less than those in normal galaxies. A sub-set of UDGs, which have high Hi to stellar mass ratio and were normally found outside galaxy clusters, have been discovered in Hi observations with large single dish radio telescopes, such as Arecibo, Effelsberg and GBT (Roberts, et al., 2004; Leisman, et al., 2017; Spekkens & Karunakaran, 2018). High angular resolution observations with radio interferometers (Leisman, et al., 2017; Ball, et al., 2018; Mihos, et al., 2018; Brunker, et al., 2019) showed that Hi emission are more extended than the stellar components traced by optical images. The line widths (FWHM) of Hi detected by single dishes (Roberts, et al., 2004; Leisman, et al., 2017; Spekkens & Karunakaran, 2018) and interferometers (Leisman, et al., 2017; Ball, et al., 2018; Mihos, et al., 2018) in such galaxies are only about or even less than 100 km s-1. Such small linewidths led difficulties for determining dynamical mass of whole galaxy with large uncertainty of inclination angle.
With extremely high ratios of gas to stellar mass and with low stellar mass (Leisman, et al., 2017; Mihos, et al., 2018), such Hi-rich UDGs should have inefficient star formation, low star formation rate (SFR), and low star formation efficiency (SFE) across cosmic time. Hi-rich UDGs with a size of the Milky Way may be “failed" galaxies or “failed" smaller galaxies, depending on the estimated halo mass (Leisman, et al., 2017).
There are two major steps to form stars from Hi gas: atomic gas converts to molecular gas, and molecular gas form stars. So, molecular to atomic gas fraction is a key parameter to understand the inefficient star formation in such galaxies. However, the lack of molecular gas information of such galaxies prohibits further distinction about which step is more crucial for the inefficient star formation in the history. Therefore, CO observations toward a sample of Hi-rich local UDGs would help answer such questions: The inefficient star formation in such UDGs is caused by difficulties of forming molecular gas from atomic gas, or failed star formation from molecular gas?
Although there have been several CO observations with few detections (O’Neil, Hofner & Schinnerer, 2000; Matthews & Gao, 2001; Matthews, et al., 2005; Das, Boone & Viallefond, 2010; Cao, et al., 2017) toward Hi rich Low Surface Brightness Galaxies (LSBGs), which have quite high gas to star mass ratios, there is still no report on CO observations toward UDGs in the literature, up to now.
In this letter, we describe CO line observations and data reduction of a small sample of UDGs with the IRAM 30-m telescope in §2, present the main results and discussions in §3, and make the brief summary and future prospects in §4.
2 Observations and data reduction
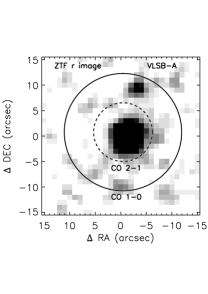
We select six Hi-rich UDGs from the literature (Leisman, et al., 2017; Papastergis, Adams & Romanowsky, 2017; Bellazzini, et al., 2017; Trujillo, et al., 2017; Brunker, et al., 2019) to perform CO line observations, because they have enough gas materials to form stars. The sample includes three Milky-Way-sized ones with Hi mass 10, three dwarf galaxies with Hi mass 2.510 (see Table 1), and VLSB-A, which is one of the three UDGs in the Virgo Cluster with velocity measured through optical spectra toward the nucleus (Mihos, et al., 2015).
The observations were carried out from July 31 to August 3, 2018 with the IRAM 30-m millimeter telescope at Pico Veleta, Spain111Based on observations carried out with the IRAM 30m Telescope. IRAM is supported by INSU/CNRS (France), MPG (Germany) and IGN (Spain).. The Eight MIxer Receiver (EMIR) with dual polarizations, FTS backend, and standard wobbler switching mode with offset at 0.5 Hz beam throw, were used. Focus calibrations were done at the beginning of the observations and during sunset or sunrise, toward planets or strong millimeter quasars. Pointing calibrations were done every 2 hours using nearby quasars. CO 1-0 at E0 band and CO 2-1 at E2 band were covered simultaneously our observations. The observing frequency of CO 1-0 varies from 112.35 GHz with typical system temperature of 150K in SECCO-dI-1 to 115.273 GHz with typical system temperature of 300K in VLSB-A. The system temperature also varies with different weather conditions and elevations of telescope. One the other hand, CO 2-1 observations are from 224.7 GHz to 230.5 GHz, while the typical system temperature is about 500K and strongly depends on weather conditions and elevations of telescope.
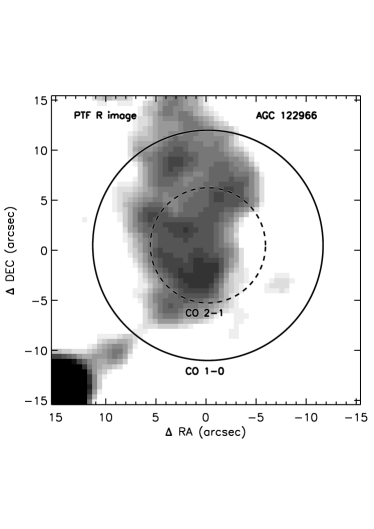
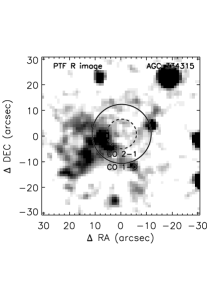
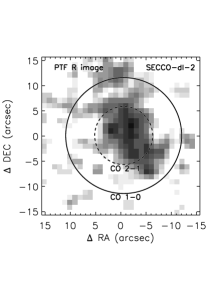
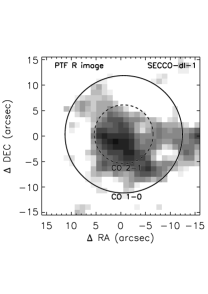
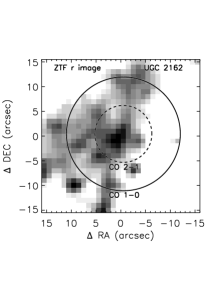
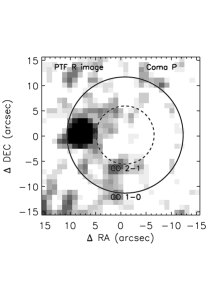
The pointing center of each source is listed in Table 1. The optical images of these sources from the PTF (the Palomar Transient Factory) (Law, et al., 2009; Rau, et al., 2009) or the ZTF (the Zwicky Transient Facility) (Bellm, et al., 2019) are presented in Figure 1 and 2.
The data were dumped every 1.7 minutes as one scan, and calibration was done every 6 scans. The beam sizes of the IRAM 30-m telescope are about 22′′ for CO 1-0 and 11′′ for CO 2-1, respectively. The conversion from to is: , where =95% and for CO 1-0, while =92% and for CO 2-1.

The CLASS package of GILDAS222http://www.iram.fr/IRAMFR/GILDAS was used for data reduction. The effective on-source time and the noise level for each source are listed in Table 2. First order baseline fitting was done for each spectrum with 1.7 minutes integration time. Then we smoothed and resampled each spectrum to 10 , before averaging all spectra of each target (Fig. 1) with a weighting of . For each target, we calculated the standard deviation of each channel across all spectra. This gives a channel based noise, which is pretty flat for all sources and is consistent with the value from the final spectrum obtained with standard method using class task ‘average’ f in each source. Even though the rms noise increases with the increasing of the frequency at 3mm band due to the O2 line in the earth’s atmosphere, it is almost the same within 500 km s-1 for the observed CO 1-0 line.
The noise level () in for each source is listed in Table 2 are obtained from the averaged spectrum at the original frequency resolution (0.195 MHz), with line free channels using CLASS task ‘base’ with first order polynomial. The upper limits of flux are calculated with 3, where is the rms noise from the final spectrum for each source with 0.195 MHz resolution, is the velocity resolution corresponding to 0.195 MHz ( km s-1), and is 50 km s-1, as the assumed line width. For most of the sources, since the observations were done in summer time, CO 1-0 data were much better than CO 2-1 due to weather conditions. Thus, CO 1-0, instead of CO 2-1 data, are used for estimation of the upper limits.
3 Results and Discussion
CO 1-0 emission is marginally detected in AGC122966 at 4 level with velocity integrated flux of 0.23 K km s-1 in (see Figure 1), while only upper limits at can be estimated in other sources. The velocity range of CO 1-0 emission in AGC122966 is from about 50 to 150 km s-1, relative to the systematic velocity obtained from the Hi 21-cm emission.
The CO 2-1 line of AGC122966, which was obtained simultaneously, was not detected at 3. The non-detection of CO 2-1 may caused by the high system temperature at the 1.3 mm band. Further more, CO 2-1 has smaller beam size, which is only 25% of the CO 1-0 beam coverage. So, if the CO emission is clumpy and located off the pointing center of this observation, it is possible that CO clump is not fully covered by the CO 2-1 beam. To present the difference of the beam sizes, we overlay the beams on the stacked R-band images of AGC122966, which are from the intermediate Palomar Transient Factor (PTF) survey, and show it in Figure 1.
The velocity integrated luminosity of CO 1-0 () in AGC122966 is 2.2 K km s-1 pc-2, using the formula (Solomon, et al., 1997; Gao & Solomon, 2004; Jiang, et al., 2015), where =22′′ is the main beam size of the observation, is the velocity integrated flux in , is the luminosity distance of the galaxy, and is the redshift. The CO 1-0 emission is out of Hi velocity range (Leisman, et al., 2017; Mancera Piña, et al., 2019) within 45 km s-1. The marginal detection of CO 1-0 might not be real because of the different velocity ranges of Hi and CO 1-0. However, even though no related Hi 21-cm line emission at the same velocity range as that of the CO 1-0 peak are reported, weak Hi 21-cm below the detection limit in the literature are still possible, which means that the CO 1-0 detection can still be real. Last, even if the 3 upper limit of CO 1-0 is adopted to estimate molecular gas mass of AGC122966, instead of using the detection, the main result is still similar to considering this feature as detection.
The metallicity in UDGs is difficult to be measured due to weak optical emission. Only SECCO-dI-2 and UGC 2162 have such measurements in the literature, which gave low metallicities of 8.2 of 12+log(O/H) for SECCO-dI-2 (Bellazzini, et al., 2017) and 8.22 of 12+log(O/H) for UGC 2162 (Trujillo, et al., 2017), respectively. SECCO-dI-2 and UGC 2162 do not follow the mass-metallicity relation in galaxies (Berg, et al., 2012), which gave the metallicity of 7.6 for 12+log(O/H) for galaxies with similar mass to SECCO-dI-2 as = (Bellazzini, et al., 2017) or UGC 2162 as = (Trujillo, et al., 2017). A tentative evidence that the gas-phase metallicities in diffuse systems are high for their stellar mass had been found in two UDGs (Greco, et al., 2018). With limited information of metallicity measurement toward these UDGs, we would like to assume similar metallicity to that of SECCO-dI-2 in these UDGs in our discussion.
For galaxies with a metallicity of 8.2, the conversion factor (), which converts from CO luminosity to molecular mass, should be higher than that in the Milky Way, base on the relation of metallicity and (Bolatto, Wolfire & Leroy, 2013; Shi, et al., 2016). (8.6/K km s-1pc2 ), with twice of that in the Milly Way as a reasonable value for such metallicity, is adopted (see Table 2). The molecular gas mass in AGC122966 is then estimated to be 1.9, if the emission feature is real. The H2/Hi mass ratio is 0.19, while it ranges from 0.03 to 3 in a large sample of galaxies (Jiang, et al., 2015).
Using the same method as for AGC122966, the non-detection of CO emission in most of these Hi-rich UDGs can give 3 upper limits of molecular gas mass, assuming a line width of 50 km s-1 in each galaxy. Upper limits of H2/Hi mass ratios for each galaxy can also be estimated (see Table 2), which are from 0.012 in UGC 2162 to 0.083 in SECCO-dI-1. The upper limit of molecular gas mass is also estimated for AGC 122966 if that emission feature is not real. The 3 upper limit of CO 1-0 in AGC 122966 is about 1/4 of the flux of that feature, not only because that feature is only 4, but also because the line width of that feature is more than 50 km s-1. Note that the pointing centers of our observations are with about 15′′ and 9′′ offsets from the optical centers in AGC 334315 and ComaP (see Figure 2.), respectively. The offset for AGC 334315 is about 70% beamsize of CO 1-0, while it is about 40% for ComaP. Most of the emission at optical band in ComaP can be covered with the beam of CO 1-0 observation. However, only 1/3 to 1/2 of the optical emission region in AGC 334315 can be covered by CO 1-0 beam. Such offset can cause underestimation of CO upper limit in these two galaxies, which can further cause about a factor of 2 in ComaP or 3 in AGC 334315 underestimation of H2/HI ratio and overestimation of SFR/.
The ratio of molecular mass and stellar mass, , in each galaxy, is also derived and listed in Table 2. The upper limits of this ratio range from 0.12 to 10, while this ratio ranges from in massive galaxies with to in low mass end with , decreasing with M∗ at the massive end and flatten at the low mass end with large scatter (Jiang, et al., 2015). No clear difference of between Hi-rich UDGs to normal galaxies can be justified with current results. On the other hand, the ratios of in these HI-rich UDGs, range from 8.3 to 120, are much higher than that in normal galaxies ranging from at massive part to almost ten in the low mass end (Jiang, et al., 2015).
The low H2/Hi mass ratios, i.e., the lack of molecular gas, in these Hi-rich UDGs, all of which are less than 0.1 (see Table 2), might be the main reason of inefficient star formation, while such ratio in normal galaxies are from to with a median value of (Jiang, et al., 2015). If only the molecular gas was used for calculating SFE (SFR/), such value will not be significantly lower than that in nearby spirals as (5.25yr-1 (Leroy, et al., 2008). The SFR in AGC122966, the one with tentative CO 1-0 detection, is 0.022 yr-1 (Leisman, et al., 2017), which gives an SFE of 1.3yr-1. On the other hand, with an SFR of 0.045 yr-1 (Leisman, et al., 2017) and a non-detection of CO 1-0 in AGC 334315, the derived SFE with molecular gas is greater than 12.1 yr-1, which is much higher than that in nearby spirals. Therefore, we suggest that the inefficient star formation in such galaxies is mainly due to the low efficiency of forming molecules from atomic gas, instead of forming stars from molecular clouds.
With limited information of metallicity in these UDGs, the adopted may be lower than the real value, which would underestimate molecular gas mass. In this case, low SFE for molecular gas can not be the only explanation of inefficient star formation in such Hi-rich UDGs. Deep CO observations toward UDGs with ALMA, as well as metallicity measurement with deep optical spectroscopic observations, will help us to derive molecular gas mass and determine the reason of inefficient star formation.
Since molecular gas and stellar masses are much less than the atomic mass in such galaxies, the baryonic mass can be estimated with only Hi, to derive the dynamical-to-baryonic mass ratios. As discussed in the literature (Leisman, et al., 2017; Brunker, et al., 2019), the total masses estimated with dynamics are not massive enough, such Hi-rich UDGs should not be failed spiral galaxies, even though some of them have Hi and optical sizes similar to those of spiral galaxies.
The properties of such galaxies, such as high halo spin parameters (Leisman, et al., 2017), may bring down the efficiency of forming molecules from atomic gas. AGC122966, with marginal detection of CO 1-0 emission, is the galaxy with lowest / ratio (see Table 1) among the 6 Hi-rich UDGs. The relatively high H2/Hi ratio in AGC122966 may cause higher star formation rate than other Hi-rich UDGs in the past and nowadays, which can further explain the relatively low / ratio in AGC122966. Or, if that emission feature is not real, AGC122966 will be similar to other UDGs. Further confirmation of CO emission in AGC122966 with millimeter interferometers, such as ALMA or NOEMA, is necessary to make a conclusion.
4 Summary and future prospects
As the first survey observations of CO 1-0 and 2-1 toward a sample of Hi-rich UDGs with the IRAM 30-m telescope, we marginally detected CO 1-0 in one galaxy (AGC122966) at 4 level. The non-detection of CO lines in other sources provides good upper limits of molecular masses, which help estimate upper limits of molecular gas mass. We find low ratios of molecular to atomic mass, which indicate that the inefficient star formation in such Hi-rich UDGs should mainly be caused by the difficulty of forming molecules from atomic gas, while the star formation efficiency derived for molecular gas is not significantly lower than normal spirals. An alternative possibility is that CO lines are no longer good tracers of molecular gas in UDGs, because the metallicity might be lower than assumed.
Further large-sample high-sensitivity CO observations with ALMA can better derive molecular mass in such galaxies and can better provide the molecular to atomic mass ratios. ALMA observations can also provide the spatial distribution of molecular gas, which can be used to compare with star formation informations using further optical emission line observations.
Acknowledgements
We thank the referee, Dr. U. Lisenfeld, for helpful suggestions to improve the manuscript. This work is supported by National Key Basic Research and Development Program of China (grant No. 2017YFA0402704) and the National Natural Science Foundation of China grant 11590783, and U1731237. This study is based on observations carried out under project number 068-15 with the IRAM 30-m telescope. IRAM is supported by INSU/CNRS (France), MPG (Germany) and IGN (Spain). This work also benefited from the International Space Science Institute (ISSI/ISSI-BJ) in Bern and Beijing, thanks to the funding of the team “Chemical abundances in the ISM: the litmus test of stellar IMF variations in galaxies across cosmic time" (Principal Investigator D.R. and Z-Y.Z.). J.W. thanks Dr. Yu Lu for helpful discussion about UDGs.
Data availability
The original CO data observed with IRAM 30 meter can be accessed by IRAM archive system at https://www.iram-institute.org/EN/content-page-386-7-386-0-0-0.html, while optical images can be obtained from PTF and ZTF archive system. If anyone is interested in the reduced data presented in this paper, please contact Junzhi Wang at jzwang@shao.ac.cn.
References
- Ball, et al. (2018) Ball C., et al., 2018, AJ, 155, 65
- Bellazzini, et al. (2017) Bellazzini M., et al., 2017, MNRAS, 467, 3751
- Bellm, et al. (2019) Bellm E. C., et al., 2019, PASP, 131, 018002
- Berg, et al. (2012) Berg D. A., et al., 2012, ApJ, 754, 98
- Bolatto, Wolfire & Leroy (2013) Bolatto A. D., Wolfire M., Leroy A. K., 2013, ARA&A, 51, 207
- Brunker, et al. (2019) Brunker S. W., et al., 2019, AJ, 157, 76
- Cao, et al. (2017) Cao T.-W., et al., 2017, AJ, 154, 116
- Das, Boone & Viallefond (2010) Das M., Boone F., Viallefond F., 2010, A&A, 523, A63
- Gao & Solomon (2004) Gao Y., Solomon P. M., 2004, ApJS, 152, 63
- Greco, et al. (2018) Greco J. P., Goulding A. D., Greene J. E., Strauss M. A., Huang S., Kim J. H., Komiyama Y., 2018, ApJ, 866, 112
- Law, et al. (2009) Law N. M., et al., 2009, PASP, 121, 1395
- Leroy, et al. (2008) Leroy A. K., Walter F., Brinks E., Bigiel F., de Blok W. J. G., Madore B., Thornley M. D., 2008, AJ, 136, 2782
- Jiang, et al. (2015) Jiang X.-J., Wang Z., Gu Q., Wang J., Zhang Z.-Y., 2015, ApJ, 799, 92
- Leisman, et al. (2017) Leisman L., et al., 2017, ApJ, 842, 133
- Mancera Piña, et al. (2019) Mancera Piña P. E., et al., 2019, ApJL, 883, L33
- Matthews & Gao (2001) Matthews L. D., Gao Y., 2001, ApJL, 549, L191
- Matthews, et al. (2005) Matthews L. D., Gao Y., Uson J. M., Combes F., 2005, AJ, 129, 1849
- Mihos, et al. (2018) Mihos J. C., Carr C. T., Watkins A. E., Oosterloo T., Harding P., 2018, ApJL, 863, L7
- Mihos, et al. (2015) Mihos J. C., et al., 2015, ApJL, 809, L21
- O’Neil, Hofner & Schinnerer (2000) O’Neil K., Hofner P., Schinnerer E., 2000, ApJL, 545, L99
- Papastergis, Adams & Romanowsky (2017) Papastergis E., Adams E. A. K., Romanowsky A. J., 2017, A&A, 601, L10
- Rau, et al. (2009) Rau A., et al., 2009, PASP, 121, 1334
- Roberts, et al. (2004) Roberts S., et al., 2004, MNRAS, 352, 478
- Shi, et al. (2016) Shi Y., Wang J., Zhang Z.-Y., Gao Y., Hao C.-N., Xia X.-Y., Gu Q., 2016, NatCo, 7, 13789
- Spekkens & Karunakaran (2018) Spekkens K., Karunakaran A., 2018, ApJ, 855, 28
- Solomon, et al. (1997) Solomon P. M., Downes D., Radford S. J. E., Barrett J. W., 1997, ApJ, 478, 144
- Trujillo, et al. (2017) Trujillo I., Roman J., Filho M., Sánchez Almeida J., 2017, ApJ, 836, 191
- van Dokkum, et al. (2015) van Dokkum P. G., Abraham R., Merritt A., Zhang J., Geha M., Conroy C., 2015, ApJL, 798, L45
- van der Burg, Muzzin & Hoekstra (2016) van der Burg R. F. J., Muzzin A., Hoekstra H., 2016, A&A, 590, A20
- Yagi, et al. (2016) Yagi M., Koda J., Komiyama Y., Yamanoi H., 2016, ApJS, 225, 11
| Source name | RA(J2000) | DEC(J2000) | Dist | SFR | References | ||||
| km s-1 | Mpc | kpc | 10 | ||||||
| AGC 122966 | 02:09:29.0 | +31:51:15.0 | 6518 | 90 | 7.4 | 1.0 | 8.3 | 0.022 | 1 |
| SECCO-dI-1 | 11:55:58.5 | +00:02:36.3 | 7791 | 112 | 2.6 | 1.2 | 120 | … | 2 |
| AGC 334315 | 23:20:11.0 | +22:24:10.0 | 5100 | 73 | 4.2 | 1.4 | 23 | 0.045 | 1 |
| UGC 2162 | 02:40:23.1 | +01:13:45.0 | 1172 | 12.3 | 1.7 | 0.19 | 10 | 8.7 | 3 |
| SECCO-dI-2 | 11:44:33.8 | -00:52:00.9 | 2543 | 40 | 1.3 | 0.24 | 27 | … | 4 |
| Coma P | 12:32:10.3 | +20:25:23.0 | 1348 | 5.5 | 1 | 0.035 | 81 | 3.1 | 5 |
| VLSB-A | 12:28:15.9 | +12:52:13.0 | -120 | 16.5 | 9.7 | … | … | … | 6 |
The sources are separated into 3 sub-groups: Milky Way size HI-rich UDGs (AGC 122966, SECCO-dI-1 and AGC 334315), dwarf HI-rich UDGs (UGC 2162, SECCO-dI-2 and Coma P), and one UDG without HI detection in the Virgo Cluster.
References:1. Leisman, et al. (2017), 2. Bellazzini, et al. (2017), 3. Trujillo, et al. (2017), 4. Papastergis, Adams & Romanowsky (2017), 5. Brunker, et al. (2019), 6. Mihos, et al. (2015)
| Source name | on-source time | rmsa | (CO 1-0)b | (CO) | d | ||||
|---|---|---|---|---|---|---|---|---|---|
| Minutes | mK | K km s-1 | 107K km s-1 pc-2 | 10 | |||||
| AGC 122966 | 336 | 3.5 | 0.23 | 2.2 | 1.3 | ||||
| 0.053c | 0.50 | 0.43 | 0.043 | 0.36 | 5.7 | ||||
| SECCO-dI-1 | 316 | 5.2 | 0.078 | 1.2 | 1.0 | 0.083 | 10.0 | … | |
| AGC 334315e | 432 | 4.4 | 0.066 | 0.43 | 0.37 | 0.026 | 0.60 | 12.1 | |
| UGC2162 | 107 | 9.6 | 0.14 | 0.027 | 0.023 | 0.012 | 0.12 | 37.8 | |
| SECCO-dI-2 | 294 | 5.7 | 0.086 | 0.17 | 0.15 | 0.071 | 1.9 | … | |
| Coma Pe | 95 | 19.6 | 0.29 | 0.011 | 0.0095 | 0.027 | 2.2 | 3.3 | |
| VLSB-A | 121 | 12.5 | 0.19 | 0.067 | 0.058 | … | … |
. in Tmb with frequency resolution of 0.195 MHz, which corresponds to 0.5 km s-1 at 115GHz. . 3 upper limits for velocity integrated flux for 50 km s-1 line width in Tmb. . 3 upper limit estimation for AGC 122966 if that feature is not real. . =8.6/K km s-1pc2 is used for estimating molecular gas mass. . The offsets of the pointing centers to the centers of optical emission is about 15′′ for AGC 334315 and 9′′ for Coma P, which can cause under-estimation of the upper limits of CO emission in these two galaxies.