Abstract
Social distancing is a recommended solution by the World Health Organisation (WHO) to minimise the spread of COVID-19 in public places. The majority of governments and national health authorities have set the 2-meter physical distancing as a mandatory safety measure in shopping centres, schools and other covered areas. In this research, we develop a hybrid Computer Vision and YOLOv4-based Deep Neural Network (DNN) model for automated people detection in the crowd in indoor and outdoor environments using common CCTV security cameras. The proposed DNN model in combination with an adapted inverse perspective mapping (IPM) technique and SORT tracking algorithm leads to a robust people detection and social distancing monitoring. The model has been trained against two most comprehensive datasets by the time of the research—the Microsoft Common Objects in Context (MS COCO) and Google Open Image datasets. The system has been evaluated against the Oxford Town Centre dataset (including 150,000 instances of people detection) with superior performance compared to three state-of-the-art methods. The evaluation has been conducted in challenging conditions, including occlusion, partial visibility, and under lighting variations with the mean average precision of 99.8% and the real-time speed of 24.1 fps. We also provide an online infection risk assessment scheme by statistical analysis of the spatio-temporal data from people’s moving trajectories and the rate of social distancing violations. We identify high-risk zones with the highest possibility of virus spread and infection. This may help authorities to redesign the layout of a public place or to take precaution actions to mitigate high-risk zones. The developed model is a generic and accurate people detection and tracking solution that can be applied in many other fields such as autonomous vehicles, human action recognition, anomaly detection, sports, crowd analysis, or any other research areas where the human detection is in the centre of attention.
keywords:
social distancing; COVID-19; human detection and tracking; distance estimation; deep convolutional neural networks; crowd monitoring; pedestrian detection; inverse perspective mapping.00 \issuenum1 \articlenumber5 \historyReceived: 16 September 2020; Accepted: 20 October 2020; Published: date \continuouspagesyes \updatesyes \TitleDeepSOCIAL: Social Distancing Monitoring and Infection Risk Assessment in COVID-19 Pandemic \AuthorMahdi Rezaei 1,∗,†\orcidA and Mohsen Azarmi 2,†\orcidB \corresCorrespondence: m.rezaei@leeds.ac.uk; Tel.: +44-113-3435342 \firstnoteThe authors contributed equally.
1 Introduction
The novel generation of the coronavirus disease (COVID-19) was reported in late December 2019 in Wuhan, China. After only a few months, the virus became a global outbreak in 2020. On May 2020 The World Health Organisation (WHO) announced the situation as pandemic (World Health Organisation, August 2020; WHO Director, Generals, 2020). The statistics by WHO on 8th October 2020 confirm 36 million infected people and a scary number of 1,056,000 deaths in 200 countries.
With the growing trend of patients, there is still no effective cure or available treatment for the virus. While scientists, healthcare organisations, and researchers are continuously working to produce appropriate medications or vaccines for the deadly virus, no definite success has been reported at the time of this research, and there is no certain treatment or recommendation to prevent or cure this new disease. Therefore, precautions are taken by the whole world to limit the spread of infection. These harsh conditions have forced the global communities to look for alternative ways to reduce the spread of the virus.
Social distancing, as shown in Figure 1a, refers to precaution actions to prevent the proliferation of the disease, by minimising the proximity of human physical contacts in covered or crowded public places (e.g., schools, workplaces, gyms, lecture theatres, etc.) to stop the widespread accumulation of the infection risk (Figure 1b).
 |
 |
| (a) Social distancing monitoring | (b) Accumulated infection risk (red zones) |
| due to breaches of the social-distancing |
For several months, the World Health Organisation believed that COVID-19 was only transmittable via droplets emitted when people sneeze or cough and the virus does not linger in the air. However, on 8 July 2020, the WHO announced:
“There is emerging evidence that COVID-19 is an airborne disease that can be spread by tiny particles suspended in the air after people talk or breathe, especially in crowded, closed environments or poorly ventilated settings” (WHO Director, Generals, 2020).
Therefore, social distancing now claims to be even more important than thought before, and one of the best ways to stop the spread of the disease in addition to wearing face masks. Almost all countries are now considering it as a mandatory practice.
According to the defined requirements by the WHO, the minimum distance between individuals must be at least 6 feet (1.8 m) in order to observe an adequate social distancing among the people (Olsen et al., 2003).
Recent research has confirmed that people with mild or no symptoms may also be carriers of the novel coronavirus infection (Adlhoch et al., 2020). Therefore, it is important all individuals maintain controlled behaviours and observe social distancing. Many research works such as (Ferguson et al., 2006; Thu et al., 2020; Morato et al., 2020) have proved social-distancing as an effective non-pharmacological approach and an important inhibitor for limiting the transmission of contagious diseases such as H1N1, SARS, and COVID-19.
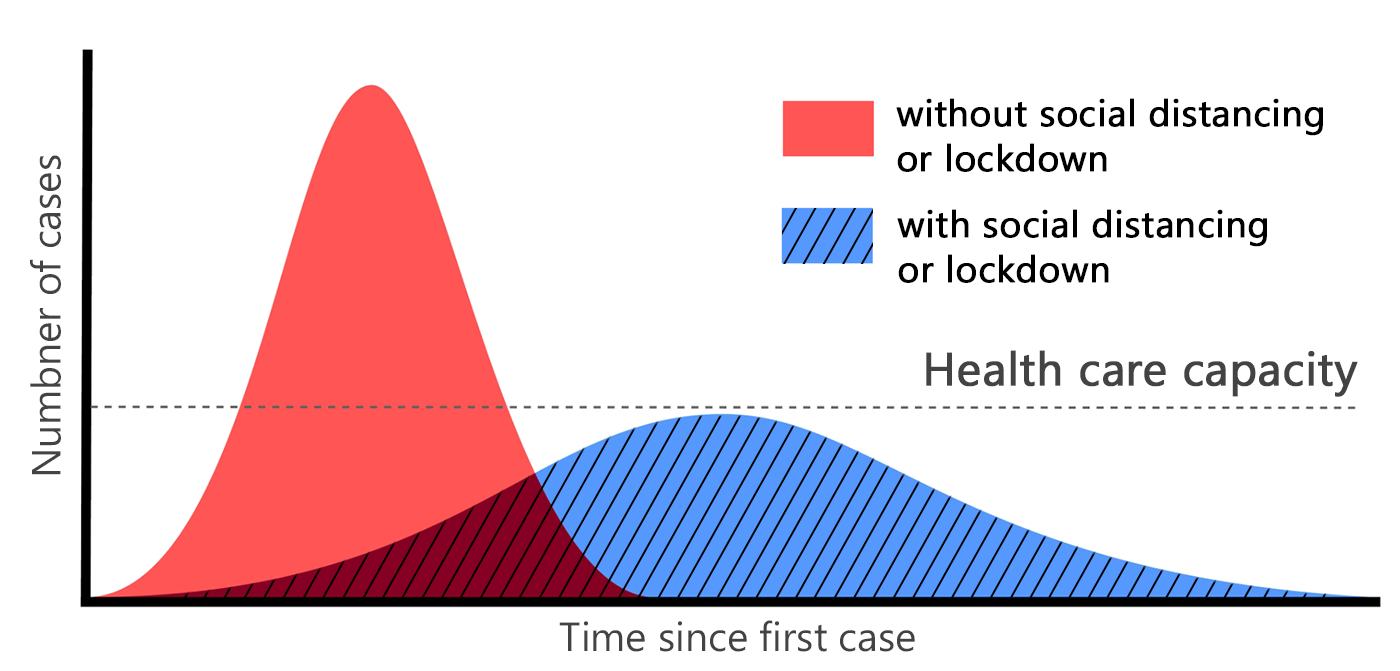
Figure 2 demonstrates the effect of following appropriate social distancing guidelines to reduce the rate of infection transmission among individuals (Fong et al., 2020; Ahmedi et al., 2018). A wider Gaussian curve with a shorter spike within the range of the health system service capacity makes it easier for patients to fight the virus by receiving continuous and timely support from the health care organisations. Any unexpected sharp spike and rapid infection rate (such as the red curve in Figure 2), will lead to service failure, and consequently, exponential growth in the number of fatalities.
During the COVID-19 pandemic, governments have tried to implement a variety of social distancing practices, such as restricting travels, controlling borders, closing pubs and bars, and alerting the society to maintain a distance of 1.6 to 2 m from each other (Australian Government Department of Health, 2020). However, monitoring the amount of infection spread and efficiency of the constraints is not an easy task. People require to go out for essential needs such as food, health care and other necessary tasks and jobs. Therefore, many other technology-based solutions such as (Nguyen et al., 2020; Punn et al., 2020) and AI related research such as (Shi et al., 2020; Gupta et al., 2020; Punn et al., 2020) have tried to step in to help the health and medical community in copping with COVID-19 challenges and successful social distancing practices. These works vary from GPS-based patient localisation and tracking to segmentation, and crowd monitoring.
In such situations, Artificial Intelligence can play an important role in facilitating social distancing monitoring. Computer Vision, as a sub-field of Artificial Intelligence, has been very successful in solving various complex health care problems and has shown its potential in chest CT-Scan or X-ray based COVID-19 recognition (Rezaei and Shahidi, 2020; Toğaçar et al., 2020) and can contribute to Social-distancing monitoring as well. Besides, deep neural networks enable us to extract complex features from the data so that we can provide a more accurate understanding of the images by analysing and classifying these features. Examples include diagnosis, clinical management and treatment, as well as the prevention and control of COVID-19 (Ulhaq et al., 2020; Nguyen, 2020).
Possible challenges in this area are the importance of gaining a high level of accuracy, dealing with a variety of lighting conditions, occlusion, and real-time performance. In this work, we aim at providing solutions to cope with the mentioned challenges, as well.
The main contribution of this research can be highlighted as follows:
-
•
This study aims to support the reduction of the coronavirus spread and its economic costs by providing an AI-based solution to automatically monitor and detect violations of social distancing among individuals.
- •
-
•
We perform a live and dynamic risk assessment, by statistical analysis of spatio-temporal data from the people movements at the scene (Section 4.4). This will enable us to track the moving trajectory of people and their behaviours, to analyse the ratio of the social distancing violations to the total number of people in the scene, and to detect high-risk zones for short- and long-term periods.
- •
-
•
The developed model can perform as a generic human detection and tracker system, not limited to social-distancing monitoring, and it can be applied for various real-world applications such as pedestrian detection in autonomous vehicles, human action recognition, anomaly detection, and security systems.
More details and further information will be provided in the following sections. In Section 2 we discuss about more technical related works, existing challenges, and research gaps in the field. The proposed methodology including the model architecture and our object detection techniques, tracking, and red-zone prediction algorithm will be proposed in Section 3. In Section 4, experimental results and performance of the system will be investigated against the state-of-the-art, followed by discussions and concluding remarks in Section 5.
2 Related Works
In this section, we provide a brief literature review on three types of research in this area: medical and clinical-related research, tracking technologies, and AI-based research. Although our research falls in the AI research category, due to the nature of the research questions, first, we will have a brief review on medical and technology-based research to have an in-depth understanding about the existing challenges. In Section 2.3 (AI-based Research) we gradually transit from object detection techniques to people detection, the existing methodologies, and research gaps for people detection using AI and computer vision.
2.1 Medical Research
Many researchers in the medical and pharmaceutical fields are aiming at treatment of COVID-19 infectious disease; however, no definite solution has yet been found. One the other hand, controlling the spread of the virus in public places is another issue, where the AI, computer vision, and technology can step-in to help.
A variety of studies with different implementation strategies (Ferguson et al., 2006; Thu et al., 2020; Choi and Shim, 2020) have proven that controlling the prevalence is a contributing factor, and social distancing is an effective way to reduce the transmission and prevent the spread of the virus in society. Several researchers such as (Eksin et al., 2019; Choi and Shim, 2020) use Susceptible, Infectious, or Recovered (SIR) model. SIR is an epidemiological modelling system to compute the theoretical number of people infected with a contagious disease in a given population, over time. One of the oldest yet common SIR models is Kermack and McKendrick models introduced in 1927 (Kermack and McKendrick, 1991). Eksin et al. (Eksin et al., 2019), have recently introduced a modified model of SIR by including a social distancing parameter, which can be used to determine the number of infected and recovered individuals.
Effectiveness of social distancing practices can be evaluated based on several standard approaches. One of the main criteria is based on the reproduction ratio, , which indicates the average number of people who may be infected from an infectious person during the entire period of the infection (Heffernan et al., 2005). Any indicates an increasing rate of infection within the society and indicates that every case will infect less than 1 person, hence, the disease rate is considered to be declining in the target population.
Since the value indicates the disease outspread, it is one of the most important indicators for selecting social distancing criteria. In the current COVID-19 pandemic, the World Health Organisation estimated the rate would be in the range of 2–2.5 (Gupta et al., 2020), which is significantly higher than other similar diseases such as seasonal flu with . In (Nguyen et al., 2020), a clear conclusion is drawn about the importance of applying social distancing for cases with a high amount of .
In another research based on the game theory on the classic SIR model, an assessment of the benefits and economic costs of social distancing has been examined (Relugal, 2010). The results also show that in the case of , social distancing would cause unnecessary costs, while implies that social distancing measures have the highest economic benefits. In another similar research, Kylie et al. (Ainslie et al., 2020) investigated the relationship between the stringency of social distancing and the region’s economic status. This study suggests although preventing the widespread outbreak of the virus is necessary, a moderate level of social activities could be allowed.
Prem et al. (Vidal-Alaball et al., 2020) use location-specific contact patterns to investigate the effect of social distancing measures on the prevalence of COVID-19 pandemic in order to remove the persistent path of disease outbreak using susceptible-exposed-infected-removed models (SEIR).
2.2 Tracking Technologies
Since the onset of coronavirus pandemic, many countries have used technology-based solutions, to inhibit the spread of the disease (Sonbhadra et al., 2020; Punn and Agarwal, 2020; Punn et al., 2020). For example, some of the developed countries, such as South Korea and India, use GPS data to monitor the movements of infected or suspected individuals to find any possible exposure among the healthy people.
The India government uses the Aarogya Setu program to find the presence of COVID-19 patients in the adjacent region, with the help of GPS and Bluetooth. This may also help other people to maintain a safe distance from the infected person (Jhunjhunwala, 2020). Some law enforcement agencies use drones and surveillance cameras to detect large-scale rallies and have carried out regulatory measures to disperse the population (Robakowska et al., 2017; Harvey, 2019).
Other researchers such as Xin et al. (Xin et al., 2018) perform human detection using wireless signals by identifying phase differences and change detection in amplitude wave-forms. However, this requires multiple receiving antennas and can not be easily integrated in all public places.
2.3 AI-Based Research
The utilisation of Artificial Intelligence, Computer Vision, and Machine Learning, can help to discover the correlation of high-level features. For example, it may enable us to understand and predict pedestrian behaviours in traffic scenes, sports activities, medical imaging, or anomaly detection, by analysing spatio-temporal visual information and statistical data analysis of the images sequences (Shi et al., 2020; Nguyen, 2020).
Among AI-Health related works, some researchers have tried to predict the sickness trend of specific areas (Hossain et al., 2020), to develop crowd counting and density estimation methodologies in public places (Sindagi and Patel, 2018), or to determine the distance of individuals from the popular swarms (Brighente et al., 2019) using a combination of visual and geo-location cellular information. However, such research works suffer from challenges such as skilled labour or the cost of designing and implementing the infrastructures.
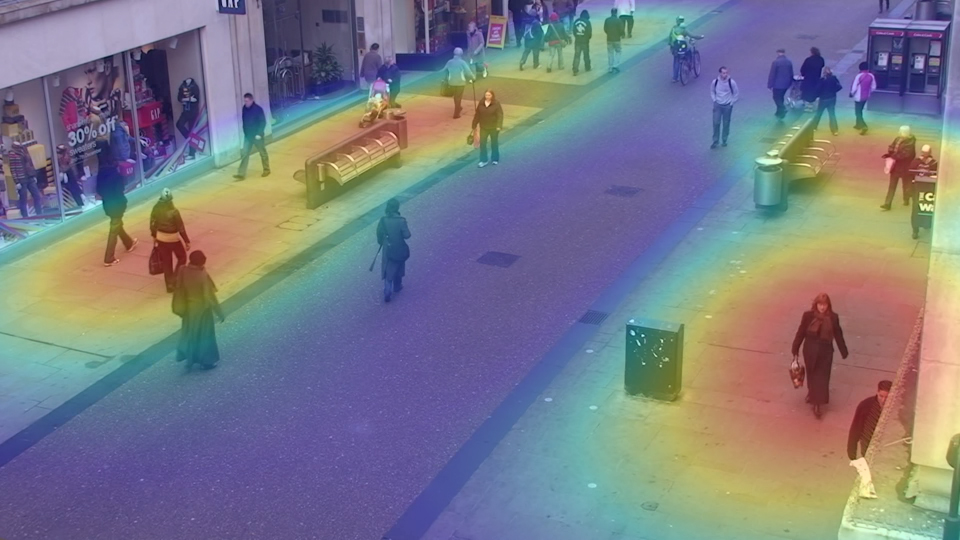
On the other hand, recent advances in Computer Vision, Deep Learning, and pattern recognition, as the sub-categories of the AI, enable the computers to understand and interpret the visual data from digital images or videos. It also allows computers to identify and classify different types of objects (Liu et al., 2020; Rezaei et al., 2010; Sabzevari et al., 2008). Such capabilities can play an important role in empowering, encouraging, and performing social distancing surveillance and measurements as well. For example, Computer Vision could turn CCTV cameras in the current infrastructure capacity into “smart” cameras that not only monitor people but can also determine whether people follow the social distancing guidelines or not. Such systems require very precise human detection algorithms.
People detection in image sequences is one of the most important sub-branches in the field of object detection and computer vision. Although many research works have been done in human detection (Nguyen et al., 2016) and human action recognition (Serpush and Rezaei, 2020), the majority of them are either limited to indoor applications or suffer from accuracy issues under outdoor challenging lighting conditions. A range of other research works rely on manual tuning methodologies to identify people activities, however, limited functionality has always been an issue (Gawande et al., 2020).
Convolutional Neural Networks (CNNs) have played a very important role in feature extraction and complex object classification, including human detection. With the development of faster CPUs, GPUs, and extended memory capacities, CNNs allow the researchers to make accurate and fast detectors compared to conventional models. However, the long time training, detection speed and achieving better accuracy, are still remaining challenges to be solved. Narinder et al. (Punn et al., 2020) used a deep neural network (DNN) based detector, along with Deepsort (Wojke et al., 2017) algorithm as an object tracker for people detection to assess the distance violation index—the ratio of number of people who violated the social distancing measure to the total number of the assessed group. However, no statistical analysis of the outcome of their results is provided. Furthermore, no discussion about the validity of the distance measurements is provided.
In another study by Khandelwal et al. (Khandelwal et al., 2020), the authors have addressed the people distancing in a given manufactory. They have used MobileNet V2 network (Sandler et al., 2018) as a lightweight detector to reduce computational costs, which in turn provides less accuracy comparing to some other common models. Furthermore, the method only focuses on an indoor manufactory-setup distance measurement and does not provide any statistical assessment on the virus spread. Similar to the other research, no statistical analysis is performed on the results of the distance measurement in (Yang et al., 2020). The authors have made a comparison between two common types of DNN models (You Only Look Once—YOLO and Faster RCNN ). However, the system accuracy has been only estimated based on a shallow comparison on different datasets with non-comparable ground truths.
Figure 3, shows the outcome of our investigations and reviews in terms of mean Average Precisions (mAP), and the speed (Frame Per Second—FPS) on some of the most successful object detection models such as RCNN (Girshick et al., 2014), fast RCNN (Girshick, 2015), faster RCNN (Ren et al., 2017), SSD: Single Shot MultiBox Detector (Liu et al., 2016), YOLOv1-v4 (Redmon et al., 2016; Redmon and Farhadi, 2017, 2018; Bochkovskiy et al., 2020) tested on the Microsoft Common Objects in Context (MS COCO) (Chen et al., 2015) and PASCAL Visual Object Classes (VOC) (Everingham et al., 2010) data sets under similar conditions. Otherwise, the performance of the systems may vary depending on various factors such as backbone architecture, input image size, resolution, model depth, software, and hardware platform.
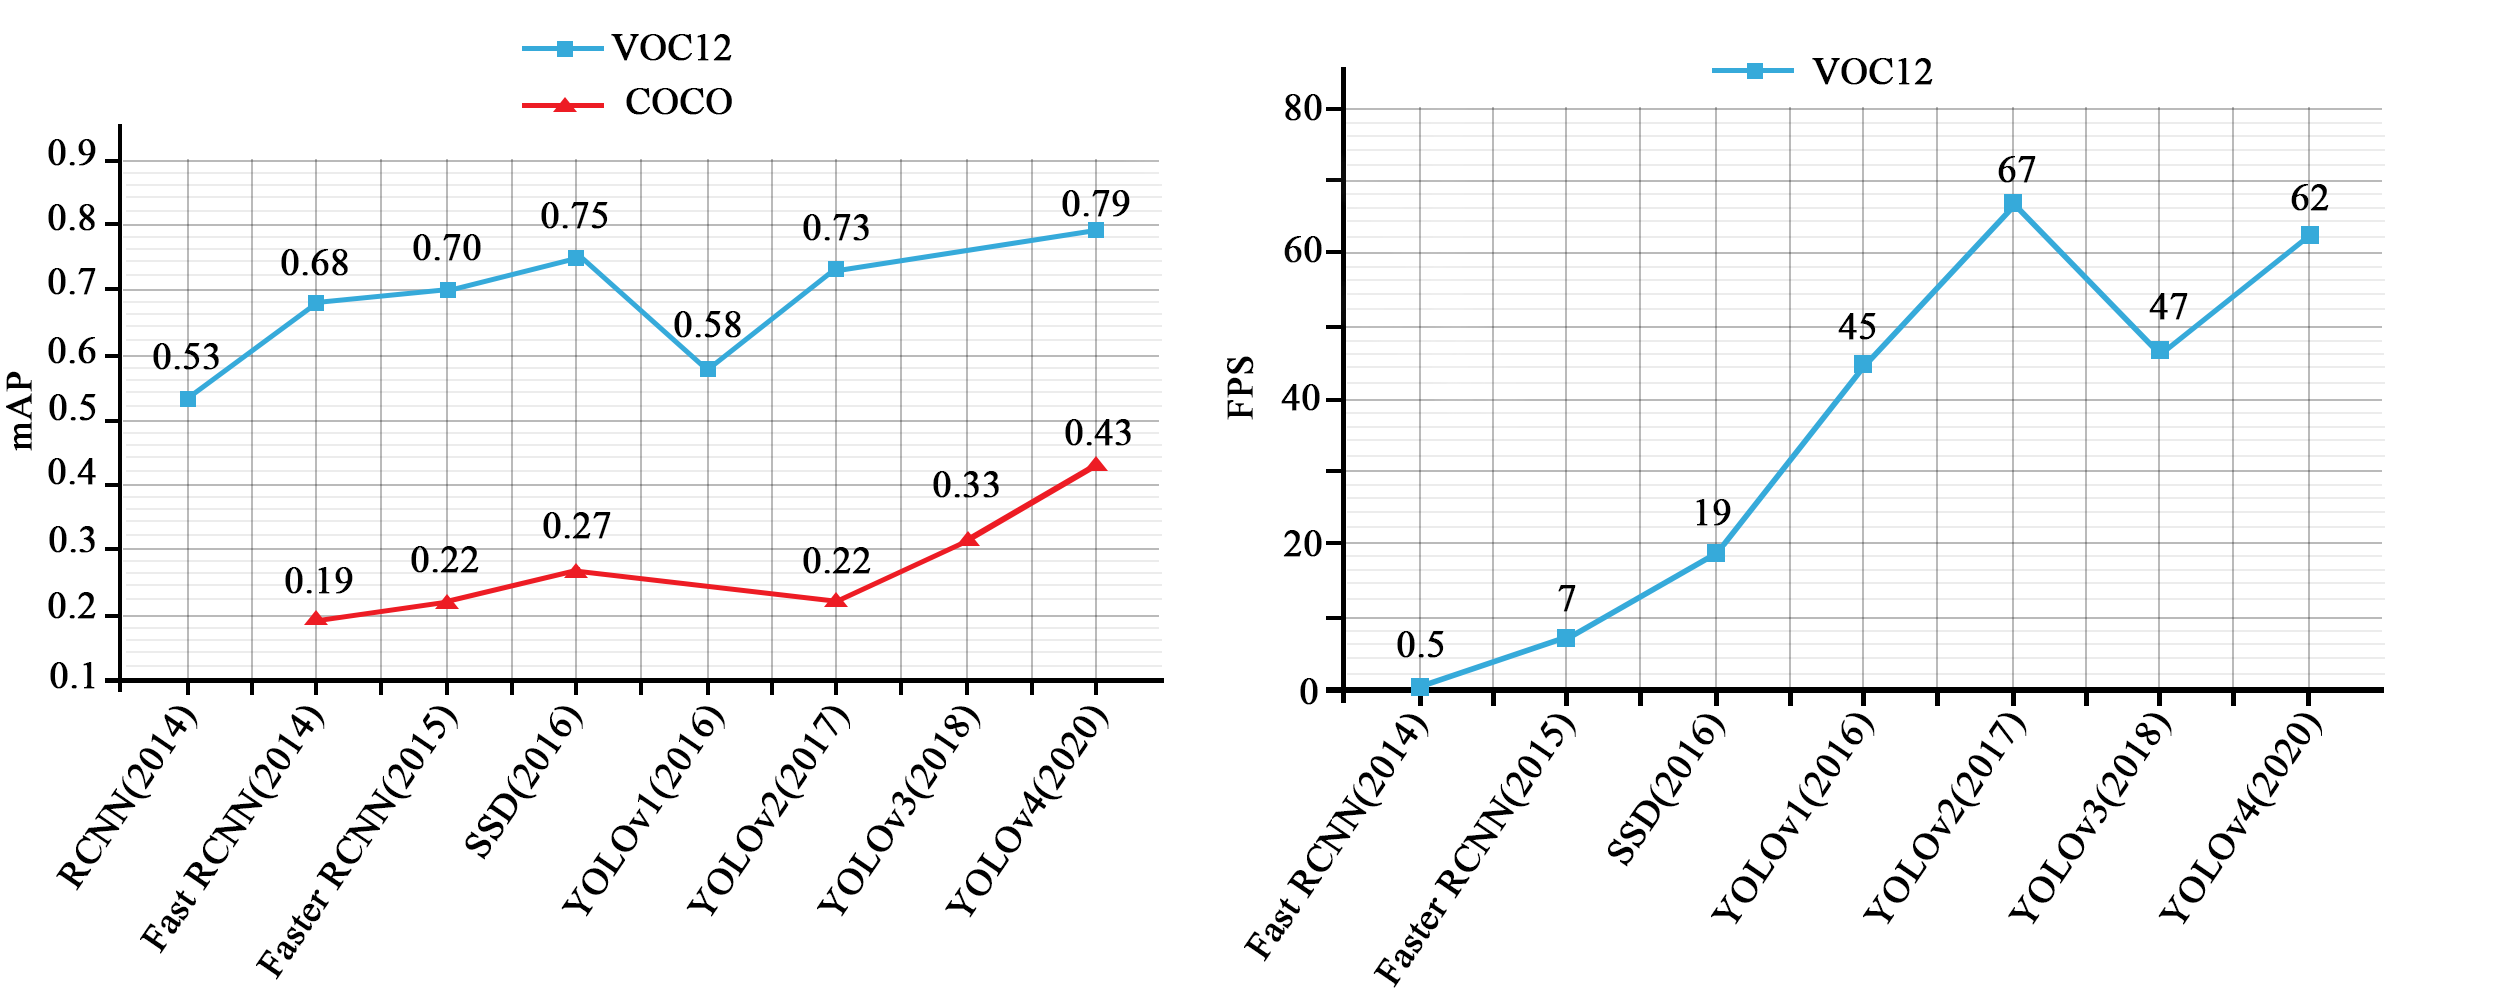
As can be seen from Figure 3, some of the models such as SSD and YOLOv2 perform in a contradictory manner in dealing with COCO and VOC12 datasets. They may seem good in one, and weak in another one. One of the possible reasons could be attributed to the different number of object categories in COCO and VOC12 (80 categories vs. 20). This makes the VOC12 dataset an easier goal to learn and less challenging. However, when it comes to the higher number of classes, the performance of the system may seem irregular, depending on the feature complexity of each object (good in some detections and weak in some other).
Since the social distancing topic is very recent, there has not been much dedicated research regarding the accuracy of people detection and inter-people distance estimation in the crowd, no experiment on challenging datasets has been performed, no standard comparison has been conducted on common datasets, and no analytical studies or post-processing have been considered after the people detection-phase to analyse the risk of infection distribution.
Considering the above-mentioned research gaps, we propose a new model which not only performs more accurate and faster than the state-of-the-art but also will be trained and tested using a large and comprehensive dataset, in challenging environments and lighting conditions. This will ensure the model is capable of performing in real-world scenarios, particularly in covered shopping centres where the lighting conditions are not as ideal as the outdoor lighting. Furthermore, we offer post-detection and post-processing analytical solutions to mitigate the spread of the virus.
3 Methodology
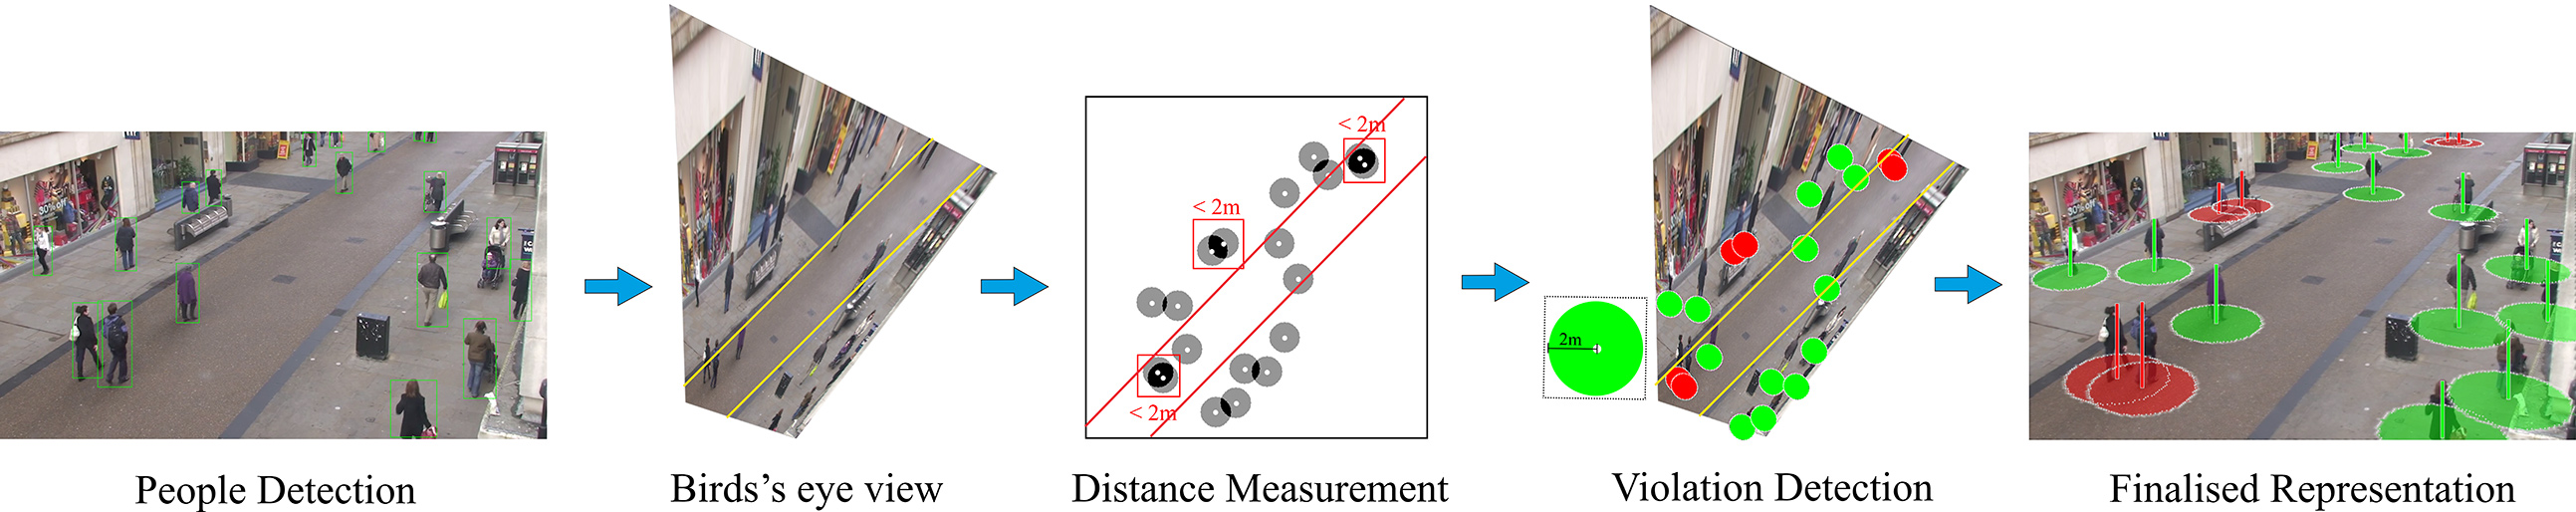
We propose a three-stage model including people detection, tracking, inter-distance estimation as a total solution for social distancing monitoring and zone-based infection risk analysis. The system can be integrated and applied on all types of CCTV surveillance cameras with any resolution from VGA to Full-HD, with real-time performance.
3.1 People Detection
Figure 4 shows the overall structure of the Stage 1. A CCTV Camera collects the input video sequences, and passes them to our Deep Neural Network model. The output of the model would be the detected people in the scene with their unique localisation bounding boxes. The objective is to develop a robust human (people) detection model, capable of dealing with various types of challenges such as variations in clothes, postures, at far and close distances, with/without occlusion, and under different lighting conditions.
Modern DNN-based object detectors (such as those listed in Figure 3) consist of three sections: input module and related operations such as augmentation, a backbone for extracting features and a head for predicting classes and location of objects in the output.
In Table 1 we have summarised a comprehensive list model design options including input augmentations, state-of-the-art core object detection modules (i.e., activation functions, backbone feature extractors, neck, and head). The table, offers a variety of possible choices for neck, head, and other sub-modules (depending on the requirements of the model). However, we mainly focus on the requirement of this research.
| Input | Detection Core | Head Output | ||||
|---|---|---|---|---|---|---|
| Augmentation | Activation | Backbone | Neck | Regularisation | Dense | Sparse |
| CutOut (DeVries and Taylor, 2017) | ReLU (Nair and Hinton, 2010) | VGG (Simonyan and Zisserman, 2014) | SPP (He et al., 2014) | L1, L2 (Ng, 2004) | YOLO (Redmon et al., 2016) ∗ | R-CNN (Girshick et al., 2014) ∗ |
| MixUp (Zhang et al., 2017) | Leaky-ReLU (Maas et al., 2013) | ResNet (He et al., 2016) | ASPP (Chen et al., 2017) | DropOut (DO) (Srivastava et al., 2014) | SSD (Liu et al., 2016) ∗ | Fast-RCNN (Girshick, 2015) ∗ |
| CutMix (Yun et al., 2019) | Param-ReLU (He et al., 2015) | SpineNet (Du et al., 2020) | PAN (Liu et al., 2018) | DropPath (Larsson et al., 2016) | RetinaNet (Lin et al., 2017) ∗ | Faster-RCNN (Ren et al., 2017) ∗ |
| Mosaic (Bochkovskiy et al., 2020) | ReLU6 (Howard et al., 2017) | CSPResNeXt50 (Wang et al., 2020) | FPN (Lin et al., 2017) | Spatial DO (Tompson et al., 2015) | RPN (Ren et al., 2017) ∗ | Libra R-CNN (Pang et al., 2019) ∗ |
| SELU (Klambauer et al., 2017) | CSPDarknet53 (Wang et al., 2020) | BiFPN (Tan et al., 2020) | DropBlock (Bochkovskiy et al., 2020) | CornerNet (Law and Deng, 2018) + | Mask R-CNN (He et al., 2017) ∗ | |
| Swish (Ramachandran et al., 2017) | EfficientNet (Tan and Le, 2019) | ASFF (Liu et al., 2019) | MatrixNet (Rashwan et al., 2019) + | CenterNet (Duan et al., 2019) + | ||
| Mish (Misra, 2019) | Darknet53 (Redmon and Farhadi, 2018) | RFB (Liu et al., 2018) | R-FCN (Dai et al., 2016) ∗ | RepPoints (Yang et al., 2019) + | ||
| Inception (Szegedy et al., 2016a, b) | SFAM (Zhao et al., 2019) | FCOS (Tian et al., 2019) + | ||||
| NAS-FPN (Ghiasi et al., 2019) | ||||||
| ∗ Anchor-based; + Anchor-free. |
3.1.1 Inputs and Training Datasets
In order to have a robust detector, we would require a set of rich training datasets. This should include people with a variety in gender and age (man, women, boy, girl) with millions of accurate annotation and labelling. We selected two large datasets of MS COCO and Google Open Image dataset that satisfy the above-mentioed expectations, by providing more than 3.7 million annotated people. Further, details will be provided in Section 6 (Model Training and Experimental Results).
In YOLOv4, the authors have dealt with two categories of training options for different parts of the network: “Bag of Freebies", which includes a set of methods to alter the model’s training strategy with the aim of increasing the generalisation; and “Bag of Specials” which includes a set of modules that can significantly improve the object detection accuracy in exchange for a small increase in training costs.
Among various techniques of Bag of Freebies, we used the Mosaic data augmentations (Bochkovskiy et al., 2020) which integrates four images into one, to increase the size of the input data without requiring to increase the batch size.
On the other hand, in batch normalisation, the batch size reduction causes noisy estimation of mean and variance. To address this issue, we considered the normalised values of the previous iterations instead of a single mini-batch. This is similar to Cross-Iteration Batch Normalisation (CBM) (Yao et al., 2020).
A set of possible activation functions for BoF are listed in Table 1. We also investigated the performance of our model against ReLU, Leaky ReLU, SELU, Swish, Parametric RELU, and Mish. Our preliminary evaluations confirmed the same results provided by Misra (Misra, 2019) for our human detection application. The Mish (Equation (1)) activation function converged towards the minimum loss, faster than Swish and ReLU, with higher accuracy. The result was consistent especially for diversity of parameter initialisers, regularisation methods, and lower learning rate values.
Mish:
| (1) | |||
with derivations:
| (2) |
as a self regularised non-monotonic activation function, where
| (3) |
and
| (4) |
3.1.2 Backbone Architecture
As illustrated in Figure 3, YOLOv4 offers the best trade-off for the speed and the accuracy for a multi-class object detection purpose; however, since YOLOv4 is an aggregation of various techniques, we undertook an in-depth study of each sub-techniques to achieve the best results for our single-class people detection model, and to outperform the state-of-the-art.
A basic way to improve the accuracy of CNN-based detectors is to expand the receptive field and enhance the complexity of the model using more layers; however, using this technique makes it harder to train the model. We suggest using a skip-connections technique for the ease of training, instead.
Various models use a similar policy to make connections between layers, such as Cross- Stage-Partial (CSP) connections (Wang et al., 2020) or Dense Blocks (consisting of Batch Normalisation, ReLU, Convolution, etc.) in DenseNet (Huang et al., 2017). Such models have also been used in the design of some recent backbone architectures, such as CSPResNeXt50, CSPDarknet53 (Wang et al., 2020) and EfficientNet-B3, which are our supported architectures options for YOLOv4.
Table 2 summarises the brief report of our investigations for the above-mentioned backbone architectures in terms of the number of parameters and the processing speed (in fps) for the same input size of .
Based on theoretical justifications in (Bochkovskiy et al., 2020) and several experiments by us, we concluded that CSPDarknet53 is the most optimal backbone model for our application, in spite of higher complexity (due to more number of parameters). Here, the higher number of parameters leads to the increased capability of the model in detecting multiple objects while at the same time we can maintain real-time performance.
3.1.3 Neck Module
Recently, some of the modern proposed models have placed some extra layers between the backbone and the head, called the neck, which is considered for feature collection from different stages of the backbone network.
The neck section consists of several top-down and bottom-up paths to collect and combine parameters of the network in different layers, in order to provide a more accurate image features for the head section.
Many CNN-based models use fully-connected layers for the classification part, and consequently, they can only accept fixed dimensions of images as input. This can lead to two types of issues: firstly, we cannot deal with low-resolution images and secondly, the detection of the small objects would be difficult. These are in contradiction with our objectives where we aim to have our model applicable in any surveillance cameras with any input image sizes and resolutions. In order to deal with the first issue we can refer to existing methodologies such as Fully Convolutional Networks (FCNs). Such models, including YOLO (in their recent versions) have no FC-layers and therefore can deal with images with different sizes. However, to cope with the second issue (i.e., dealing with small objects), we performed a pyramid technique to enhance the receptive field and extract different scales of the image from the backbone, and finally, performing a multi-scale detection in the head section.
In DNNs, the bottom layers (i.e., the first few layers) extract localised pattern and texture information to gradual build up of the semantic information which is required in the top layers. However, during the feature extraction process, some parts of the local information that may be required for fine-tuning of the model, may be lost. In PANet (Liu et al., 2018) approach, the information flow of the bottom layers will be added to top layers to strengthen of localised information; therefore, better fine-tuning and prediction can be expected. In a recent research by Bochkovskiy et al. (Bochkovskiy et al., 2020), it is shown that the concatenation operator performs better than addition operator to maintain the localised information and transferring them to the top layers.
In order to further enhancement of the receptive fields and achieve better detection power on the small objects, we consider YOLO Feature Pyramid Network module (FPN) (Lin et al., 2017) module for multi-scale detections. The module extracts features in different scales from the backbone. Ref. (Huang et al., 2020) improved YOLOv3 with a Spatial Pyramid Pooling layer (SPP) (He et al., 2014) module instead of FPN, that leads to a 2.7% increase in the on the MS COCO object detection. The improved SPP uses max-pooling operation instead of “Bag of Words" operation to address the issue of spatial dimensions and to deal with multi-scale detection in the head section. The method applies a max-pooling kernel, where , and stride equals to 1.
| Backbone Model | Input | Number of | Speed (fps) |
|---|---|---|---|
| Resolution | Parameters | ||
| CSPResNeXt50 | 20.6 M | 62 | |
| CSPDarknet53 | 27.6 M | 66 | |
| EfficientNet-B3 | 12.0 M | 26 |
In Section 4 we will examine the efficiency of this approach in improving the accuracy of our YOLOv4 based model. Figure 5 shows the multi-scale heads that we used in our network for object detection at different sizes.
Experimenting various rational configurations for the neck module of our model, we use spatial pyramid pooling (SPP) and PAN as well as the Spatial Attention Module (SAM) (Woo et al., 2018) which together made one of the most effective, consistent and robust components to focus the model on optimising the parameters.
3.1.4 Head Module
The head of a DNN is responsible for classifying the objects (e.g., people, bicycles, chairs, etc.) as well as calculating the size of the objects and the coordinates of the correspondent bounding boxes.
There are usually two types of head sections: one-stage (dense) and two-stage (sparse). The two-stage detectors use the region proposal before applying the classification. First, the detector extracts a set of object proposals (candidate bounding boxes) by a selective search. Then it resizes them to a fixed size before feeding them to the CNN model. This is similar to R-CNN based detectors (Girshick et al., 2014; Girshick, 2015; Ren et al., 2017).
In spite of the accuracy of two-stage detectors, such methods are not suitable for the systems with restricted computational resources (Sharifi et al., 2020).
On the other hand, the one-stage detectors perform a unified detection process. They map the image pixels to the enclosed grids and checks the probability of the existence of an object in each cell of the grids.
Similar to the work done by Liu et al. “Single Shot Multibox Detector” (known as SSD) , or other works done by Redmon et al. (Redmon et al., 2016; Redmon and Farhadi, 2017, 2018), and Bochkovski et al. (Bochkovskiy et al., 2020), known as “You Only Look Once” or YOLO detectors. Such detectors use regression analysis to calculate the dimensions of bounding boxes and interpret their class probabilities. This approach offers excellent improvements in terms of speed and efficiency.
In the head of the model, we use the same configuration as YOLOv3. Similar to many other anchor-based models, YOLO uses predefined boxes to detect multiple objects. Then the object detection model will be trained to predict each generated anchor boxes that belong to a particular class. After that, an offset will be used to adjust the dimensions of the anchor box in order to better match with the ground-truth data, based on the classification and regression loss.
Assuming the grid cell reference point at the top left corner of the object image and the bounding box prior with the width and height (), the network predicts a bounding box at the centre and the size of with the corresponding offset and scales of () as follows:
| (5) |
where is the Sigmoid confidence score function within the range of 0 and 1.
We represent the class of “human” with a 4-tuple , where is the centre of the bounding box, and are width and height, respectively.
We use three anchor boxes to find a maximum of three people in each grid cell. Therefore, the total number of channels is 18: (1 class + 1 object + 4 coordinates) 3 anchors.
Since we have multiple anchor boxes for each spatial location, a single object may be associated with more than one anchor boxes. This problem can be resolved by using non-maximal suppression (NMS) technique and by computing intersection over union (IoU) to limit the anchor boxes association.
As part of the weight adjustment and loss minimisation operation, we use Complete IoU (CIoU) (in Equation (7)) instead of the basic IoU (Equation (6)). The CIoU not only compares the location and distance of the candidate bounding boxes to the ground-truth bounding box but also it compares the aspect ratio of the size of the generated bounding boxes with the size of the ground-truth bounding box.
| (6) |
is the ground-truth box, and is the predicted box. We use CIoU not only as a detection metric but also as a loss function:
| (7) |
where is Euclidean distance between grand-truth , and predicted bounding box. The diagonal length of the smallest bounding box enclosing both boxes and is represented by ; and is a positive trade-off parameter:
| (8) |
and measures the consistency of the aspect ratio, as follows:
| (9) |
Even in case of zero-percent overlapping, the loss functions still gives us an indication on how to adjust the weights to firstly converge the aspect size towards 1, and secondly, how to reduce the error distance of candidate bounding boxes to the centre of the ground-truth bounding box. A similar approach called Distance-IoU is used in (Zheng et al., 2019) for another application.
To prevent the overfitting issue we evaluated some common regularisation techniques as shown in the Table 1. Similar to the outlined results in (Ghiasi et al., 2018), we found the DropBlock (DB) as one of the most effective regularisation methods in comparison with the other options.
In this regard, class label smoothing (Müller et al., 2019) also helps to prevent over-fitting by reducing the model’s confidence in the training phase.
Figure 6 summarises the three-level structure of our human detection module in a sequence of interconnected components. In the input part, the Mosaic data augmentation (MDA), class label smoothing (CLS) and DropBlock (DB) regularisation are applied to the input image. In the detector part, the Mish activation function has been used, and CIoU metric is considered as the loss function. In the prediction part, for each cell at each level, the anchor boxes contain the information required to locate the bounding box, confidence ratio of the object, and the corresponding class of the object. In total, we have nine anchor boxes.
3.2 People Tracking
The next step after the detection phase is people tracking and ID assignment for each individual.
We use the Simple Online and Real-time (SORT) tracking technique (Bewley et al., 2016) as a framework for the Kalman filter (Rezaei and Klette, 2017) along with the Hungarian optimisation technique to track the people. Kalman filter predicts the position of the human at time based on the current measurement at time and the mathematical modelling of the human movement. This is an effective way to keep localising the human in case of occlusion.
The Hungarian algorithm is a combinatorial optimisation algorithm that helps to assign a unique ID number to identify a given object in a set of image frames, by examining whether a person in the current frame is the same detected person in the previous frames or not.
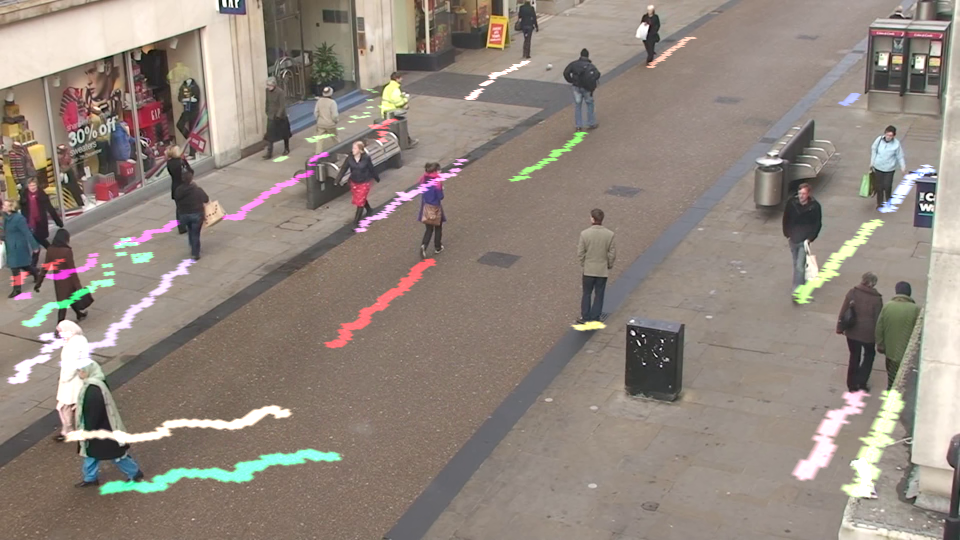
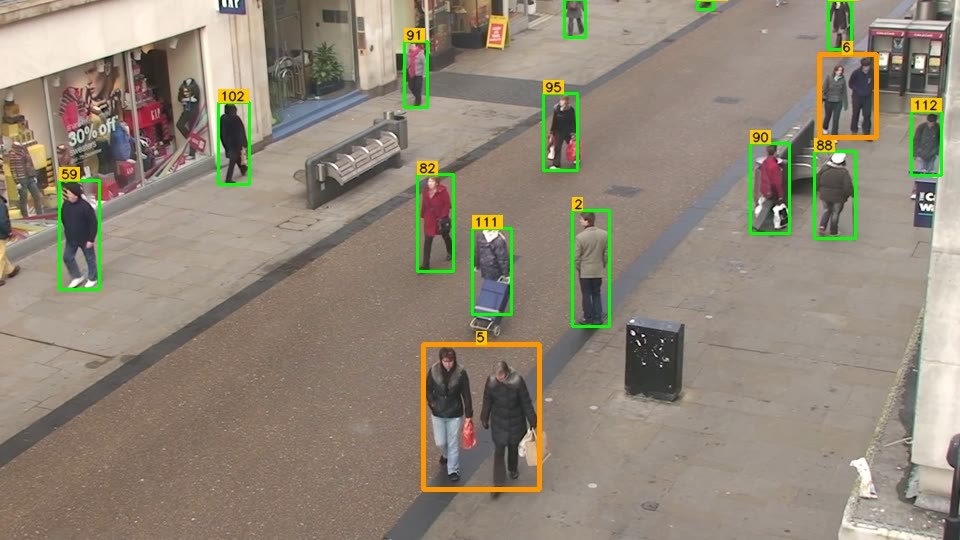
Figure 7a shows a sample of the people detection and ID assignment, Figure 7b illustrates the tracking path of each individual, and Figure 7c shows the final position and status of each individual after 100 frames of detection, tracking, and ID assignment. We later use such temporal information for analysing the level of social distancing violations and high-risk zones of the scene. The state of each human in a frame is modelled as:
| (10) |
where represent the horizontal and vertical position of the target bounding box (i.e., the centroid); denotes the scale (area), and is the aspect ratio of the bounding box sides. , , and are the predicted values by Kalman filter for horizontal position, vertical position, and bounding box centroid, respectively.
When an identified human associates with a new observation, the current bounding box will be updated with the newly observed state. This will be calculated based on the velocity and acceleration components, estimated by the Kalman filter framework. If the predicted identities of the query individual significantly differ from the new observation, almost the same state that is predicted by the Kalman filter will be used with almost no correction. Otherwise, the corrections weights will be split proportionally between the Kalman filter prediction and the new observation (measurement).
As mentioned earlier, we use the Hungarian algorithm to solve the data association problem, by calculating the IoU (Equation (6)) and the distance (difference) of the actual input values to the predicted values by the Kalman filter.
After the detection and tracking process, for every input frame at time , we define the matrix that includes the location of detected human in the image carrier grid:
| (11) |
3.3 Inter-Distance Estimation
Stereo-vision is a popular technique for distance estimation such as in (Saleem et al., 2018); however, this is not a feasible approach in our research when we aim at the integration of an efficient solution, applicable in all public places using only a basic CCTV camera. Therefore we adhere to a monocular solution.
On the other hand, by using a single camera, the projection of a 3-D world scene into a 2-D perspective image plane leads to unrealistic pixel-distances between the objects. This is called perspective effect, in which we can not perceive uniform distribution of distances in the entire image. For example, parallel lines intersect at the horizon and farther people to the camera seem much shorter than the people who are closer to the camera coordinate centre.
 |
 |
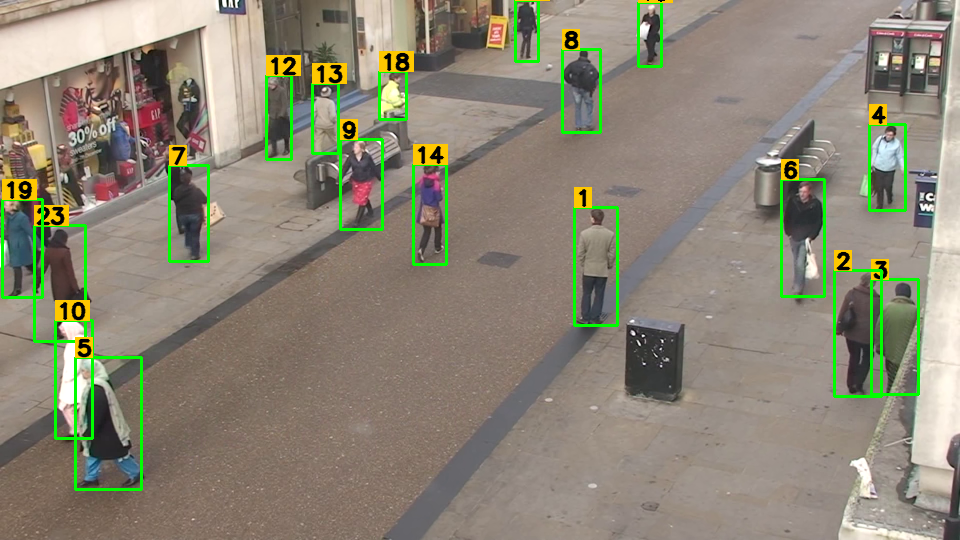 |
| (a) People detection and ID | (b) Sample tracking for | (c) Final positions and IDs |
| assignment at frame 0 | frames 0 to 100 | at frame 100 |
In 3-dimensional space, the centre or the reference point of each bounding box is associated with three parameters , while in the image received from the camera, the original 3D space is reduced to two-dimensions of , and the depth parameter is not available. In such a lowered-dimensional space, the direct use of the Euclidean distance criterion to measure inter-people distance estimation would be erroneous.
In order to apply a calibrated IPM transition, we first need to have a camera calibration by setting to eliminate the perspective effect. We also need to know the camera location, its height, angle of view, as well as the optics specifications (i.e., the camera intrinsic parameters) (Rezaei and Klette, 2017).
By applying the IMP, the 2D pixel points will be mapped to the corresponding world coordinate points :
| (12) |
where is the rotation matrix:
| (13) |
is the translation matrix:
| (14) |
and , the intrinsic parameters of the camera are shown by the following matrix:
| (15) |
where is the camera height, is focal length, and and are the measured calibration coefficient values in horizontal and vertical pixel units, respectively. is the principal point shifts that corrects the optical axis of the image plane.
The camera creates an image with a projection of three-dimensional points in the world coordinate that falls on a retina plane. Using homogeneous coordinates, the relationship between three-dimensional points and the resulting image points of projection can be shown as follows:
| (16) |
where is the transformation matrix with elements in Equation (16), that maps the world coordinate points into the image points based on the camera location and the reference frame, provided by the Camera Intrinsic Matrix (Equation (15)), Rotation Matrix (Equation (13)) and the Translation Matrix (Equation (14)).
Considering the camera image plane perpendicular to the access in the world coordinate system (i.e., ) the dimensions of the above equation can be reduced to the following form:
| (17) |
and finally transferring from the perspective space to inverse perspective space (BEV) can also be expressed in the following scalar form:
| (18) | |||
4 Model Training and Experimental Results
In this section we discuss the steps taken to train our human detection model and the investigated datasets to train the model, followed by experimental results on people detection, social distancing measures, and risk infection assessment.
4.1 Model Training
Four common multi-object annotated datasets were investigated including PASCAL VOC (Everingham et al., 2010), Microsoft COCO (Chen et al., 2015), Image Net ILSVRC (Russakovsky et al., 2015), and Google Open Images Datasets V6+ (Kuznetsova et al., 2020) which included 16 Million ground-truth bounding boxes in 600 categories. The dataset was a collection of 19,957 classes and the major part of the dataset was suitable for human detection and identification. The dataset was annotated using the bounding-box labels on each image along with the corresponding coordinates of each label.
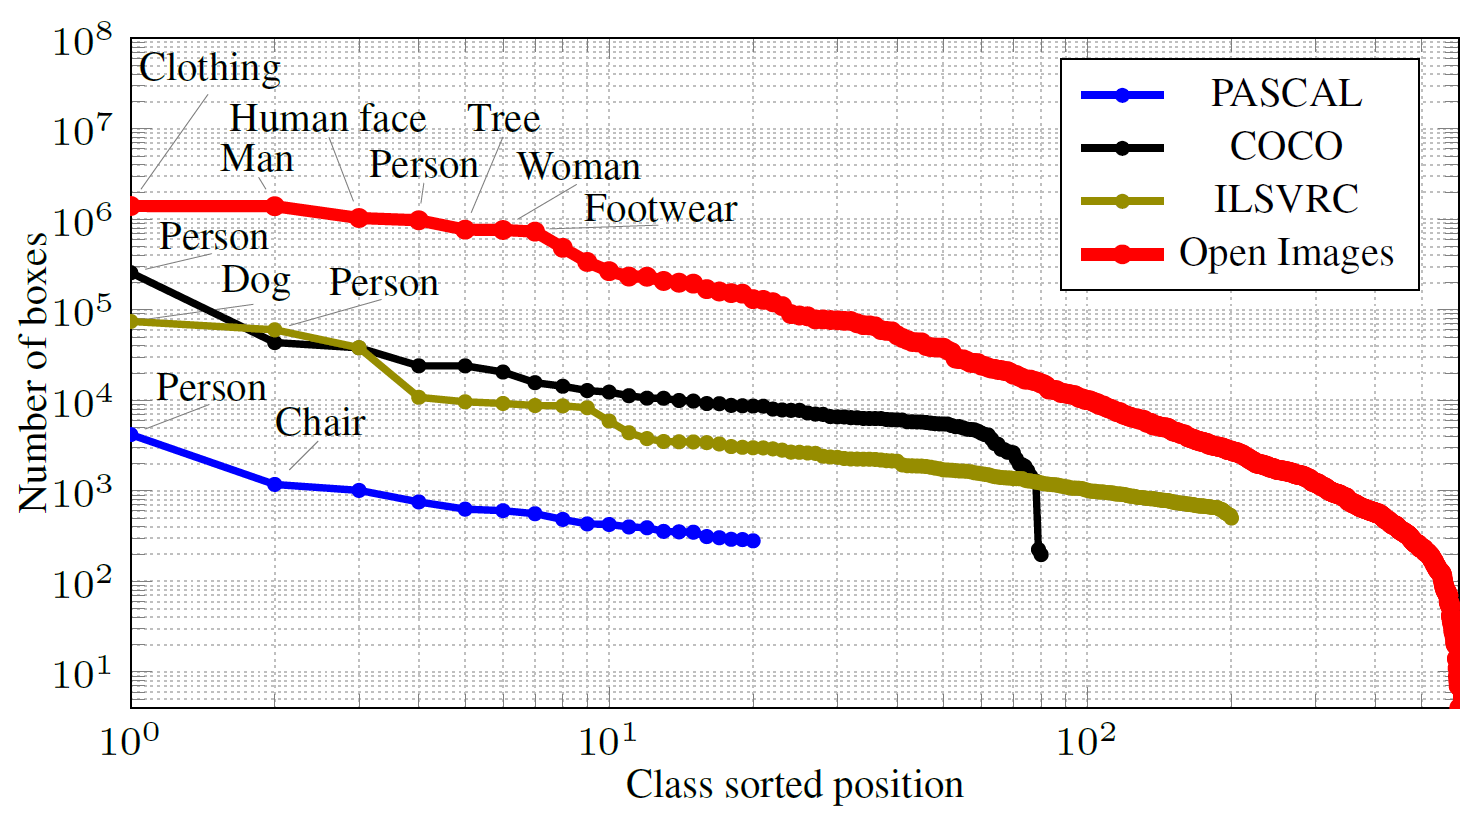
Figure 8 represents the sorted rank of object classes with the number of bounding boxes for each class in each dataset. In Google Open Images dataset (GOI) the class “Person” shows the rank, with nearly annotated bounding boxes; richer than other three investigated datasets. In addition to the class person, we also adopted four more classes of “Man”, “Woman”, “Boy”, and “Girl” from the GOI dataset for the “human detection” training purpose. This made a total number of 3,762,615 samples that we used from training, including 257,253 samples from the COCO dataset and 3,505,362 samples from the GOI dataset.
We also considered the category of human body parts such as the legs as we believe this allows the detector to learn a more general concept of a human being, particularly in occluded situations or in case of partial visibility e.g., at the borders of the input image where the full-body of the individuals can not be perceived.
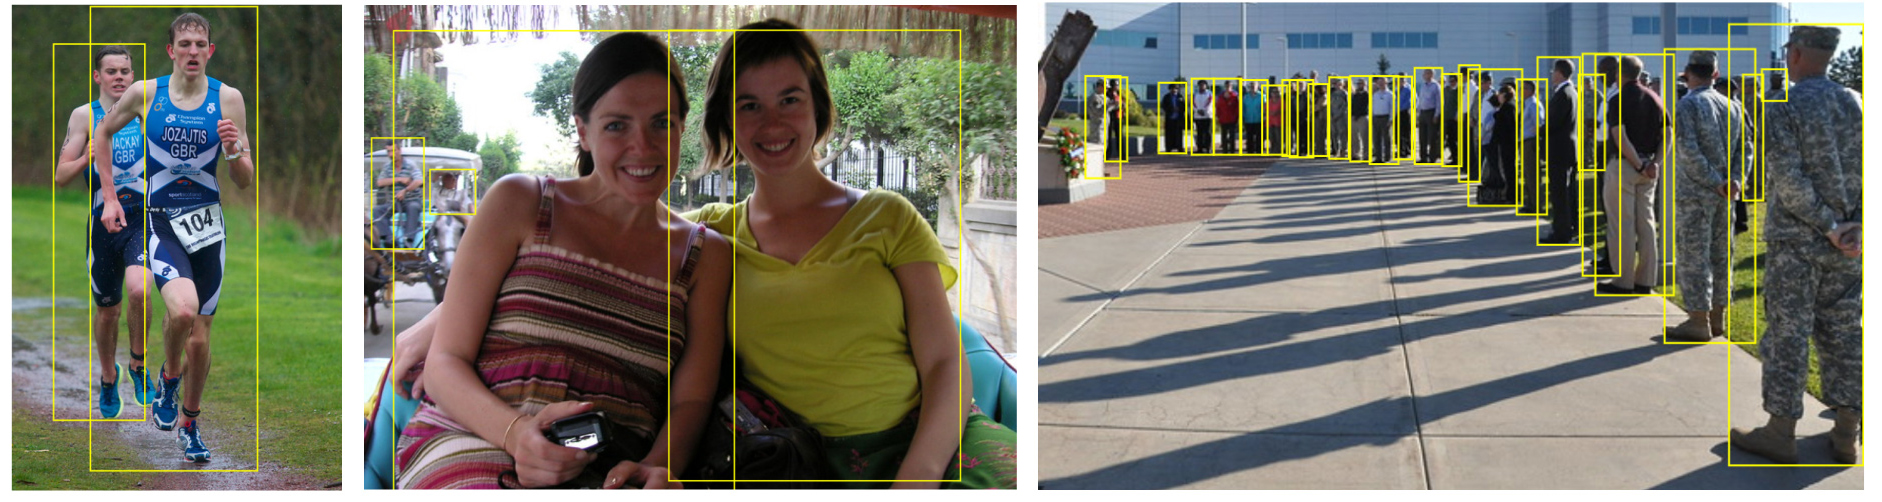
Figure 9 shows examples of annotated images from the Open Images Dataset. The figure illustrates the diversity of the annotated people including large and small bounding boxes, in far and near distances to the camera image plane, people occlusion, as well as variations in shades and lighting conditions.
In order to train the developed model, we considered a transfer learning approach by using pre-trained models on Microsoft COCO dataset (Chen et al., 2015) followed by fine-tuning and optimisation of our YOLO-based model.
We also used Stochastic Gradient Descent (SGD) with warm restarts (Loshchilov and Hutter, 2016) to change the learning rate during the training process. This helped to jump out of local minima in the solution space and save the training time. The method initially considered a large value of the learning rate, then slowed down the learning speed halfway, and eventually reduced the learning rate for each batch, with a tiny downward slope. We decreased the learning rate using a cosine annealing function for each batch as follows:
| (19) |
where is the current learning rate in the th run, and are the minimum and maximum target learning rates. is the number of epochs executed since the last restart, and is the number of epochs performed since the restart of the SGD.
4.2 Performance Evaluation
In order to test the performance of the proposed model, we used the Oxford Town Centre (OTC) dataset (Harvey, 2019) as a previously unseen and challenging dataset with very frequent cases of occlusions, overlaps, and crowded zones. The dataset also contained a good diversity of human specimens in terms of clothes and appearance in a real-world public place.
In order to provide a similar condition for performance analysis of YOLO based models, we fine-tuned each model on human categories of the Google Open Images (GOI) (Kuznetsova et al., 2020) data set. This was done by removing the last layer of each model and placing a new layer (with random values of the uniform probability distribution) corresponding to a binary classification (presence or absence of a human). Furthermore, in order to provide an equal condition for the speed and generalisability, we also tested each of the trained models against the OTC dataset (Harvey, 2019).
We evaluated and compared our developed models against three common metrics of object detection in computer vision, including Precision Rate, Recall Rate, and FPS against three state-of-the-art human/object detection methods.
All of the benchmarking tests and comparisons were conducted on the same hardware and software: a Windows 10-based platform with an Intel© Core™ i5-3570K processor and an NVIDIA RTX 2080 GPU with CUDA version 10.1.
In terms of mass deployment of the system, the above hardware setup can handle up to 10 input cameras for real-time monitoring of e.g., different floors and angles of large shopping malls. However, for smaller scales, a cheaper RTX 1080 GPU or an 8-core/16-thread 10th generation Core™ i7 CPU would suffice for real-time performance.
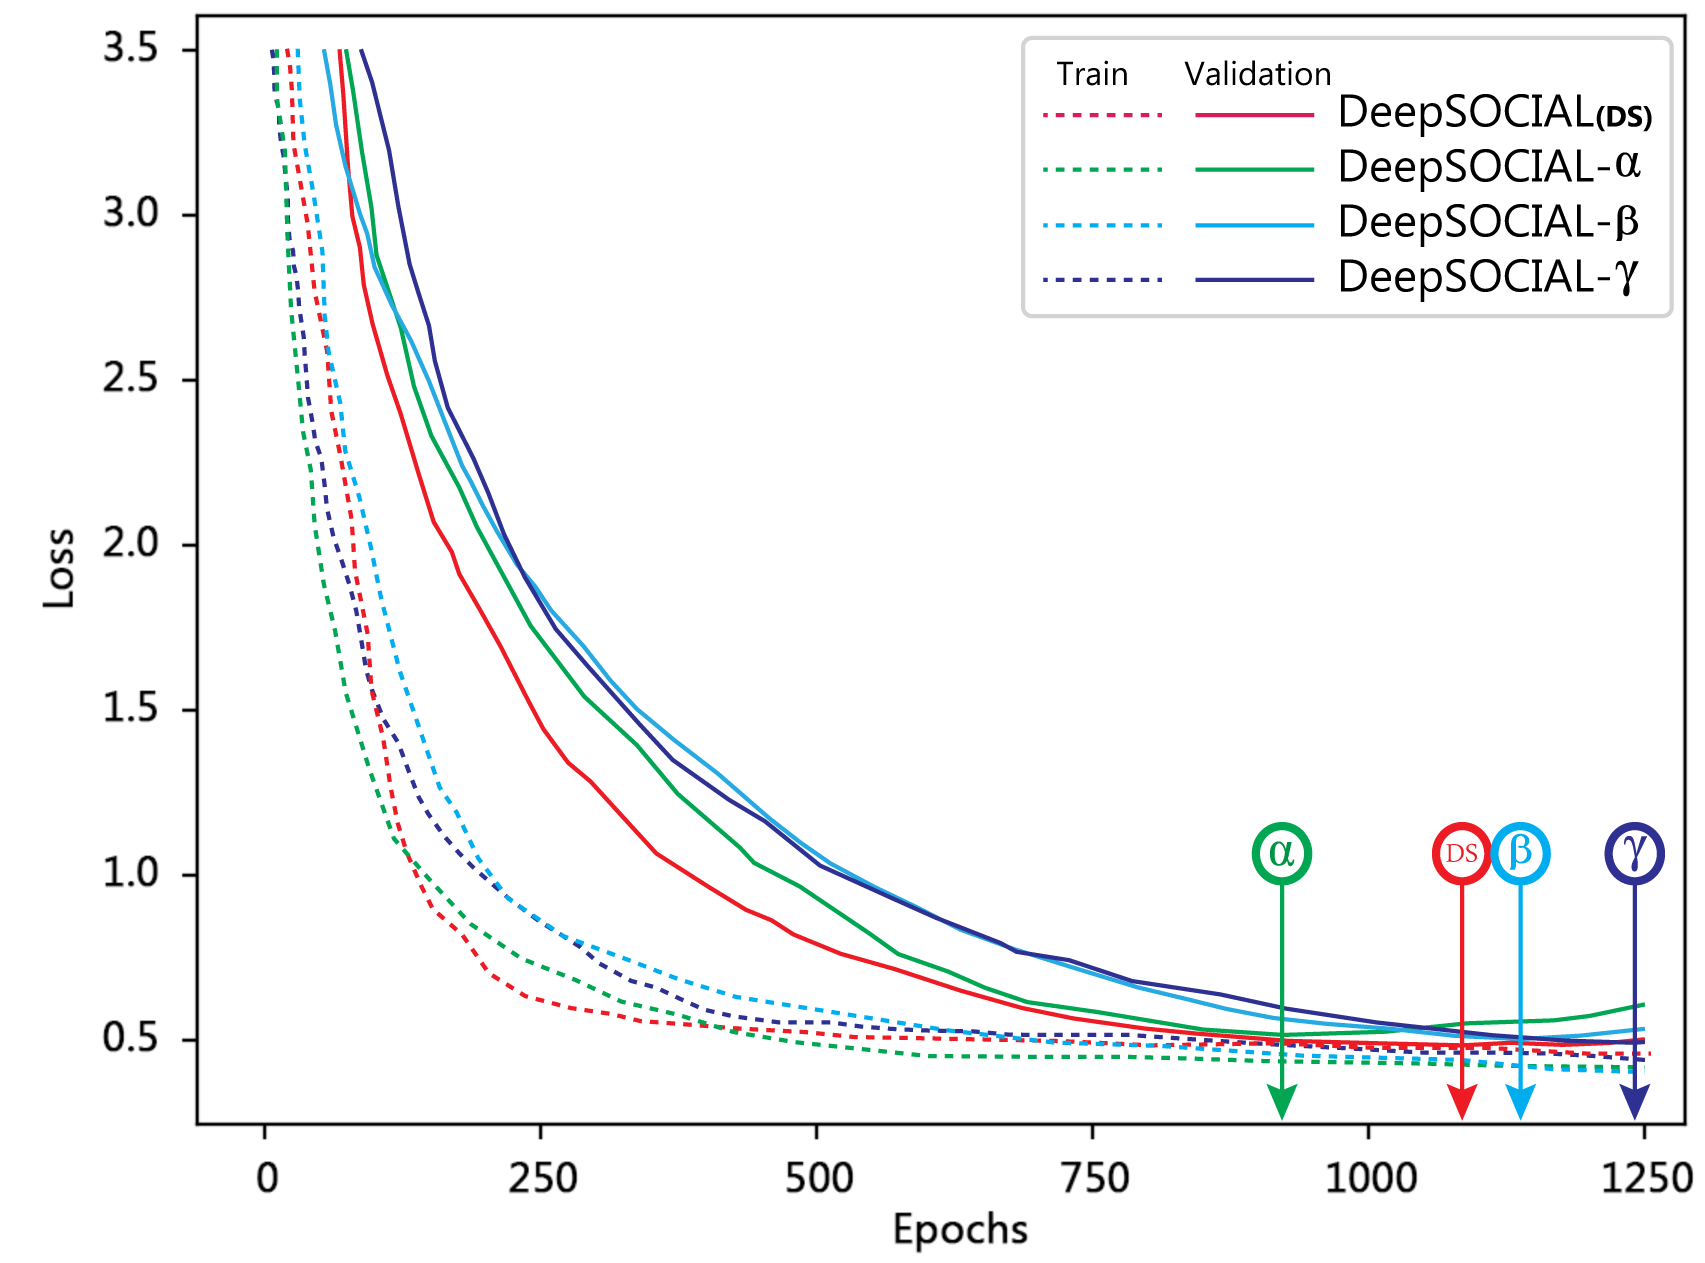
Figure 10 illustrates the development of loss function in training and validations phases for four versions of our DeepSOCIAL model with different backbone structures. The graphs confirm a fast yet smooth and stable transition for minimising the loss function in DS version after 1090 epochs where we reached to an optimal trade-off point for both the training and validation loss. Table 3 provides the details of each backbone and the outcome of the experimental results against three more state-of-the-art model on the OTC Dataset.
| Method | Backbone | Precision | Recall | FPS |
|---|---|---|---|---|
| DeepSOCIAL- | CSPResNeXt50-PANet-SPP-SAM | 99.8% | 96.7 | 23.8 |
| DeepSOCIAL- | CSPDarkNet53-PANet-SPP | 99.5% | 97.1 | 24.1 |
| DeepSOCIAL- | CSPResNeXt50-PANet-SPP | 99.6% | 96.7 | 23.8 |
| DeepSOCIAL (DS) | CSPDarkNet53-PANet-SPP-SAM | 99.8% | 97.6 | 24.1 |
| YOLOv3 | DarkNet53 | 84.6% | 68.2 | 23 |
| SSD | VGG-16 | 69.1% | 60.5 | 10 |
| Faster R-CNN | ResNet-50 | 96.9% | 83.0 | 3 |
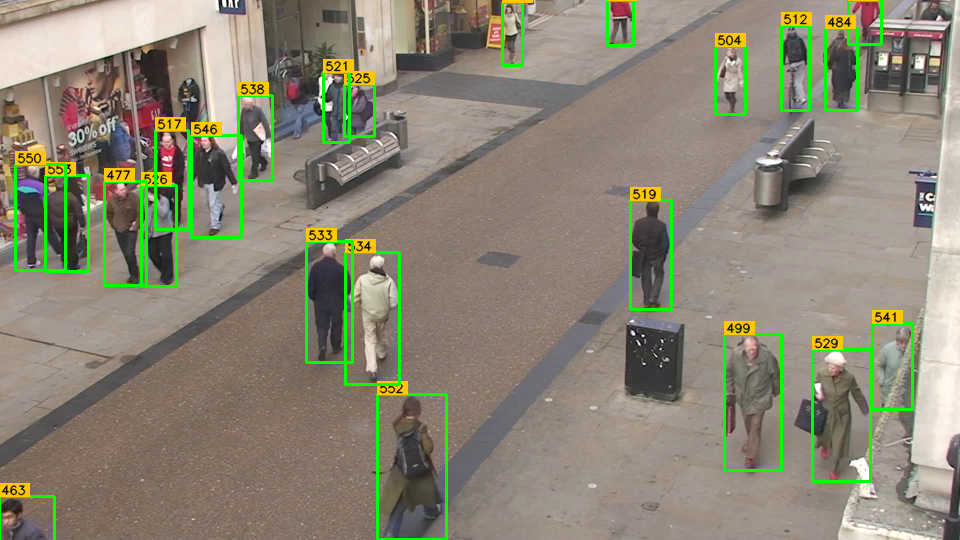
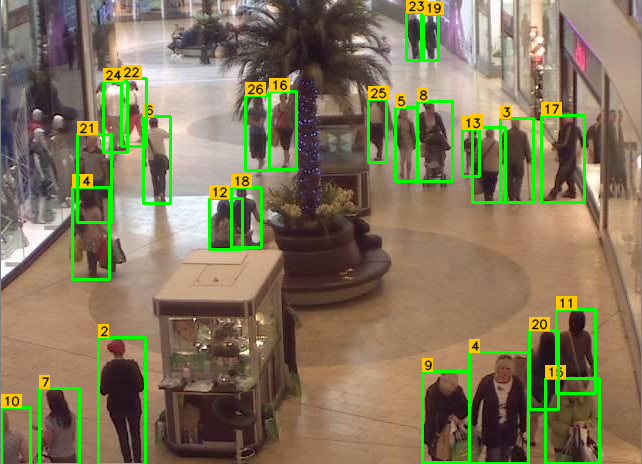
Figure 11 visualises the robustness of the proposed detectors in three challenging indoor/outdoor publicly available datasets: Oxford Town Centre, Mall Dataset, and Train Station Dataset.
Interestingly, the Faster-RCNN model showed good generalisability; however, its low speed was an issue which seems to be due to the computational cost of the “region proposal” technique. Since the system required a real-time performance, any model with the speeds slower than 10 fps and/or a low level of accuracy may not be a suitable option for Social Distancing monitoring. Therefore, SSD and Faster-RCNN failed in this benchmarking assessment, despite their popularity in other applications. YOLOv3 and YOLOv4 based DeepSOCIAL–X methods provided relatively better results comparing the other models, and finally, the proposed DeepSOCIAL-DS model outperformed all of the assessed models in terms of both speed and accuracy.
 |
 |
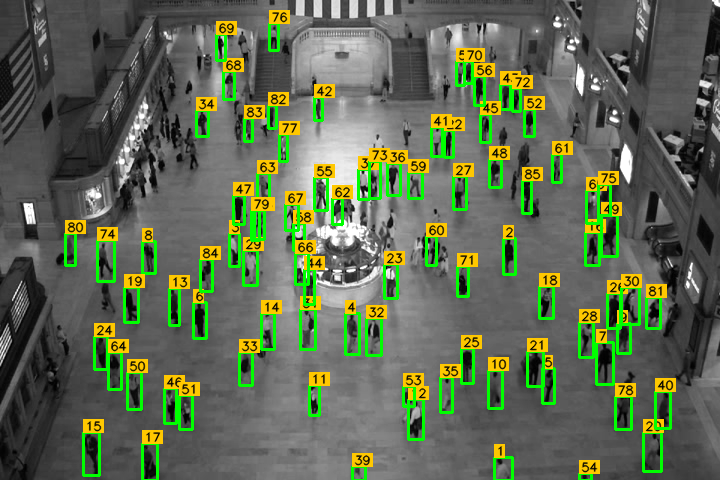 |
| (a) Oxford Town Centre (Harvey, 2019) | (b) Mall Dataset (Chen et al., 2012) | (c) Train Station (Zhou et al., 2012) |
Figure 12 provides sample footage of the challenging scenarios when the people either entered or exited the scene, and only part of their body (e.g., their feet) was visible. The figure clearly indicates the strength of DeepSOCIAL in Row (a), comparing to the state-of-the-art. The bottom row (d) with blue bounding boxes shows the ground-truth while some of the existing people with partial visibility are not annotated even in original ground-truth dataset. Row (c), YOLOv3 shows a couple of more detections; however, the IoU of the suggested bounding boxes are low and some of them can be counted as false positives. Row (b), the standard YOLOv4-based detector, shows a significant improvement comparing to row (c) and is considered as the second-best. Row (a), the DeepSOCIAL, shows 10 more true positive detections (highlighted by vertical arrows) comparing to the second best approach.
Although the DeepSOCIAL model showed superior results even in challenging scenarios such as partial visibility and truncated objects, there could be some further challenges such as detections in extreme lighting conditions and lens distortion effects that may affect the performance of the model. This requires further investigations and experiments. Unfortunately, at the time of this research, there were no such datasets publicly available for our assessment.
4.3 Social Distancing Evaluations
We considered the midpoint of the bottom edge of the detected bounding boxes as our reference points (i.e., shoes’ location). After the IPM, we would expect to have the location of each person, in the homogeneous space of BEV with a linear distance representation.
Any two people with the Euclidean distance of smaller than (i.e., the set restriction) in the BEV space were considered as contributors in social distancing violation:
Depending on the type of overlapping and the violation assessment criteria, we define a violation detection function with the input parameters of a pixel metrics , the set safe distance of (e.g., or 2 m), the position of the query human , and the closest surrounding person .
| (20) |
where is the number of pixels in a line that represent a 1.0-m length in the BEV space.
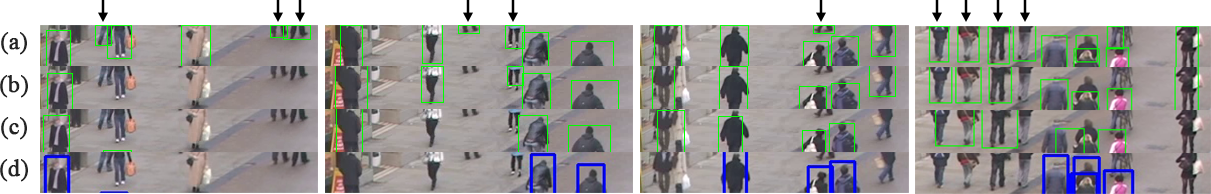
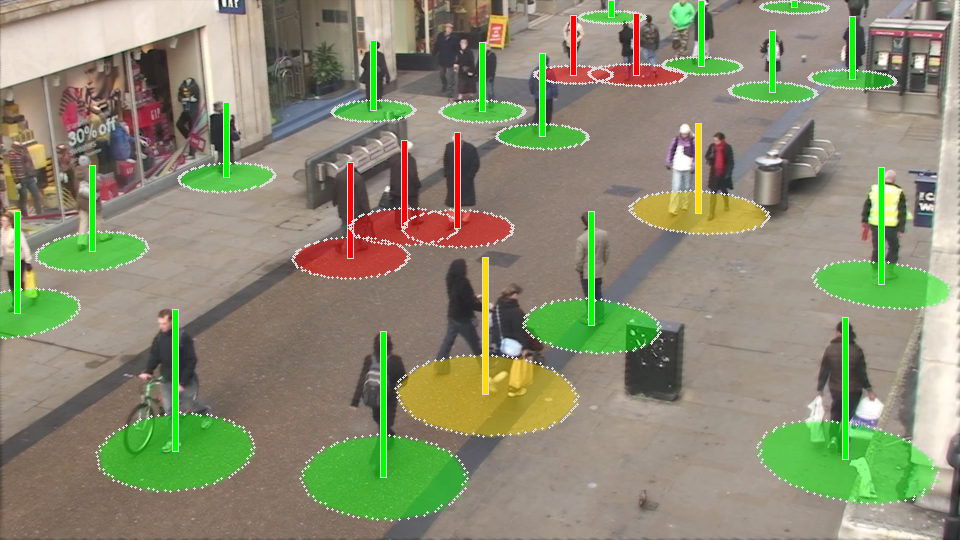
Figure 13 left (from Oxford Town Centre Dataset (Harvey, 2019)) shows the detected people followed by the steps we have taken for inter-people distance estimation including tracking, IPM, homogeneous distance estimation, safe movements (people in green circles) and the violating people (with overlapping red circles):
| (21) |
Regarding the Oxford Town Centre (OTC) dataset, every 10 pixels in the BEV space was equivalent to 98 cm in the real world. Therefore, and equal to 20 pixels. The inter-people distance measurement was measured based on the Euclidean norm distance (Equation (21)).
One of the controversial opinions that we received from health authorities was the way of dealing with family members and couples in social distancing monitoring. Some researchers believed social distancing should apply on every single individual without any exceptions and others were advising the couples and family members can walk in a close proximity without being counted as a breach of social distancing. In some countries such as in the UK and EU region the guideline allows two family members or a couple walk together without considering it as the breach of social distancing. We also considered a solution to activate the couple detection. This will be helpful when we aim at recognising risky zones based on the statistical analysis of overall movements and social distancing violations over a mid or long period (e.g., from few hours to few days).
Applying a temporal data analysis approach, we consider two individuals as a couple, if they are less than meters apart in an adjacency, for a of more than seconds. As an example, in Figure 14a, we have identified people who have been less a meter apart from each other for more than s, in the same moving trajectory:
| (22) | |||
Figure 14b shows a sample of our representation for detected couples in a scene as well as multiple cases of social distancing violations. The yellow circles drawn for people diagnosed as couples have a radios of meter to ensure a minimum safety distance of 2 m for each of them to their left and right neighbours. is the distance of coupled members to each other.
In cases where a breach occurs between two neighbouring couple, or between a couple and an individual, all of the involved people will turn to red status, regardless of being a couple or not.
The flexibility of our algorithm in considering different types of scenarios enables the policymakers and health authorities to proceed with different types of investigations and evaluations for the spread of the infection.
 |
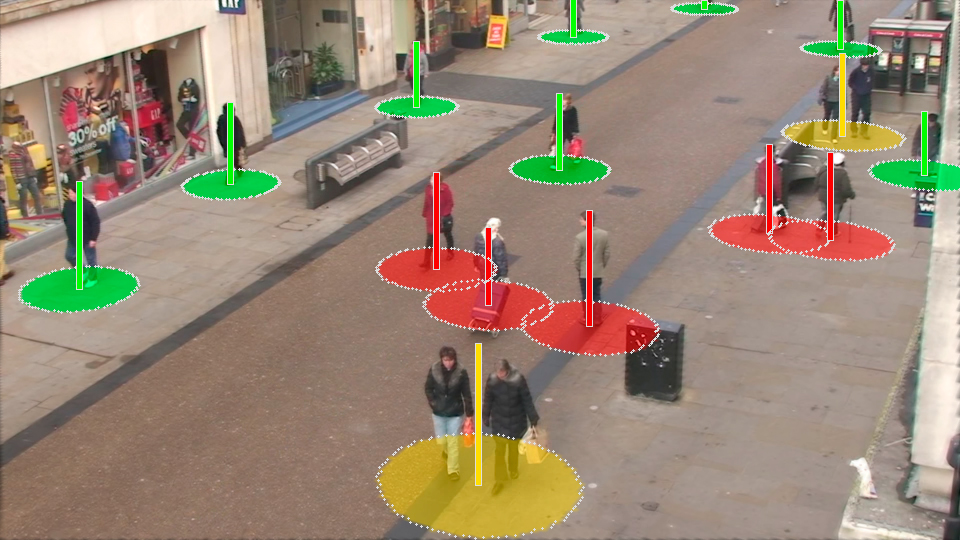 |
| (a) Examples of coupled people detections- | (b) Three types of detections: safe, violations, |
| orange bounding boxes | coupled |
For example, Figure 15 from the Oxford Town Centre dataset, provides a basic statistics about the number of people in each frame, the number of people who do not observe the distancing, the number of social distancing violations without counting the coupled groups as violations.
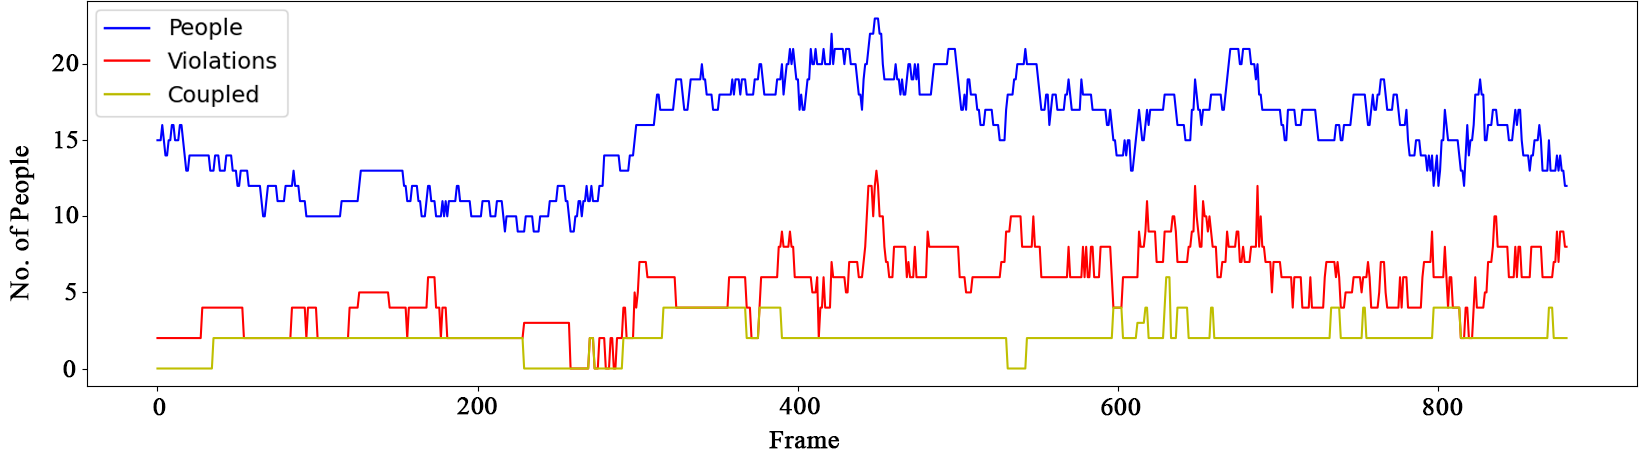
Regarding the coupled group we reached to an accuracy and recall rate of 98.7% and 23.9 , respectively which is slightly lower than our results of normal human detection as per the Table 3. This was expected due to added complexity in tracking two side by side people and possibly more complex occlusion scenarios.
4.4 Zone-Based Risk Assessment
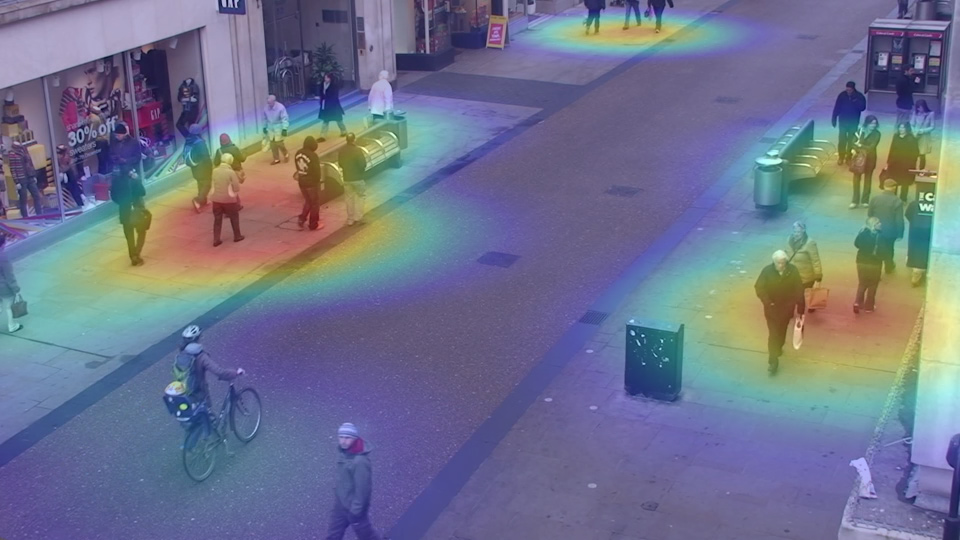
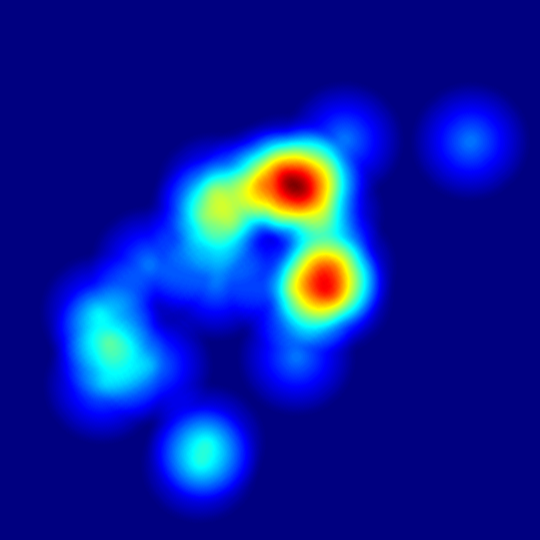
We also tested the effectiveness of our model in assessing the long-term behaviour of the people. This can be valuable for health sector policymakers and governors to make timely decisions to save lives and reduce the consequent costs. Our experiments provided very interesting results that can be crucial to control the infection rates before it raises uncontrolled and unexpectedly.
In addition to people inter-distance measurement, we considered a long-term spatio-temporal zone-based statistical analysis by tracking and logging the movement trajectory of people, density of each zone, the total number of people who violated the social-distancing measures, the total time of the violations for each person and as the whole, identifying high-risk zones and ultimately, creating an informative risk heat-map.
In order to perform the analysis, a 2-D grid matrix (initially filled by zero) was created to keep the latest location of individuals using the input image sequences. represents the status of the matrix at time and and are the width and height of the input image , respectively.
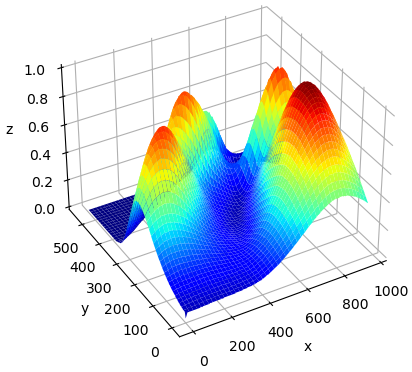
To consider environmental noise and better visualisation of the intended heat-map, every person was associated with a Gaussian kernel :
| (23) |
where and indicate the centre point of the predicted box for each individual, .
The grid matrix will be updated for every new frame and accumulates the latest information of the detected people.
| (24) |
Figure 16 shows a sample representation of the accumulated tracking map after 500 frames of continuous people detection.
 |
 |
|
| (a) BEV heat map | (b) 2D Mosaic heat map |
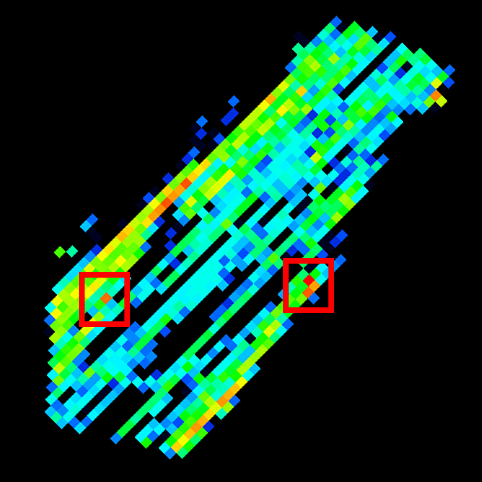
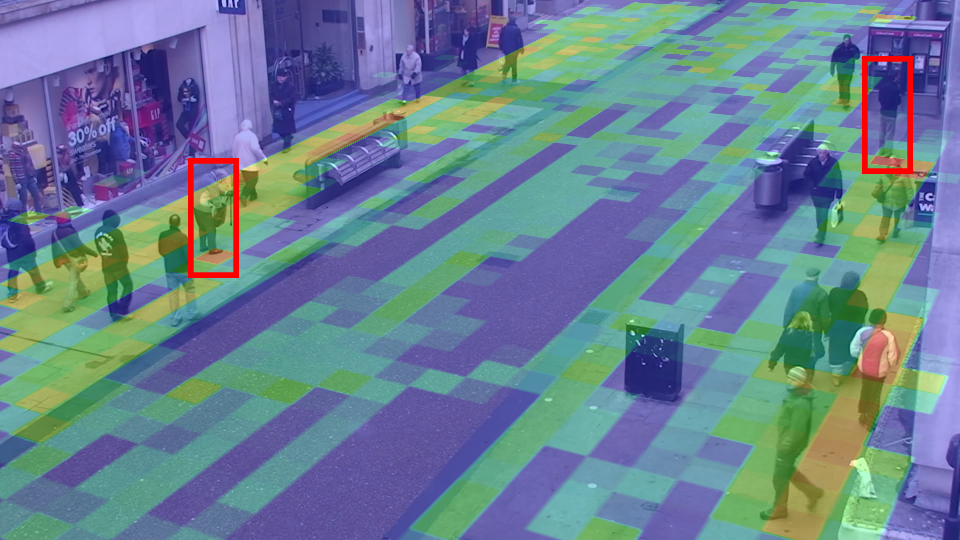
Since COVID-19 is an airborne virus, breathing by any static person in a fixed location can increase the density of the contamination on that point (assuming the person may carry the COVID-19), particularly in covered places with minimal ventilation. Therefore we can assign a more contamination weight to the steady-state people.
Figure 16a,b shows two instances of cases where two people wew steady in two particular locations of the grid for a long period; hence, the heat map was turning red for those locations. Both side-walks also showed stronger heat map than the middle of the street due to the higher traffic of people movements. In general, the more red grids potentially indicate more risky spots.
In addition to people raw movement and tracking data, it would be more beneficial to analyse the density and the location of the people who particularly violated the social distancing measures.
In order to have a comprehensive set of information, we aimed to represent a long term heat-map of the environment based on the combination of accumulated detections, movements, steady-state people, and total number of breaches of the social-distancing. This helped to identify risky zones, or redesign the layout of the environment to make it a safer place, or to apply more restrictions and/or limited access to particular zones. The restriction rules may vary depending on the application and the nature of the environment (e.g., this can vary in a hospital compared to a school).
Applying the social distancing violation criteria as per Equation (20), we identified each individual in one of the following categories:
-
•
Safe : All people who observed the social distancing (green circles).
(25) -
•
High-risk: All people who violated the social distancing (red circles).
(26) -
•
Potentially risky: Those people who moved together (yellow circles) and were identified as coupled. Any two people in a coupled group were considered as one identity as long as they did not breach the social distancing measures with their neighbouring people.
(27)
We also used a 3-D violation matrix to record the location of breaches for each person and its type (red or yellow):
| (28) | ||||
where , , and indicate cases with a violation, tracked people, and couples, respectively. , , and are the relative coefficients that can be set by health-related researches depending on the importance of each factor in spreading the virus.
In order to visualise the 3D heat map of safe and red zones, we normalised the collected data in Equation (28) as follows:
| (29) |
where X is the non-normalised values, and are the lower bound and upper bound of the normalisation matrix that we used to define the Hue colour range on the HSV channel.
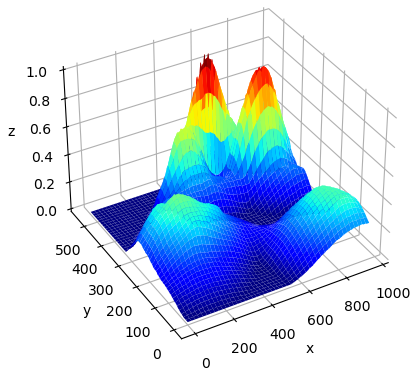
Figure 17 shows a visualised output of the discussed experiments including tracking, 2-D and 3-D analytical heat-map of risky zones for the Oxford Town Centre dataset in HSV colour space:
| (30) | ||||
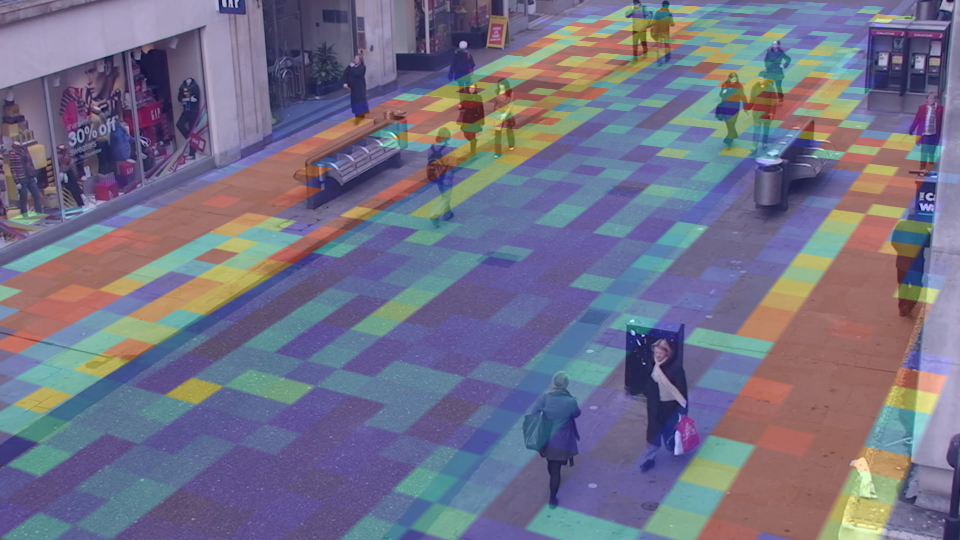
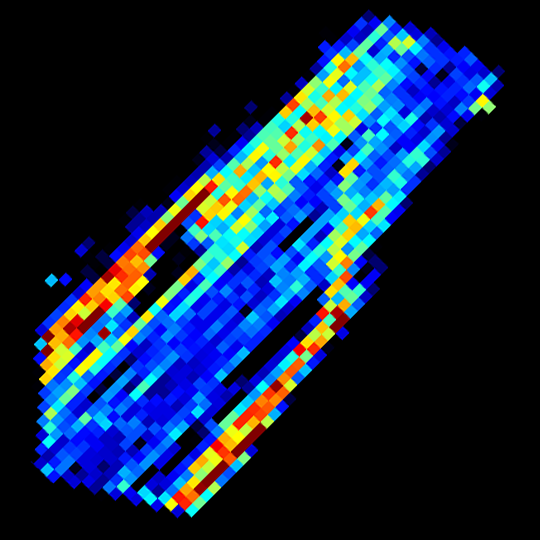
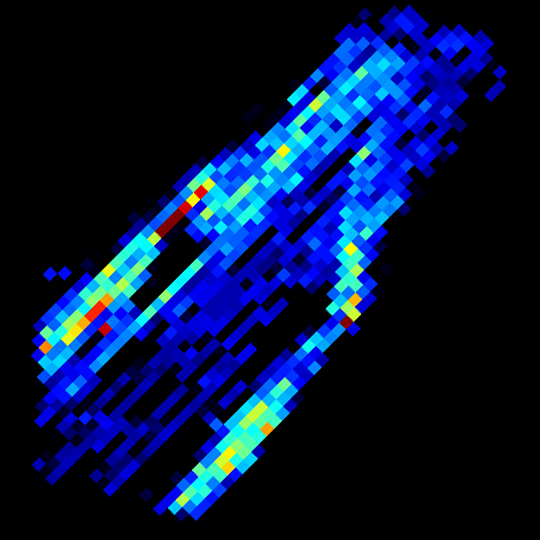
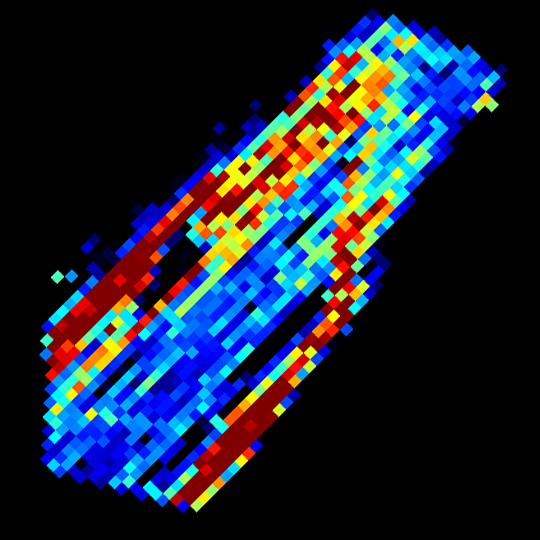
Figure 17b shows the tracking paths of the passed people after 2500 frames. Figure 17b illustrates a Mosaic heatmap of people with social distancing violations only. Figure 17b shows the summed heatmap of social distancing violations and tracking. Figures 17d–f show the birds-eye view heatmap of long term-tracking, violations, and the mixed heatmap, respectively. Figures 17g–i are the corresponding 3D representation of the same heatmaps in the second row, for better visualisation of safe and risky zones.
The above configuration was an accumulating approach where all the violations and risky behaviours were added together in order to highlight potentially risky zones in a covered area with poor ventilation.
We also thought about cases when there existed a good chance of ventilation where the spread of the virus would not be necessarily accumulative. In such cases, we considered both increasing and decreasing counts depending on the overall time spent by each individual in each grid cell of the image, as well as the total absence time of individuals which potentially allowed bringing down the level of contamination.
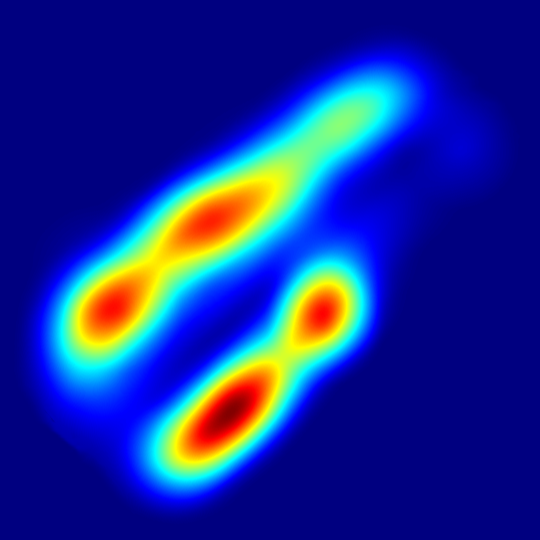
Figure 18 which we named as a crowd map shows the 2D and 3D representation of violations and risk heat maps where we applied both increasing and decreasing contamination trends. The first row of the image represents a single frame analysis with two peak zones. As can be seen, those zones belonged to two crowded zones where two large groups of people were walking together and breached the social distancing rule. However, in other parts of the street a minimal level of risk was identified. This is due to large inter people distances and the consequent time gaps which allowed breathing and therefore a decreasing rate of contamination.
The second row of Figure 18 shows a long-term crow map which does not necessarily depend on the current frame. This can be a weighted averaging over all of the previous single-frame crow maps.
One of the extra research questions in Figures 17 and 18 is how to define appropriate averaging weights and coefficients in Equation (28) and how to normalise the maps over the time. This is out of the scope of this research and needs further study. However, here we aimed at showing the feasibility of considering a diversity of cases using the proposed method with a high level of confidence and accuracy in social distancing monitoring and risk assessment with the help of AI and Computer Vision.
5 Conclusions
We proposed a Deep Neural Network-Based human detector model called DeepSOCIAL to detect and track static and dynamic people in public places in order to monitor social distancing metrics in COVID-19 era and beyond. Various types of state-of-the-art backbones, necks, and heads were evaluated and investigated. We utilised a CSPDarkNet53 backbone along with an SPP/PAN and SAM neck, YOLO head, Mish activation function. We applied the Complete IoU loss function and a Mosaic data augmentation on multi-viewpoint MS COCO and Google Open Image datasets to enrich the training phase, which ultimately led to an efficient and accurate human detector, applicable in various environments using any type of CCTV surveillance cameras.
The proposed method was evaluated for Oxford Town Centre dataset, including 7530 frames, and approximately 150,000 people detection and distance estimation. The system was able to perform in a variety of challenges including, occlusion, lighting variations, shades, and partial visibility, and proved a major development in terms of accuracy (99.8%) and speed (24.1 fps) compared to three state-of-the-art techniques. The system performed real-time using a basic GPU platform or a 10th generation multi-core/multi-thread CPU platform, or higher. We adapted an inverse perspective geometric mapping and SORT tracking algorithm for our application to estimate the inter-people distances, and to track the moving trajectories of the people, infection risk assessment and analysis to the benefit of the health authorities and governments.
DeepSOCIAL offered a viewpoint-independent human classification algorithm. Therefore, regardless of the camera angle and position, the outcome of this research is directly applicable for a wider community of researchers, not only in computer vision, AI, and health sectors but also in other industrial applications including pedestrian detection for driver assistance systems, autonomous vehicles, anomaly behaviour detections in public and crowd, surveillance security systems, action recognition in sports, shopping centres, public places; and generally, any applications that human detection falls in the centre of attention.
Supplementary Materials: we publicly share the DeepSOCIAL materials in our GitHub repository for the benefit of researchers in the field and research reproducibility. Sample videos of the project are also accessible via our YouTube channel and the following links: Link 1, Link 2, Link 3, and Link 4.
References
References
- World Health Organisation (August 2020) World Health Organisation. WHO Corona-Viruses Disease Dashboard. August 2020. Available online: https://covid19.who.int/table (accessed on 22 October 2020).
- WHO Director, Generals (2020) WHO Generals and Directors Speeches. Opening Remarks at the Media Briefing on COVID-19; WHO Generals and Directors Speeches: 2020, Geneva, Switzerland.
- Olsen et al. (2003) Olsen, S.J.; Chang, H.L.; Cheung, T.Y.Y.; Tang, A.F.Y.; Fisk, T.L.; Ooi, S.P.L.; Kuo, H.W.; Jiang, D.D.S.; Chen, K.T.; Lando, J.; et al. Transmission of the severe acute respiratory syndrome on aircraft. N. Engl. J. Med. 2003, 349, 2416–2422, doi:10.1056/NEJMoa031349.
- Adlhoch et al. (2020) Adlhoch, C.; Baka, A.; Ciotti, M.; Gomes, J.; Kinsman, J.; Leitmeyer, K.; Melidou, A.; Noori, T.; Pharris, A.; Penttinen, P. Considerations Relating to Social Distancing Measures in Response to the COVID-19 Epidemic; Technical Report; European Centre for Disease Prevention and Control: 2020, Sweden.
- Ferguson et al. (2006) Ferguson, N.M.; Cummings, D.A.; Fraser, C.; Cajka, J.C.; Cooley, P.C.; Burke, D.S. Strategies for mitigating an influenza pandemic. Nature 2006, 442, 448–452, doi:10.1038/nature04795.
- Thu et al. (2020) Thu, T.P.B.; Ngoc, P.N.H.; Hai, N.M. Effect of the social distancing measures on the spread of COVID-19 in 10 highly infected countries. Sci. Total Environ. 2020, 140430, doi:10.1016/j.scitotenv.2020.140430.
- Morato et al. (2020) Morato, M.M.; Bastos, S.B.; Cajueiro, D.O.; Normey-Rico, J.E. An Optimal Predictive Control Strategy for COVID-19 (SARS-CoV-2) Social Distancing Policies in Brazil. Elsevier Ann. Rev. Control 2020, doi:10.1016/j.arcontrol.2020.07.001.
- Fong et al. (2020) Fong, M.W.; Gao, H.; Wong, J.Y.; Xiao, J.; Shiu, E.Y.; Ryu, S.; Cowling, B.J. Nonpharmaceutical measures for pandemic influenza in nonhealthcare settings—social distancing measures. Emerg. Infect. Dis. 2020, 26, 976, doi:10.3201/eid2605.190995.
- Ahmedi et al. (2018) Ahmedi, F.; Zviedrite, N.; Uzicanin, A. Effectiveness of workplace social distancing measures in reducing influenza transmission: A systematic review. BMC Public Health 2018, 1–13, doi:10.1186/s12889-018-5446-1.
- Australian Government Department of Health (2020) Australian Government Department of Health. Deputy Chief Medical Officer Report on COVID-19; Department of Health, Social Distancing for Coronavirus: 2020, Australia , doi:10.1136/bmj.m1845.
- Nguyen et al. (2020) Nguyen, C.T.; Saputra, Y.M.; Van Huynh, N.; Nguyen, N.T.; Khoa, T.V.; Tuan, B.M.; Nguyen, D.N.; Hoang, D.T.; Vu, T.X.; Dutkiewicz, E.; et al. Enabling and Emerging Technologies for Social Distancing: A Comprehensive Survey. arXiv 2020, arxiv:2005.02816.
- Punn et al. (2020) Punn, N.S.; Sonbhadra, S.K.; Agarwal, S. COVID-19 Epidemic Analysis using Machine Learning and Deep Learning Algorithms. medRxiv 2020, doi:10.1101/2020.04.08.20057679.
- Shi et al. (2020) Shi, F.; Wang, J.; Shi, J.; Wu, Z.; Wang, Q.; Tang, Z.; He, K.; Shi, Y.; Shen, D. Review of artificial intelligence techniques in imaging data acquisition, segmentation and diagnosis for COVID-19. IEEE Rev. Biomed. Eng. 2020, doi:10.1109/RBME.2020.2987975.
- Gupta et al. (2020) Gupta, R.; Pandey, G.; Chaudhary, P.; Pal, S.K. Machine Learning Models for Government to Predict COVID-19 Outbreak. Int. J. Digit. Gov. Res. Pract. 2020, 1, doi:10.1145/3411761.
- Punn et al. (2020) Punn, N.S.; Sonbhadra, S.K.; Agarwal, S. Monitoring COVID-19 social distancing with person detection and tracking via fine-tuned YOLO v3 and Deepsort techniques. arXiv 2020, arXiv:2005.01385.
- Rezaei and Shahidi (2020) Rezaei, M.; Shahidi, M. Zero-shot Learning and its Applications from Autonomous Vehicles to COVID-19 Diagnosis: A Review. SSRN Mach. Learn. J. 2020, 3, 1–27, doi:10.2139/ssrn.3624379.
- Toğaçar et al. (2020) Toğaçar, M.; Ergen, B.; Cömert, Z. COVID-19 detection using deep learning models to exploit Social Mimic Optimization and structured chest X-ray images using fuzzy color and stacking approaches. Comput. Biol. Med. 2020, 103805, doi:10.1016/j.compbiomed.2020.103805.
- Ulhaq et al. (2020) Ulhaq, A.; Khan, A.; Gomes, D.; Paul, M. Computer Vision For COVID-19 Control: A Survey. Image Video Process. 2020, doi:10.31224/osf.io/yt9sx.
- Nguyen (2020) Nguyen, T.T. Artificial intelligence in the battle against coronavirus (COVID-19): A survey and future research directions. ArXiv Prepr. 2020, 10, doi:10.13140/RG.2.2.36491.23846/1.
- Choi and Shim (2020) Choi, W.; Shim, E. Optimal Strategies for Vaccination and Social Distancing in a Game-theoretic Epidemiological Model. J. Theor. Biol. 2020, p. 110422, doi:10.1016/j.jtbi.2020.110422.
- Eksin et al. (2019) Eksin, C.; Paarporn, K.; Weitz, J.S. Systematic biases in disease forecasting—The role of behavior change. J. Epid. 2019, pp. 96–105, doi:10.1016/j.epidem.2019.02.004.
- Kermack and McKendrick (1991) Kermack, W.O.; McKendrick, A.G. A Contributions to the Mathematical Theory of Epidemics—i; The Royal Society Publishing: 1991, UK , doi:10.1098/rspa.1927.0118.
- Heffernan et al. (2005) Heffernan, J.M.; Smith, R.J.; Wahl, L.M. Perspectives on the basic reproductive ratio. J. R. Soc. Interface 2005, 2, 281–293, doi:10.1098/rsif.2005.0042.
- Relugal (2010) Relugal, T.C. Game theory of social distancing in response to an epidemic. PLoS Comput. Biol. 2010, 1–9, doi:10.1371/journal.pcbi.1000793.
- Ainslie et al. (2020) Ainslie, K.E.; Walters, C.E.; Fu, H.; Bhatia, S.; Wang, H.; Xi, X.; Baguelin, M.; Bhatt, S.; Boonyasiri, A.; Boyd, O.; et al. Evidence of initial success for China exiting COVID-19 social distancing policy after achieving containment. Wellcome Open Res. 2020, 5, doi:10.12688/wellcomeopenres.15843.1.
- Vidal-Alaball et al. (2020) Vidal-Alaball, J.; Acosta-Roja, R.; Pastor Hernández, N.; Sanchez Luque, U.; Morrison, D.; Narejos Pérez, S.; Perez-Llano, J.; Salvador Vèrges, A.; López Seguí, F. Telemedicine in the face of the COVID-19 pandemic. Aten. Primaria 2020, 52, 418–422, doi:10.1016/j.aprim.2020.04.003.
- Sonbhadra et al. (2020) Sonbhadra, S.K.; Agarwal, S.; Nagabhushan, P. Target specific mining of COVID-19 scholarly articles using one-class approach. J. Chaos Solitons Fractals 2020, 140, doi:10.1016/j.chaos.2020.110155.
- Punn and Agarwal (2020) Punn, N.S.; Agarwal, S. Automated diagnosis of COVID-19 with limited posteroanterior chest X-ray images using fine-tuned deep neural networks. Image Video Process. 2020, doi:arXiv:2004.11676.
- Jhunjhunwala (2020) Jhunjhunwala, A. Role of Telecom Network to Manage COVID-19 in India: Aarogya Setu. Trans. Indian Natl. Acad. Eng. 2020, 1–5, doi:10.1007/s41403-020-00109-7.
- Robakowska et al. (2017) Robakowska, M.; Tyranska-Fobke, A.; Nowak, J.; Slezak, D.; Zuratynski, P.; Robakowski, P.; Nadolny, K.; Ładny, J. The use of drones during mass events. Disaster Emerg. Med. J. 2017, 2, 129–134, doi:10.5603/DEMJ.2017.0028.
- Harvey (2019) Harvey, A.; LaPlace, J. Origins, Ethics, and Privacy Implications of Publicly Available Face Recognition Image Datasets; MegaPixels: 2019, London, UK.
- Xin et al. (2018) Xin, T.; Guo, B.; Wang, Z.; Wang, P.; Lam, J.C.; Li, V.; Yu, Z. FreeSense. ACM Interact. Mobile Wearable Ubiq. Technol. 2018, 2, 1 – 23, doi:10.1145/3264953.
- Hossain et al. (2020) Hossain, F.A.; Lover, A.A.; Corey, G.A.; Reigh, N.G.; T, R. FluSense: A contactless syndromic surveillance platform for influenzalike illness in hospital waiting areas. In Proceedings of the ACM International Joint Conference on Pervasive and Ubiquitous Computing, Virtual Conference, 2020 ; pp. 1–28, doi:10.1145/3381014.
- Sindagi and Patel (2018) Sindagi, V.A.; Patel, V.M. A survey of recent advances in cnn-based single image crowd counting and density estimation. Pattern Recognit. Lett. 2018, 107, 3–16, doi:10.1016/j.patrec.2017.07.007.
- Brighente et al. (2019) Brighente, A.; Formaggio, F.; Di Nunzio, G.M.; Tomasin, S. Machine Learning for In-Region Location Verification in Wireless Networks. IEEE J. Sel. Areas Commun. 2019, 37, 2490–2502, doi:10.1109/JSAC.2019.2933970.
- Liu et al. (2020) Liu, L.; Ouyang, W.; Wang, X.; Fieguth, P.; Chen, J.; Liu, X.; Pietikäinen, M. Deep learning for generic object detection: A survey. Int. J. Comput. Vis. 2020, 128, 261–318, doi:10.1007/s11263-019-01247-4.
- Rezaei et al. (2010) Rezaei, M.; Sarshar, M.; Sanaatiyan, M.M. Toward next generation of driver assistance systems: A multimodal sensor-based platform. In Proceedings of the 2010 The 2nd International Conference on Computer and Automation Engineering (ICCAE), 2010, Singapore ; Volume 4, pp. 62–67.
- Sabzevari et al. (2008) Sabzevari, R.; Shahri, A.; Fasih, A.; Masoumzadeh, S.; Ghahroudi, M.R. Object detection and localization system based on neural networks for Robo-Pong. In Proceedings of the 2008 5th International Symposium on Mechatronics and Its Applications, 2008, Amman, Jordan ; pp. 1–6.
- Nguyen et al. (2016) Nguyen, D.T.; Li, W.; Ogunbona, P.O. Human detection from images and videos: A survey. Int. J. Pattern Recognit. 2016, 51, 148–175, doi:10.1016/j.patcog.2015.08.027.
- Serpush and Rezaei (2020) Serpush, F.; Rezaei, M. Complex Human Action Recognition in Live Videos Using Hybrid FR-DL Method. arXiv 2020, arXiv:2007.02811.
- Gawande et al. (2020) Gawande, U.; Hajari, K.; Golhar, Y. Pedestrian Detection and Tracking in Video Surveillance System: Issues, Comprehensive Review, and Challenges. In Recent Trends in Computational Intelligence; Intech Open Publisher: 2020, London, UK , doi:10.5772/intechopen.90810.
- Wojke et al. (2017) Wojke, N.; Bewley, A.; Paulus, D. Simple online and realtime tracking with a deep association metric. In Proceedings of the IEEE International Conference on Image Processing (ICIP), 2017, Beijing, China ; pp. 3645–3649, doi:10.1109/ICIP.2017.8296962.
- Khandelwal et al. (2020) Khandelwal, P.; Khandelwal, A.; Agarwal, S.; Thomas, D.; Xavier, N.; Raghuraman, A. Using Computer Vision to enhance Safety of Workforce in Manufacturing in a Post COVID World. Comput. Vision Pattern Recog. 2020, doi:10.1016/S0140-6736(20)30185-9.
- Sandler et al. (2018) Sandler, M.; Howard, A.; Zhu, M.; Zhmoginov, A.; Chen, L. MobileNetV2: Inverted Residuals and Linear Bottlenecks. In Proceedings of the IEEE Conference on Computer Vision and Pattern Recognition (CVPR), 2018, Utah, United States ; pp. 4510–4520, doi:10.1109/CVPR.2018.00474.
- Yang et al. (2020) Yang, D.; Yurtsever, E.; Renganathan, V.; Redmill, K.; Özgüner, U. A Vision-based Social Distancing and Critical Density Detection System for COVID-19. Image Video Process. 2020, arXiv:2007.03578.
- Girshick et al. (2014) Girshick, R.; Donahue, J.; Darrell, T.; Malik, J. Rich Feature Hierarchies for Accurate Object Detection and Semantic Segmentation. In Proceedings of the IEEE Conference on Computer Vision and Pattern Recognition (CVPR), Utah, United States ; pp. 580–587, doi:10.1109/CVPR.2014.81.
- Girshick (2015) Girshick, R. Fast R-CNN. In Proceedings of the IEEE international conference on computer vision, 2015, Las Condes, Chile ; pp. 1440–1448, doi:10.1109/ICCV.2015.169.
- Ren et al. (2017) Ren, S.; He, K.; Girshick, R.; Sun, J. Faster R-CNN: Towards Real-Time Object Detection with Region Proposal Networks. IEEE Trans. Pattern Anal. Mach. Intell. 2017, 39, 1137–1149, doi:10.1109/TPAMI.2016.2577031.
- Liu et al. (2016) Liu, W.; Anguelov, D.; Erhan, D.; Szegedy, C.; Reed, S.; Fu, C.; Berg, A. SSD: Single Shot MultiBox Detector. Eur. Conf. Comput. Vision 2016, 21–37, doi:10.1007/978-3-319-46448-02.
- Redmon et al. (2016) Redmon, J.; Divvala, S.; Girshick, R.; Farhadi, A. You Only Look Once: Unified, Real-Time Object Detection. In Proceedings of the IEEE Conference on Computer Vision and Pattern Recognition (CVPR), Nevada, United States ; pp. 779–788, doi:10.1109/CVPR.2016.91.
- Redmon and Farhadi (2017) Redmon, J.; Farhadi, A. YOLO9000: Better, Faster, Stronger. In Proceedings of the IEEE Conference on Computer Vision and Pattern Recognition (CVPR), Hawaii, United States ; pp. 6517–6525, doi:10.1109/CVPR.2017.690.
- Redmon and Farhadi (2018) Redmon, J.; Farhadi, A. YOLOv3: An Incremental Improvement. arXiv 2018, arXiv:1804.02767.
- Bochkovskiy et al. (2020) Bochkovskiy, A.; Wang, C.Y.; Liao, H.Y.M. YOLOv4: Optimal Speed and Accuracy of Object Detection. arXiv 2020, arXiv:2004.10934.
- Chen et al. (2015) Chen, X.; Fang, H.; Lin, T.; Vedantam, R.; Dollar, P.; Zitnick, C. Microsoft COCO Captions: Data Collection and Evaluation Server. arXiv 2015, arXiv:1504.00325.
- Everingham et al. (2010) Everingham, M.; Van Gool, L.; Williams, C.; Winn, J.; Zisserman, A. The PASCAL Visual Object Classes Challenge 2010 (VOC2010) Results. Int. J. Comput. Vis. 2010, 88, 303–338, doi:10.1007/s11263-009-0275-4.
- DeVries and Taylor (2017) DeVries, T.; Taylor, G.W. Improved regularization of convolutional neural networks with cutout. arXiv 2017, arXiv:1708.04552.
- Nair and Hinton (2010) Nair, V.; Hinton, G.E. Rectified Linear Units Improve Restricted Boltzmann Machines; ICML: 2010, Haifa, Israel.
- Simonyan and Zisserman (2014) Simonyan, K.; Zisserman, A. Very deep convolutional networks for large-scale image recognition. arXiv 2014, arXiv:1409.1556.
- He et al. (2014) He, K.; Zhang, X.; Ren, S.; Sun, J. Spatial Pyramid Pooling in Deep Convolutional Networks for Visual Recognition. In European Conference on Computer Vision (ECCV); 2014; Zurich, Switzerland, pp. 346–361, doi:10.1007/978-3-319-10578-923.
- Ng (2004) Ng, A.Y. Feature selection, L 1 vs. L 2 regularization, and rotational invariance. In Proceedings of the Twenty-First International Conference on Machine Learning, 2004, New York, United States ; p. 78.
- Zhang et al. (2017) Zhang, H.; Cisse, M.; Dauphin, Y.N.; Lopez-Paz, D. mixup: Beyond empirical risk minimization. arXiv 2017, arXiv:1710.09412.
- Maas et al. (2013) Maas, A.L.; Hannun, A.Y.; Ng, A.Y. Rectifier nonlinearities improve neural network acoustic models. Proc. ICML 2013, 30, 3.
- He et al. (2016) He, K.; Zhang, X.; Ren, S.; Sun, J. Deep residual learning for image recognition. In Proceedings of the IEEE Conference on Computer Vision and Pattern Recognition (CVPR), 2016, Nevada, United States ; pp. 770–778.
- Chen et al. (2017) Chen, L.C.; Papandreou, G.; Kokkinos, I.; Murphy, K.; Yuille, A.L. Deeplab: Semantic image segmentation with deep convolutional nets, atrous convolution, and fully connected crfs. IEEE Trans. Pattern Anal. Mach. Intell. 2017, 40, 834–848.
- Srivastava et al. (2014) Srivastava, N.; Hinton, G.; Krizhevsky, A.; Sutskever, I.; Salakhutdinov, R. Dropout: A simple way to prevent neural networks from overfitting. J. Mach. Learn. Res. 2014, 15, 1929–1958.
- Yun et al. (2019) Yun, S.; Han, D.; Oh, S.J.; Chun, S.; Choe, J.; Yoo, Y. Cutmix: Regularization strategy to train strong classifiers with localizable features. In Proceedings of the IEEE International Conference on Computer Vision, 2019, South Korea ; pp. 6023–6032.
- He et al. (2015) He, K.; Zhang, X.; Ren, S.; Sun, J. Delving deep into rectifiers: Surpassing human-level performance on imagenet classification. In Proceedings of the IEEE International Conference on Computer Vision, 2015, Las Condes, Chile ; pp. 1026–1034.
- Du et al. (2020) Du, X.; Lin, T.Y.; Jin, P.; Ghiasi, G.; Tan, M.; Cui, Y.; Le, Q.V.; Song, X. SpineNet: Learning scale-permuted backbone for recognition and localization. In Proceedings of the IEEE/CVF Conference on Computer Vision and Pattern Recognition, 2020, Virtual Event ; pp. 11592–11601.
- Liu et al. (2018) Liu, S.; Qi, L.; Qin, H.; Shi, J.; Jia, J. Path Aggregation Network for Instance Segmentation. In Proceedings of the IEEE Conference on Computer Vision and Pattern Recognition (CVPR), 2018, Utah, United States ; pp. 8759–8768, doi:10.1109/CVPR.2018.00913.
- Larsson et al. (2016) Larsson, G.; Maire, M.; Shakhnarovich, G. Fractalnet: Ultra-deep neural networks without residuals. arXiv 2016, arXiv:1605.07648.
- Lin et al. (2017) Lin, T.Y.; Goyal, P.; Girshick, R.; He, K.; Dollár, P. Focal loss for dense object detection. In Proceedings of the IEEE international conference on computer vision, 2017, Venice, Italy ; pp. 2980–2988.
- Howard et al. (2017) Howard, A.G.; Zhu, M.; Chen, B.; Kalenichenko, D.; Wang, W.; Weyand, T.; Andreetto, M.; Adam, H. Mobilenets: Efficient convolutional neural networks for mobile vision applications. arXiv 2017, arXiv:1704.04861.
- Wang et al. (2020) Wang, C.Y.; Mark Liao, H.Y.; Wu, Y.H.; Chen, P.Y.; Hsieh, J.W.; Yeh, I.H. CSPNet: A new backbone that can enhance learning capability of CNN. In Proceedings of the IEEE CVF Conference on Computer Vision and Pattern Recognition Workshops (CVPRW), 2020, Virtual Event ; pp. 390–391, doi:10.1109/CVPRW50498.2020.00203.
- Lin et al. (2017) Lin, T.Y.; Dollár, P.; Girshick, R.; He, K.; Hariharan, B.; Belongie, S. Feature pyramid networks for object detection. In Proceedings of the IEEE Conference on Computer Vision and Pattern Recognition, 2017, Hawaii, United States ; pp. 2117–2125, doi:10.1109/CVPR.2019.00656.
- Tompson et al. (2015) Tompson, J.; Goroshin, R.; Jain, A.; LeCun, Y.; Bregler, C. Efficient object localization using convolutional networks. In Proceedings of the IEEE Conference on Computer Vision and Pattern Recognition, 2015, Boston, USA ; pp. 648–656.
- Pang et al. (2019) Pang, J.; Chen, K.; Shi, J.; Feng, H.; Ouyang, W.; Lin, D. Libra r-cnn: Towards balanced learning for object detection. In Proceedings of the IEEE Conference on Computer Vision and Pattern Recognition, 2019, California, United States ; pp. 821–830.
- Klambauer et al. (2017) Klambauer, G.; Unterthiner, T.; Mayr, A.; Hochreiter, S. Self-normalizing neural networks. Adv. Neural Inf. Process. Syst. 2017, 971–980. doi:10.5555/3294771.3294864.
- Tan et al. (2020) Tan, M.; Pang, R.; Le, Q.V. Efficientdet: Scalable and efficient object detection. In Proceedings of the IEEE/CVF Conference on Computer Vision and Pattern Recognition, 2020, Virtual Event ; pp. 10781–10790.
- Law and Deng (2018) Law, H.; Deng, J. Cornernet: Detecting objects as paired keypoints. In Proceedings of the European Conference on Computer Vision (ECCV), 2018, Munich, Germany ; pp. 734–750.
- He et al. (2017) He, K.; Gkioxari, G.; Dollár, P.; Girshick, R. Mask r-cnn. In Proceedings of the IEEE International Conference on Computer Vision, 2018, Istanbul, Turkey ; pp. 2961–2969.
- Ramachandran et al. (2017) Ramachandran, P.; Zoph, B.; Le, Q.V. Searching for activation functions. arXiv 2017, arXiv:1710.05941.
- Tan and Le (2019) Tan, M.; Le, Q. EfficientNet: Rethinking Model Scaling for Convolutional Neural Networks. In Proceedings of the Thirty-sixth International Conference on Machine Learning (ICML), 2019, Long Beach, USA ; pp. 1–10, doi:10.1101/2020.08.13.20173997.
- Liu et al. (2019) Liu, S.; Huang, D.; Wang, Y. Learning spatial fusion for single-shot object detection. arXiv 2019, arXiv:1911.09516.
- Rashwan et al. (2019) Rashwan, A.; Kalra, A.; Poupart, P. Matrix Nets: A new deep architecture for object detection. In Proceedings of the IEEE International Conference on Computer Vision Workshops, 2019, Seoul, Korea.
- Duan et al. (2019) Duan, K.; Bai, S.; Xie, L.; Qi, H.; Huang, Q.; Tian, Q. Centernet: Keypoint triplets for object detection. In Proceedings of the IEEE International Conference on Computer Vision, Seoul, Korea ; pp. 6569–6578.
- Misra (2019) Misra, D. Mish: A self regularized non-monotonic neural activation function. Neural Evol. Comput. 2019, arXiv:1908.08681.
- Liu et al. (2018) Liu, S.; Huang, D.; others. Receptive field block net for accurate and fast object detection. In Proceedings of the European Conference on Computer Vision (ECCV), 2018, Munich, Germany ; pp. 385–400.
- Dai et al. (2016) Dai, J.; Li, Y.; He, K.; Sun, J. R-fcn: Object detection via region-based fully convolutional networks. Adv. Neural Inf. Process. Syst. 2016, 379–387, doi: 10.5555/3157096.3157139.
- Yang et al. (2019) Yang, Z.; Liu, S.; Hu, H.; Wang, L.; Lin, S. Reppoints: Point set representation for object detection. In Proceedings of the IEEE International Conference on Computer Vision, 2019, Seoul, Korea ; pp. 9657–9666.
- Szegedy et al. (2016a) Szegedy, C.; Vanhoucke, V.; Ioffe, S.; Shlens, J.; Wojna, Z. Rethinking the inception architecture for computer vision. In Proceedings of the IEEE Conference on Computer Vision and Pattern Recognition, 2016, Nevada, United States ; pp. 2818–2826.
- Szegedy et al. (2016b) Szegedy, C.; Ioffe, S.; Vanhoucke, V.; Alemi, A. Inception-v4, inception-resnet and the impact of residual connections on learning. arXiv 2016, arXiv:1602.07261.
- Zhao et al. (2019) Zhao, Q.; Sheng, T.; Wang, Y.; Tang, Z.; Chen, Y.; Cai, L.; Ling, H. M2det: A single-shot object detector based on multi-level feature pyramid network. In Proceedings of the AAAI Conference on Artificial Intelligence, 2019, Hawaii, USA ; Volume 33, pp. 9259–9266.
- Tian et al. (2019) Tian, Z.; Shen, C.; Chen, H.; He, T. Fcos: Fully convolutional one-stage object detection. In Proceedings of the IEEE International Conference on Computer Vision, 2019, Seoul, Korea ; pp. 9627–9636.
- Ghiasi et al. (2019) Ghiasi, G.; Lin, T.Y.; Le, Q.V. Nas-fpn: Learning scalable feature pyramid architecture for object detection. In Proceedings of the IEEE Conference on Computer Vision and Pattern Recognition, 2019, Seoul, Korea ; pp. 7036–7045.
- Yao et al. (2020) Yao, Z.; Cao, Y.; Zheng, S.; Huang, G.; Lin, S. Cross-Iteration Batch Normalization. Mach. Learn. 2020, arXiv:2002.05712.
- Huang et al. (2017) Huang, G.; Liu, Z.; Van Der Maaten, L.; Weinberger, K.Q. Densely Connected Convolutional Networks. In Proceedings of the IEEE Conference on Computer Vision and Pattern Recognition (CVPR), 2017, Hawaii, USA ; pp. 2261–2269, doi:10.1109/CVPR.2017.243.
- Huang et al. (2020) Huang, Z.; Wang, J.; Fu, X.; Yu, T.; Guo, Y.; Wang, R. DC-SPP-YOLO: Dense connection and spatial pyramid pooling based YOLO for object detection. Inf. Sci. 2020, doi:10.1016/j.ins.2020.02.067.
- Woo et al. (2018) Woo, S.; Park, J.; Lee, J.Y.; Kweon, I.S. CBAM: Convolutional Block Attention Module. Eur. Conf. Comput. Vision 2018, 4–19, doi:10.1007/978-3-030-01234-21.
- Sharifi et al. (2020) Sharifi, A.; Zibaei, A.; Rezaei, M. DeepHAZMAT: Hazardous Materials Sign Detection and Segmentation with Restricted Computational Resources. Eng. Res. 2020, doi:10.2139/ssrn.3649600.
- Zheng et al. (2019) Zheng, Z.; Wang, P.; Liu, W.; Li, J.; Ye, R.; Ren, D. Distance-IoU Loss: Faster and Better Learning for Bounding Box Regression. In Proceedings of the AAAI Conference on Artificial Intelligence, 2019, Hawaii, USA ; pp. 1–8, doi:10.1609/aaai.v34i07.6999.
- Ghiasi et al. (2018) Ghiasi, G.; Lin, T.Y.; Le, Q.V. DropBlock: A regularization method for convolutional networks. Adv. Neural Inf. Process. Syst. 2018, 1–11, arXiv:1810.12890.
- Müller et al. (2019) Müller, R.; Kornblith, S.; Hinton, G.E. When does label smoothing help? Adv. Neural Inf. Process. Syst. 2019, 4694–4703, arXiv:1906.02629.
- Bewley et al. (2016) Bewley, A.; Ge, Z.; Ott, L.; Ramos, F.; Upcroft, B. Simple online and realtime tracking. In Proceedings of the 2016 IEEE International Conference on Image Processing (ICIP), 2016, Arizona, USA ; pp. 3464–3468, doi:10.1109/ICIP.2016.7533003.
- Rezaei and Klette (2017) Rezaei, M.; Klette, R. Computer Vision for Driver Assistance; Springer International Publishing: Cham, Switzerland, 2017, doi:10.1007/978-3-319-50551-0.
- Saleem et al. (2018) Saleem, N.H.; Chien, H.J.; Rezaei, M.; Klette, R. Effects of Ground Manifold Modeling on the Accuracy of Stixel Calculations. IEEE Trans. Intell. Transp. Syst. 2018, 20, 3675–3687.
- Russakovsky et al. (2015) Russakovsky, O.; Deng, J.; Su, H.; Krause, J.; Satheesh, S.; Ma, S.; Huang, Z.; Karpathy, A.; Khosla, A.; Bernstein, M.; Berg, A.C.; Fei-Fei, L. ImageNet Large Scale Visual Recognition Challenge. Int. J. Comput. Vis. 2015, 115, 211–252, doi:10.1007/s11263-015-0816-y.
- Kuznetsova et al. (2020) Kuznetsova, A.; Rom, H.; Alldrin, N.; Uijlings, J.; Krasin, I.; Pont-Tuset, J.; Kamali, S.; Popov, S.; Malloci, M.; Kolesnikov, A.; others. The open images dataset v4. Int. J. Comput. Vision 2020, 1–26, doi:10.1007/s11263-020-01316-z.
- Loshchilov and Hutter (2016) Loshchilov, I.; Hutter, F. SGDR: Stochastic Gradient Descent with Warm Restarts. In Proceedings of the International Conference on Learning Representations, 2016, San Juan, Puerto Rico ; pp. 1–16, arXiv:1608.03983.
- Chen et al. (2012) Chen, K.; Loy, C.C.; Gong, S.; Xiang, T. Feature mining for localised crowd counting. BMVC 2012, 1, 1–11, doi:10.1.1.309.5076.
- Zhou et al. (2012) Zhou, B.; Wang, X.; Tang, X. Understanding collective crowd behaviors: Learning a mixture model of dynamic pedestrian-agents. In Proceedings of the 2012 IEEE Conference on Computer Vision and Pattern Recognition, 2012, Rhode Island, USA ; pp. 2871–2878, doi:10.1109/CVPR.2012.6248013.