Band-gap tuning in 2D spatiotemporal phononic crystals
Abstract
We investigate the effect of small spatiotemporal modulations in subwavelength-dimensioned phononic crystals with large band gaps, on the frequency spectrum for elastic waves polarized in the plane of periodicity. When the radius of cylinders periodically placed inside a matrix of highly-contrasting elastic properties is time-varying, we find that due to the appearance of frequency harmonics throughout the spectrum, the notion of a band gap is destroyed in general, although with the appropriate tuning of parameters, in particular the modulation frequency, it is possible that some band-gap region is retained, making such systems possible candidates for tunable bandpass filters or phononic isolators, accordingly, and for sensor applications.
I Introduction
Phononic lattices are necessarily engineered structures made up of composite materials (metamaterials). The tunability of their design can permit novel behaviour not found in conventional materials, such as wide, complete band gaps and nonreciprocal propagation [1, 2]. In the present study, we investigate the effect of spatiotemporal modulation of material properties on the band-gap properties for a phononic-lattice prototype: cylinders embedded in a matrix of significantly different elastic properties in the subwavelength regime. This type of structure is well-known for yielding the large spectral gaps [3, 4, 5, 1, 6, 7, 8] desirable in phononic lattices, enabling the transmission of one type of polarization or none at all. Recent work on two-dimensional colloidal phononic crystals has shown that while altering the periodicity of the system results in Bragg gap tuning, the appearance as well as the characteristics of band gaps above and below the Bragg gap is controllable by altering the mechanical eigenmodes of the nanoparticles and nanoparticle-membrane adhesion respectively [9].
Reciprocal propagation of sound or elastic waves in media [10], is a general principle which assures the interchangeability of source and observer: that waves originating from one of these points propagate in exactly the same manner as waves originating from the other point. It is only broken in special situations such as when nonlinearity is present, when time-reversal symmetry is broken such as by the inclusion of materials with gain or loss, chirality, angular-momentum bias, or in moving systems [11]. It may also be broken when the system itself is not moving in time but the material parameters are varying in space and time, manifesting itself as asymmetric band gaps leading to directional propagation [12, 13, 14, 15].
The rectification of the mechanical properties of phononic materials has been demonstrated in several experimental or numerical studies, based on phenomena such as electromagnetism [16], piezoelectricity [17, 18, 19, 20], or magnetorheological polymers subjected to magnetic fields [21]. For nonreciprocal propagation to be observed, apart from time-varying material properties, there must also be spatial variation present.
Some purely mechanical implementations of spatiotemporally-varying material properties include a time-varying effective acoustic capacitance achieved in simulations involving air-filled waveguides by varying the heights of the attached resonators [22, 23], a metabeam comprised of multiple resonators with different reltaive orientations where the resulting stiffness changes in response to rotation [24]. Frequency conversion without nonlinearity present can occur in media with spatiotemporally-modulated material properties. Depending on the direction of the incident wave in a beam with reflective ends or a beam containing an interface between a homogeneous material and one with time-space varying properties, the frequency can be either up or down-converted, a clear indicator of nonreciprocal propagation [25]. The production of harmonics in time-space modulated media [25, 26, 27, 15] may be exploited for uses such as unidirectional acoustic isolation [25], or parametric amplification as a possible implementation of a gain medium [26]. In an air-filled waveguide system with a vibrating membrane, time-varying the membrane tension leads to phenomena such as frequency conversion; adding spatial variation via the addition of a second membrane with a phase difference, is what leads to non-reciprocal propagation [28]. Alternatively, it has been shown that spatial variation leads to the formation of band gaps while the addition of time-variation is what causes the band structure to display a directionality [29, 30] via a “tilting” of - space, a phenomenon long-known for the case of electromagnetic waves propagating on a two-dimensional surface with spatiotemporally-modulated properties [31, 32].
Given that phononic materials are a very technologically-promising area of research, our aim in this study is to examine whether time variation of the phononic crystals’ already spatially-varying material properties improves or degrades the performance of these systems for various objectives such as acoustic isolators or frequency sensors.
II Methods
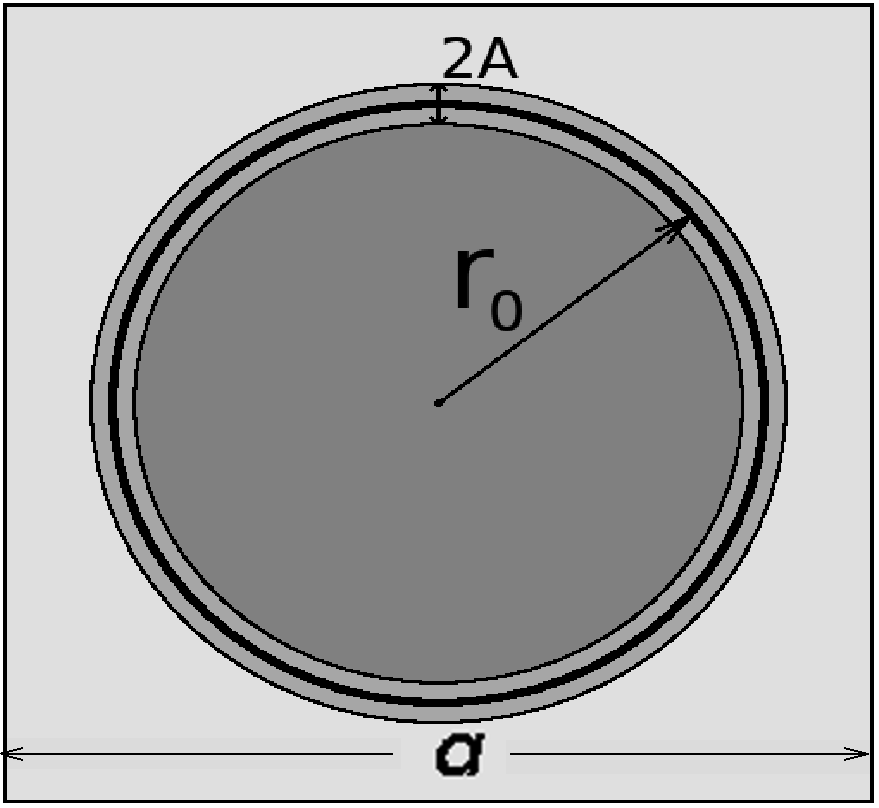
We consider a composite composed of two homogeneous structures: a solid cylinder inside a background matrix of a different material, together comprising a square unit cell as shown in Fig. 1. Time-dependent material properties in this model are imposed implicitly, via a variation of the radius of the cylinder, resulting, due to the nature of the model chosen, in a modification of its density as well as the density of the background matrix, as explained further below. The radius of the cylinder corresponds to a filling factor on the order of 50%. Such large filling factors in periodic structures ideally lead to large band gaps [7]. The function is a slowly-varying sinusoid with small modulation amplitude (up to 2% of ), and modulation frequency . This constitutes a simplified model of a more realistic implementation of a system time-varying material properties, such as, for example, a split-ring structure where the two semicircular components have a different radius, where one is mechanically modulated in time inside the other.
II.1 Formalism
The elastic wave equation in the resulting inhomogeneous elastic medium is derived from the following relations [33]:
a) Mass conservation, In our model, the cylinder expands and contracts according to a sinusoidal function, but no mass is actually being added or removed from the system. Thus, the mass conservation relation
| (1) |
where is the velocity in terms of the displacement vector , and is the density, holds for all points in space.
b) Euler’s Equation,
| (2) |
where the are the components in space, specifically of the various quantities, are the spatial coordinates, are the components of the velocity, i.e. , for displacements are the components of the stress tensor (defined below).
after ignoring a term second-order in since we aim to work in the regime of small displacements.
c) Hooke’s law,
| (4) |
where is the Kronecker delta function and
are the components of the strain tensor in terms of the displacement vector and the spatial coordinates and and are the Lamé coefficients in terms of the longitudinal and shear sound velocities and respectively, and where as well as the variables have implicit spatial and time dependence governed by the material parameters as determined by .
II.2 Finite-Element Time-Domain (FDTD) Calculations
After an initial disturbance was set in motion at a point inside the cylinder, the system was allowed to evolve. The magnitude of the disturbance is what determines the amplitude of the response and the resulting displacements may be considered to remain within the linear-elastic regime as the problem is completely scalable in this sense. Using the finite-difference time-domain (FDTD) method, where the spatial as well as the time domain is discretized, and applying periodic boundary conditions and Bloch’s theorem [5], we solve Eqs. 3-4 for the propagation of elastic waves in inhomogeneous media. In particular, the calculational approach is implemented by discretizing space on a square grid, where the displacements are defined in the centre of each grid cell and their derivatives are approximated by central-difference formulas in both space and time, resulting in second-order accuracy, while the derivatives for the material parameters are approximated by finite differences between grid and time points. The displacements at the following time step are obtained in terms of their values, as well as those of other parameters, at previous steps, and Fourier-transformed in order to obtain a spectrum of resonant peaks corresponding to the bands in space [5].
We utilized a square grid of 90 by 90 points for the calculations of the band structure for the static model and 180 by 180 points or even denser, up to 360 by 360, for more-detailed calculations of the frequency responses of the cases with and without time dependence because the denser grid let to less abrupt changes in the material parameters as a function of time, or led to the accessing of smaller amplitudes in
All of the lengths are expressed in terms of the lattice parameter Frequency is expressed as a dimensionless quantity where is taken as the speed of sound in the background material and the units of are kHz. The time step in the simulations was taken as 7.698
| Material | (g/cm3) | (km/s) | (km/s) |
|---|---|---|---|
| Iron | 7.69 | 5.9 | 3.2 |
| Epoxy | 1.18 | 2.54 | 1.16 |
| Silicon | 2.34 | 8.43 | 5.84 |
In Table 1 we list the densities and sound velocities of the materials we used for the composites in our study.
III Results
In this section we apply the formalism and methods outlined in the previous section to two different composite phononic material systems: iron (Fe) cylinders in epoxy, and silicon (Si) cylinders in epoxy.
III.1 Non-time-varying case
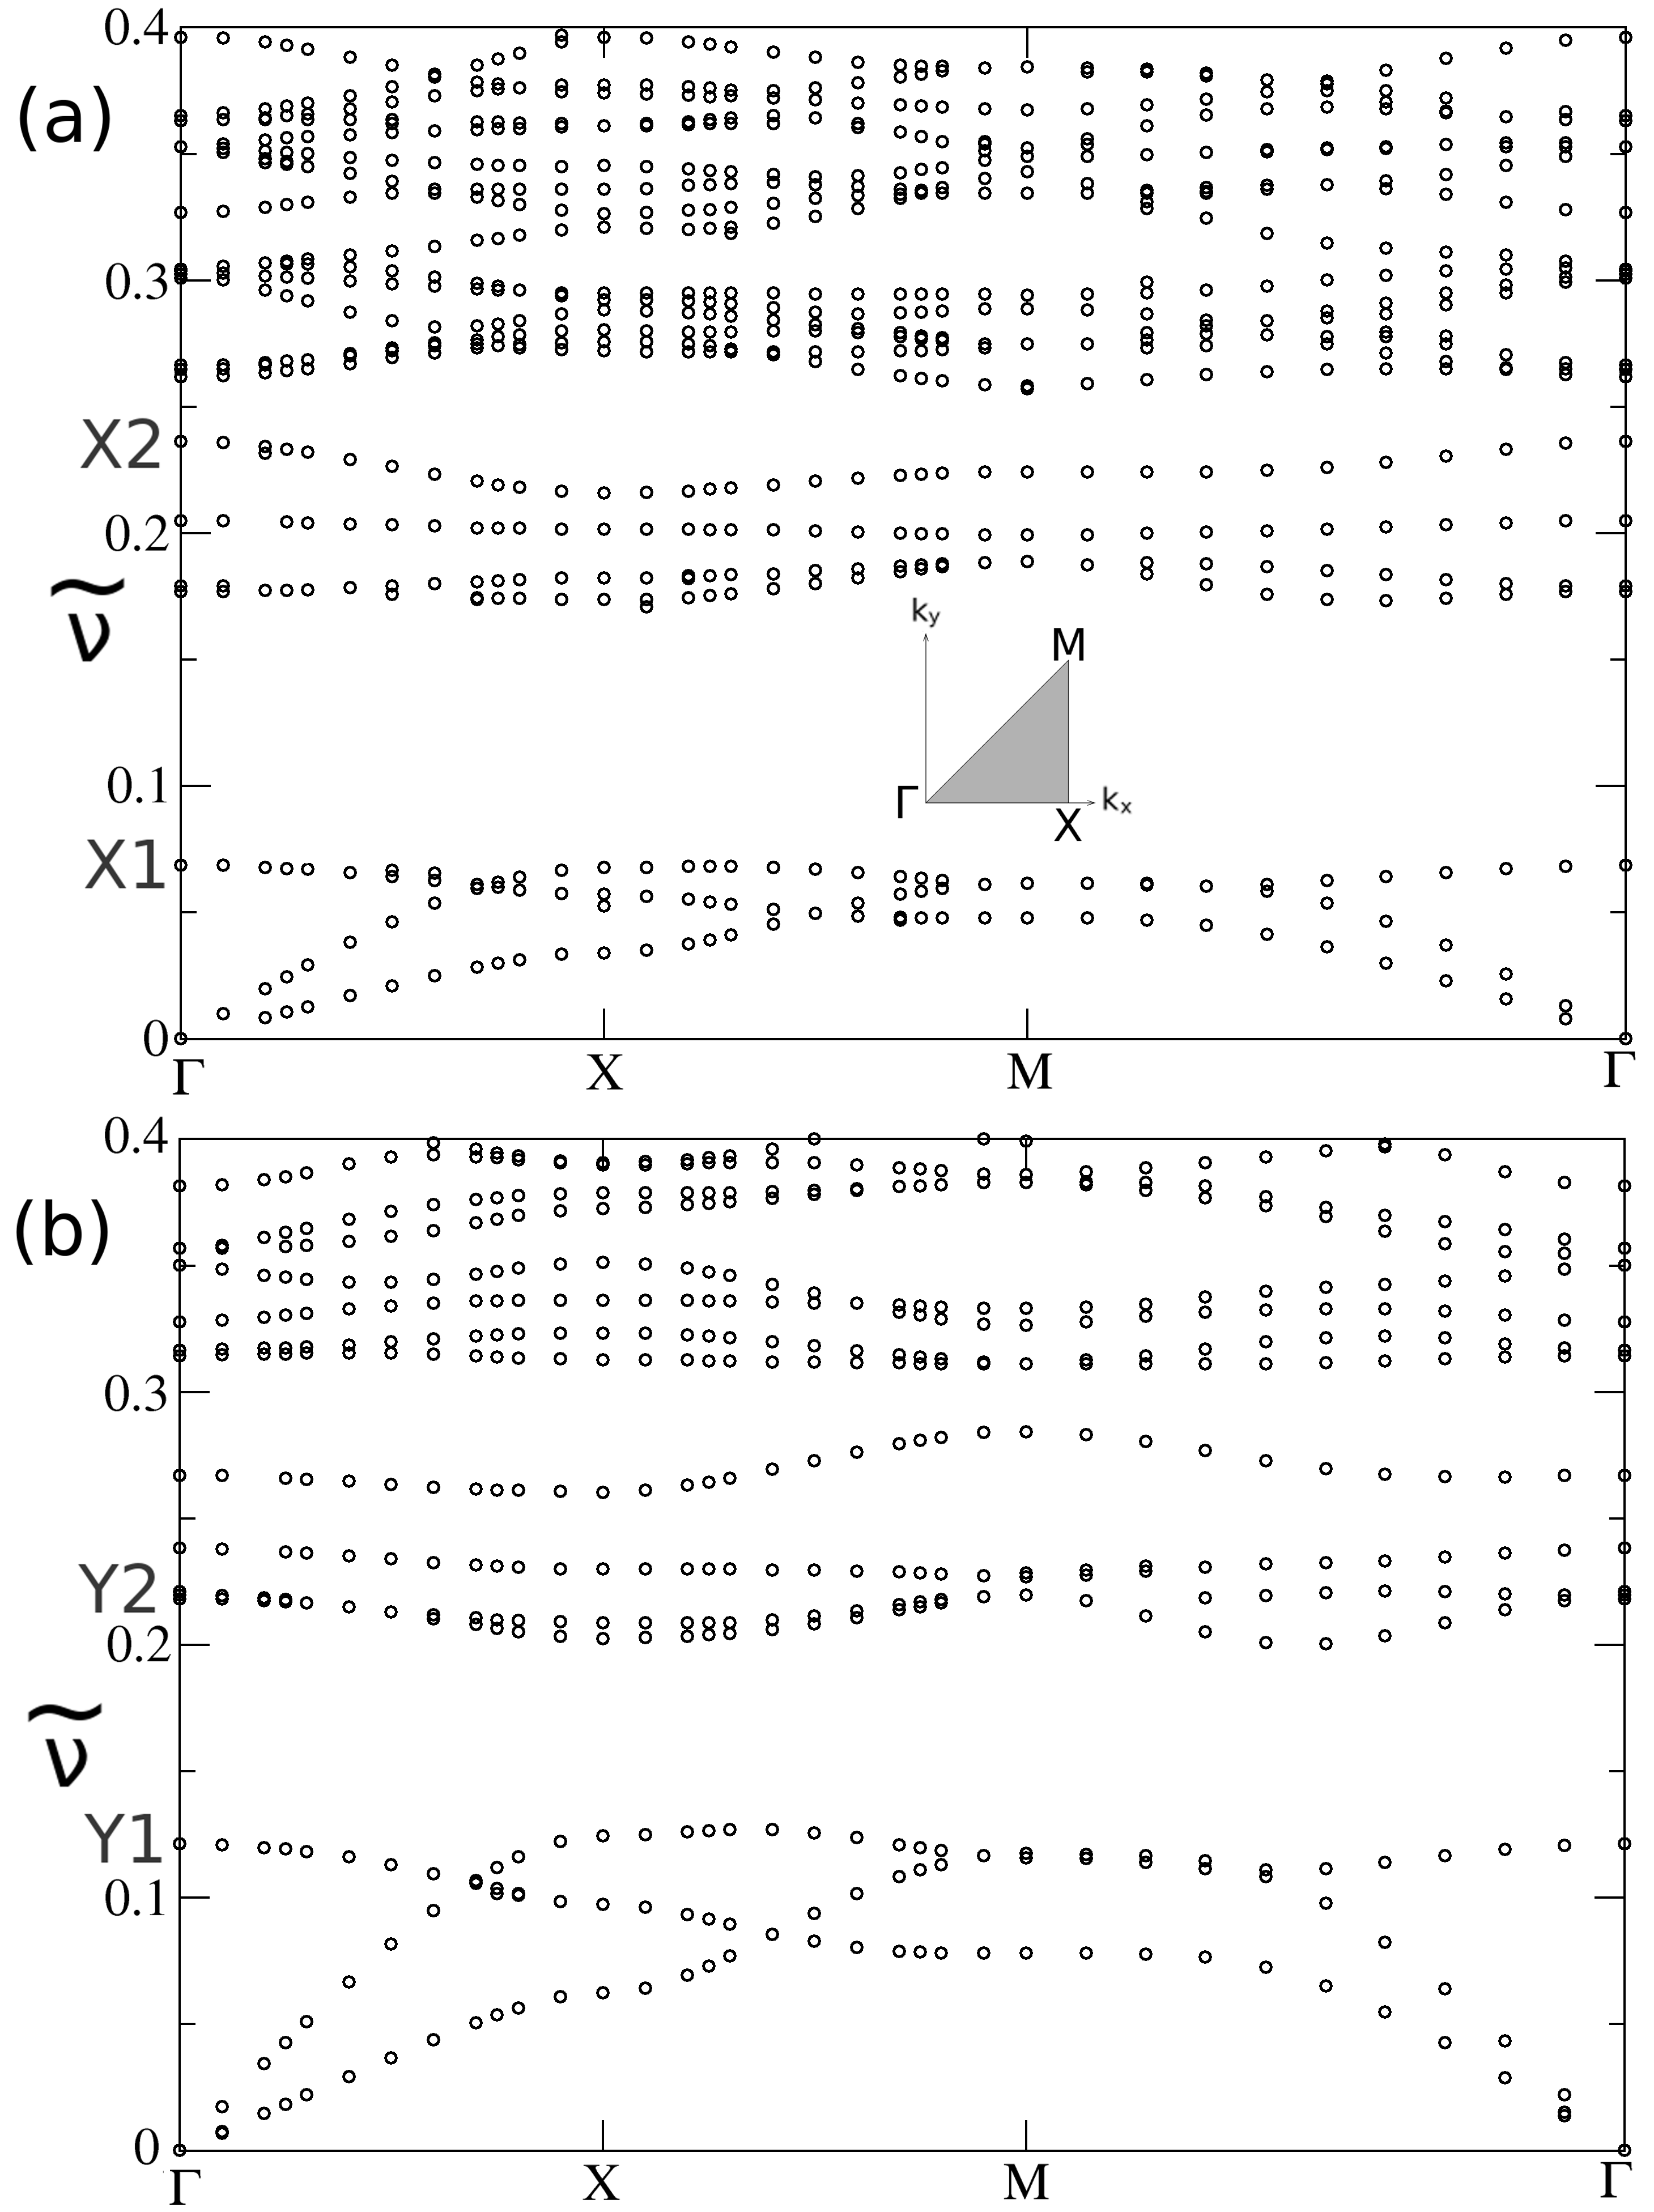
The calculated band structure for waves polarized in the plane of the unit cell, of mixed transverse-longitudinal character, for Fe cylinders in epoxy without time-variation of material properties is shown in Fig. 2a, for a filling factor of 50%. The plot is shown for a dimensionless frequency . The large band gaps are what make these types of materials ideal phononic materials. The ratio of the gap-width defined as to the mid-gap frequency defined as for the largest gap, is 0.86 while for a filling factor of 60% for the same materials, the ratio is 0.91.
Similarly, for Si cylinders in epoxy without time variation we also find a band structure with large gaps, as shown in Fig. 2b, for a filling factor of 60%. The gap-width to midgap frequency ratio for the largest gap is 0.45, much smaller than for Fe in epoxy even at the same filling factor, a result explained by the smaller contrast in the densities between the cylinder and matrix for this case, a factor of greater significance in determining this ratio than the disparity between the elastic constants [34], which in our case, is about the same for both composites.
III.2 Time-varying material properties
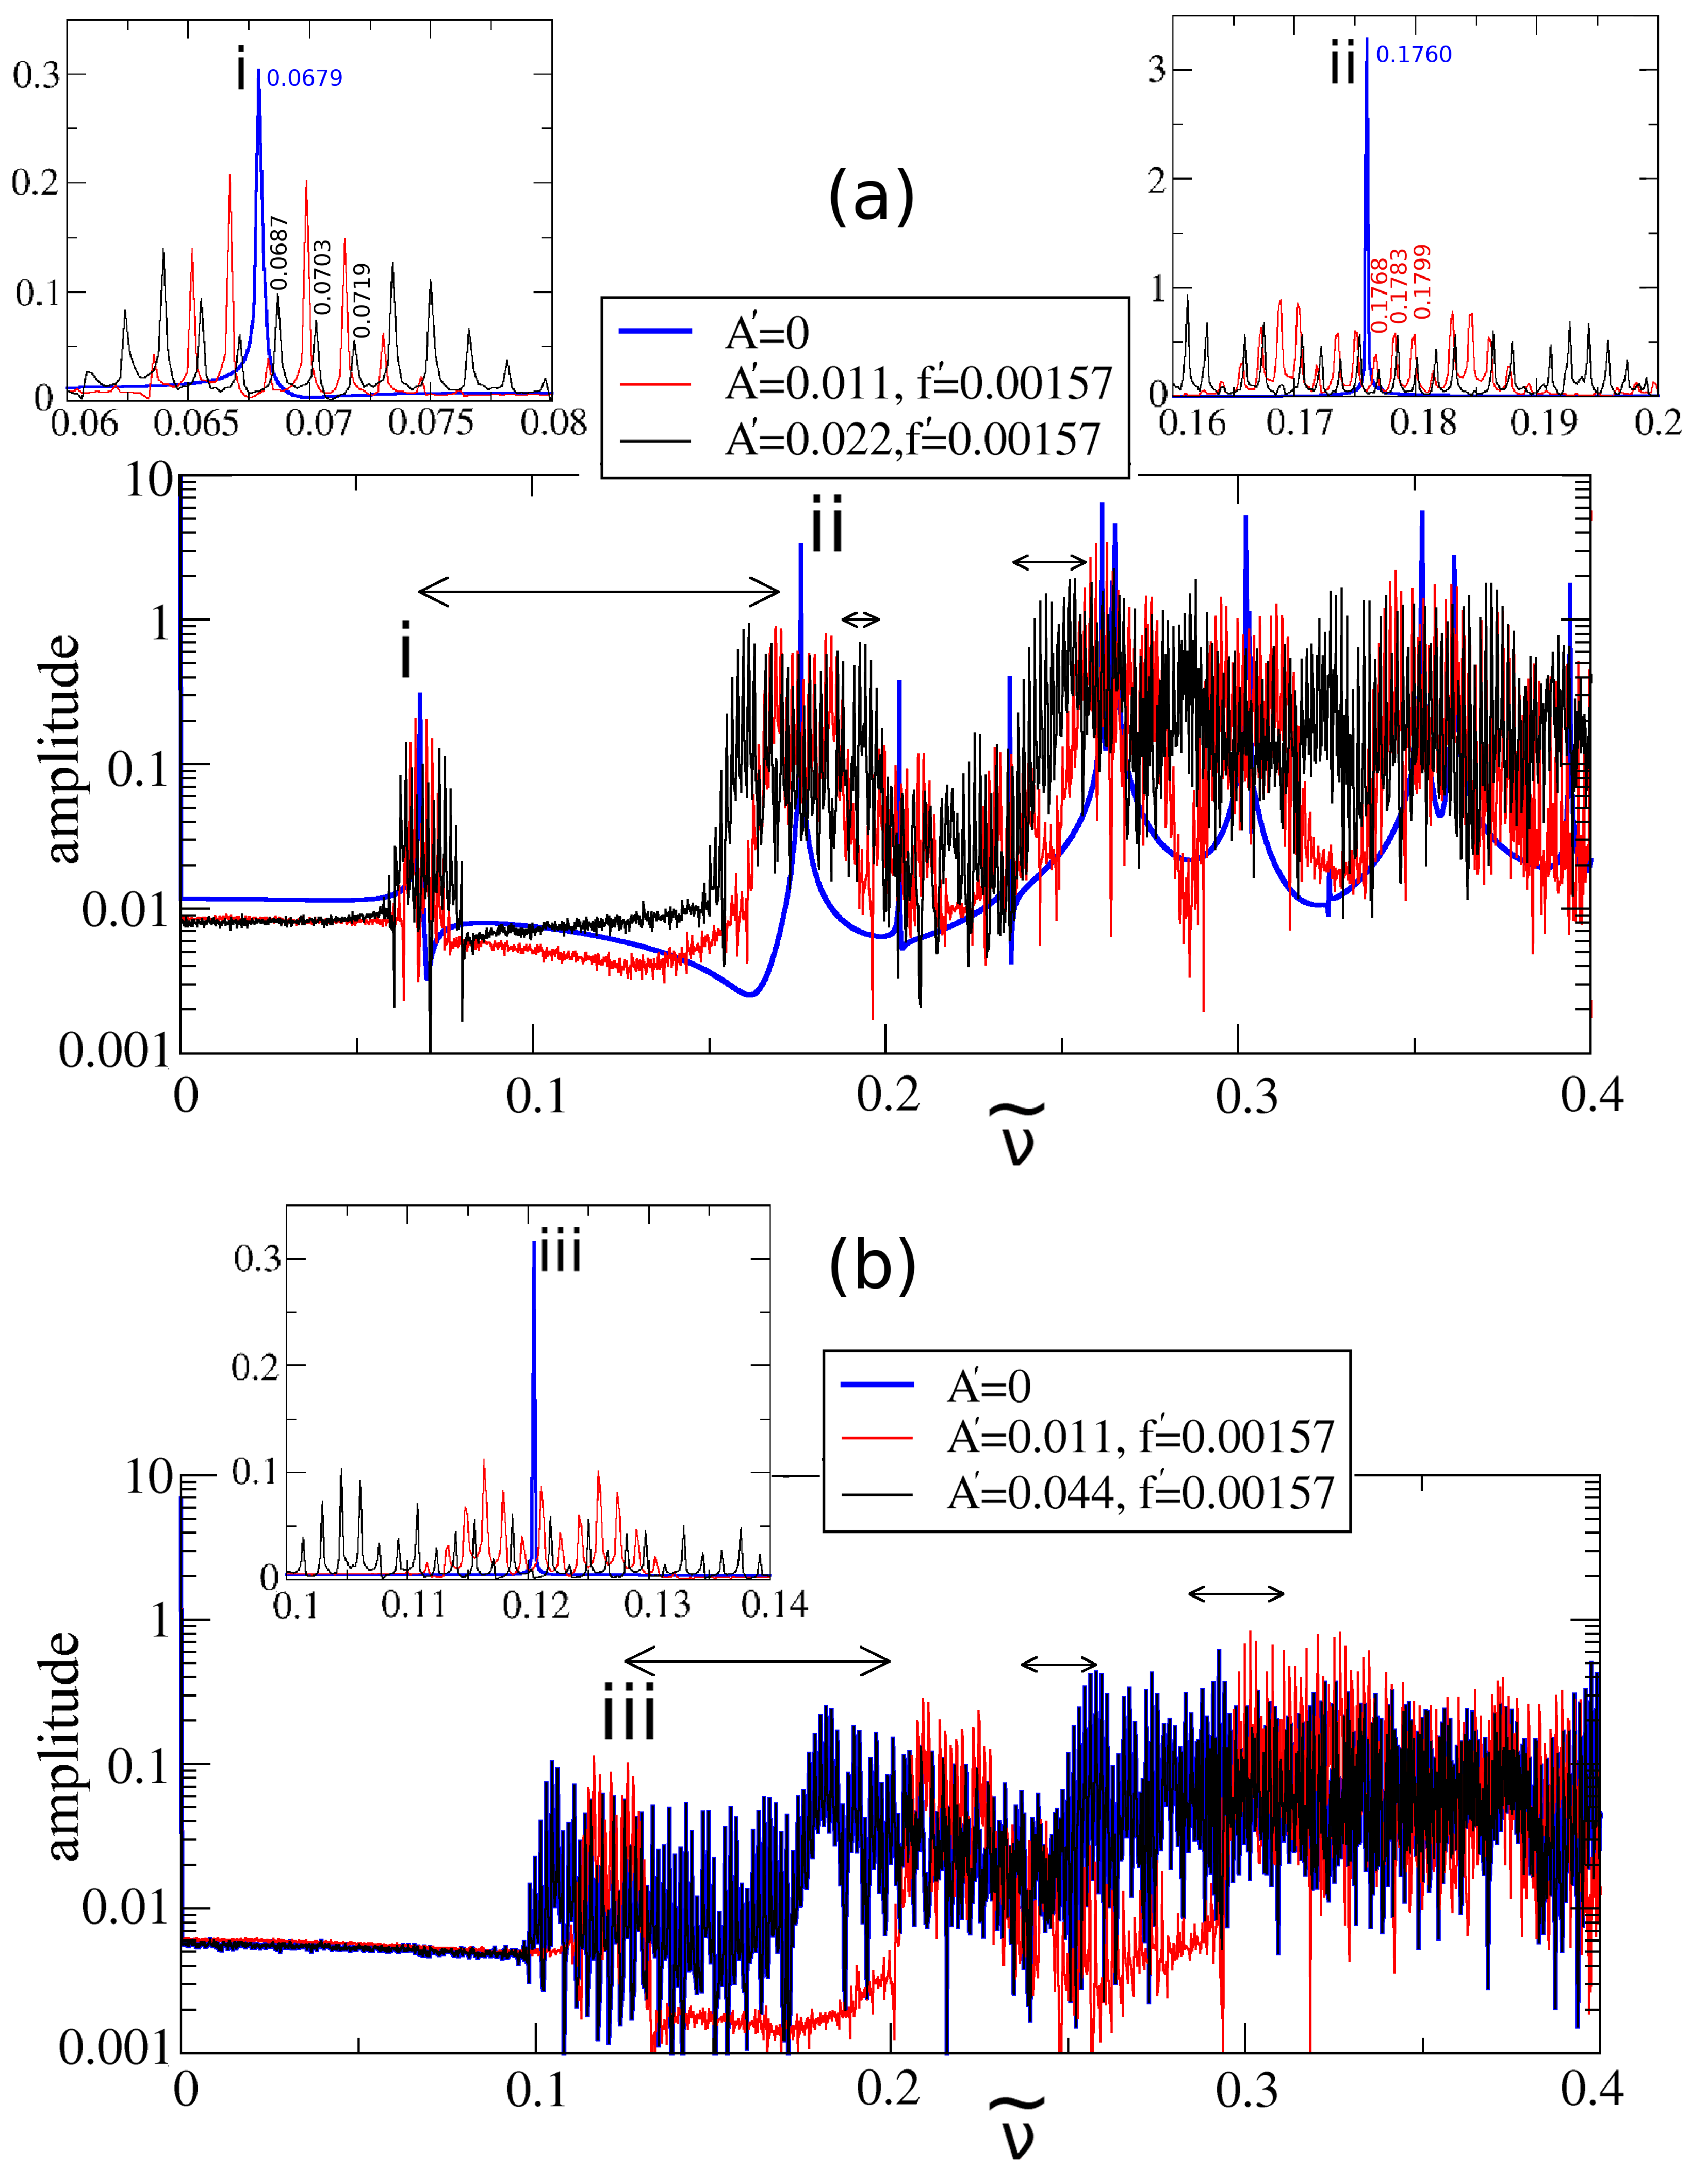
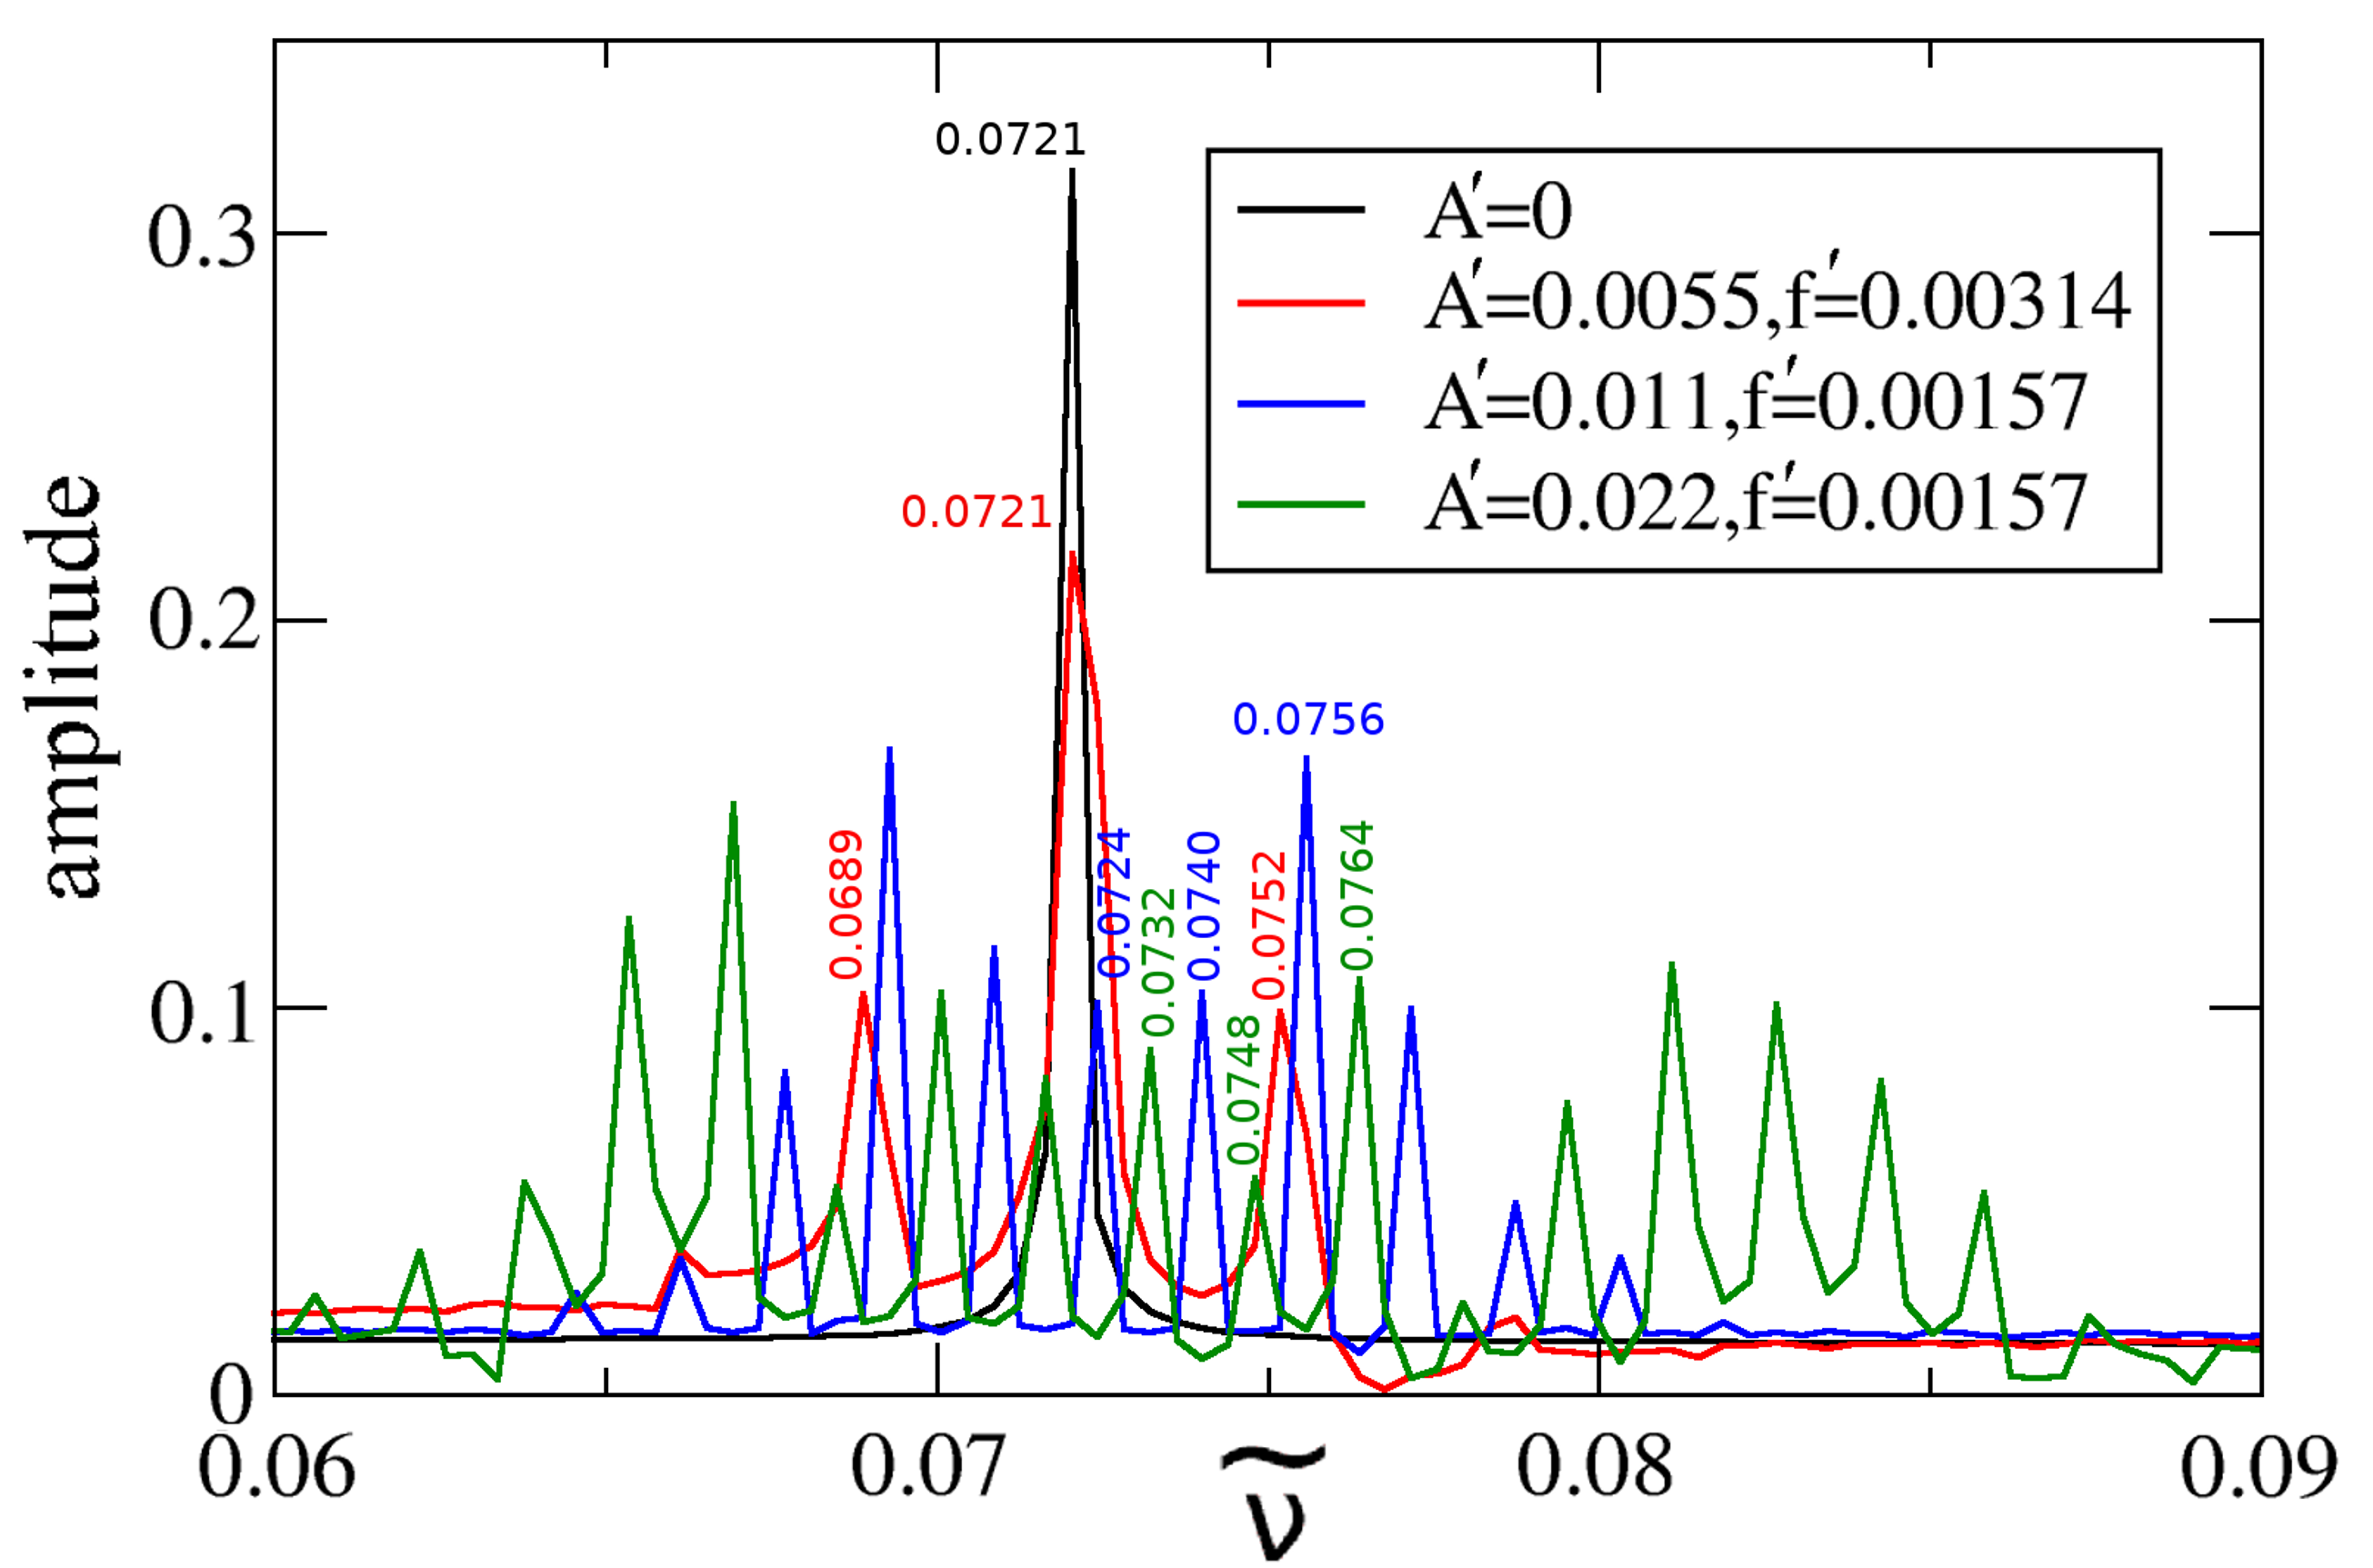
As we time-vary the cylinder radius as outlined in the previous section, for an Fe or a Si cylinder in epoxy, we obtain the spectrum shown in Fig. 3 for various maximum amplitude variations of a sinusoid and fixed modulation frequency, scaled respectively to be dimensionless as and at . The vertical axis depicts the amplitude of the frequency spectrum obtained after Fourier-transforming the value of the displacement at a fixed point inside the cylinder, near its centre. The units for the displacement are arbitrary as mentioned in Sec. II.2 owing to the scalability of the problem as far as the amplitude of the initial pulse is concerned. The horizontal arrows denote the location of the absolute band gaps in the non-time-varying case (viz. Fig. 2). Most notable are the blueshifting of the main resonance peaks, as well as the appearance of accompanying sidebands upon adding time-modulation, offset from the main resonances by the amount of the modulation frequency, and the existence higher harmonics fading with distance in intensity. The sidebands do not necessarily have a smaller amplitude than the main resonance peak. As the modulation amplitude is increased, the resonance peaks become increasingly blueshifted and the sidebands cover a wider frequency range, as can be seen clearly by the insets for the region around the resonance peaks. In the case of Fe in epoxy (Fig. 3a), the two lowest peaks in the non-time-varying case corresponding to a frequency of 0.0679 and 0.1760 are shifted towards the values of 0.0687 and 0.1768 respectively for being 0.011 and 0.022 respectively, as shown in the insets, while the respective sidebands are separated from the respective peaks by multiples of the value as shown, to within an excellent approximation. Further details, involving smaller amplitude modulations and regarding the amplitudes of the displacements upon adding time-modulation, calculated for the system of an Fe cylinder in epoxy, for a larger filling factor, 60%, may be found in the Appendix.
In Fig. 3b, which depicts the frequency spectrum for an Si cylinder in epoxy at 60% filling, the largest depicted is two times larger than that shown in Fig. 3a for Fe cylinders in epoxy and all of the band gaps are completely obliterated although it is clear that the harmonics destroy the band gaps in all cases - especially as a result of the contribution of other wavevectors given that the bands themselves are not flat. However, for small amplitude modulations, the harmonics do die off quickly and in principle, some region within the largest band gap would be left intact. We note that the bands for Fe in epoxy are flatter than for Si in epoxy in the non-time varying case (viz. Fig. 2), something which occurs even for the same filling factors and whose origin lies in the greater hybridization of the continuum bands with the localized resonances from rigid-body modes of the cylinder in the case of Fe, due to the sharper contrast in the densities [35, 7].
For fixed amplitude modulation and varying frequency modulation of the cylinder radius, we obtain the results in Fig. 4, for the two systems, confirming that the sidebands are offset by an amount equal to the modulation frequency and that the blueshift of the main resonance peak compared to the non-time-varying case is unaffected by the value of . In the case of Fe in epoxy in Fig. 4a, the lowest peak in the non-time varying case corresponding to a frequency of 0.0679 is shifted towards the value of 0.0683 for both and 0.00314 for while the sidebands appear at successive separations of from the main peak. The results for the frequency variation confirm that upon adding time-variation, a blueshift is in fact occurring because, as the resonances for different frequency modulation but the same amplitude modulation coincide, there should be a resonance from both modulation frequencies immediately to the left of the nonmodulated resonance in the inset of Fig. 3a if the resonances were redshifted instead of blueshifted, as this peak would have corresponded to the main resonance as opposed to a sideband.

As it constitutes a more realistic implementation of a time-varying radius, we repeated some of our calculations on a simplied model of a mechanically-modulated split-ring structure, that of a hollow cylinder. The results were similar, with large band gaps for a non-time-varying radius and resonances with harmonics when the outer radius is periodically modulated in time. The details and results of out calculations are shown in the Appendix.
III.3 Displacement profiles
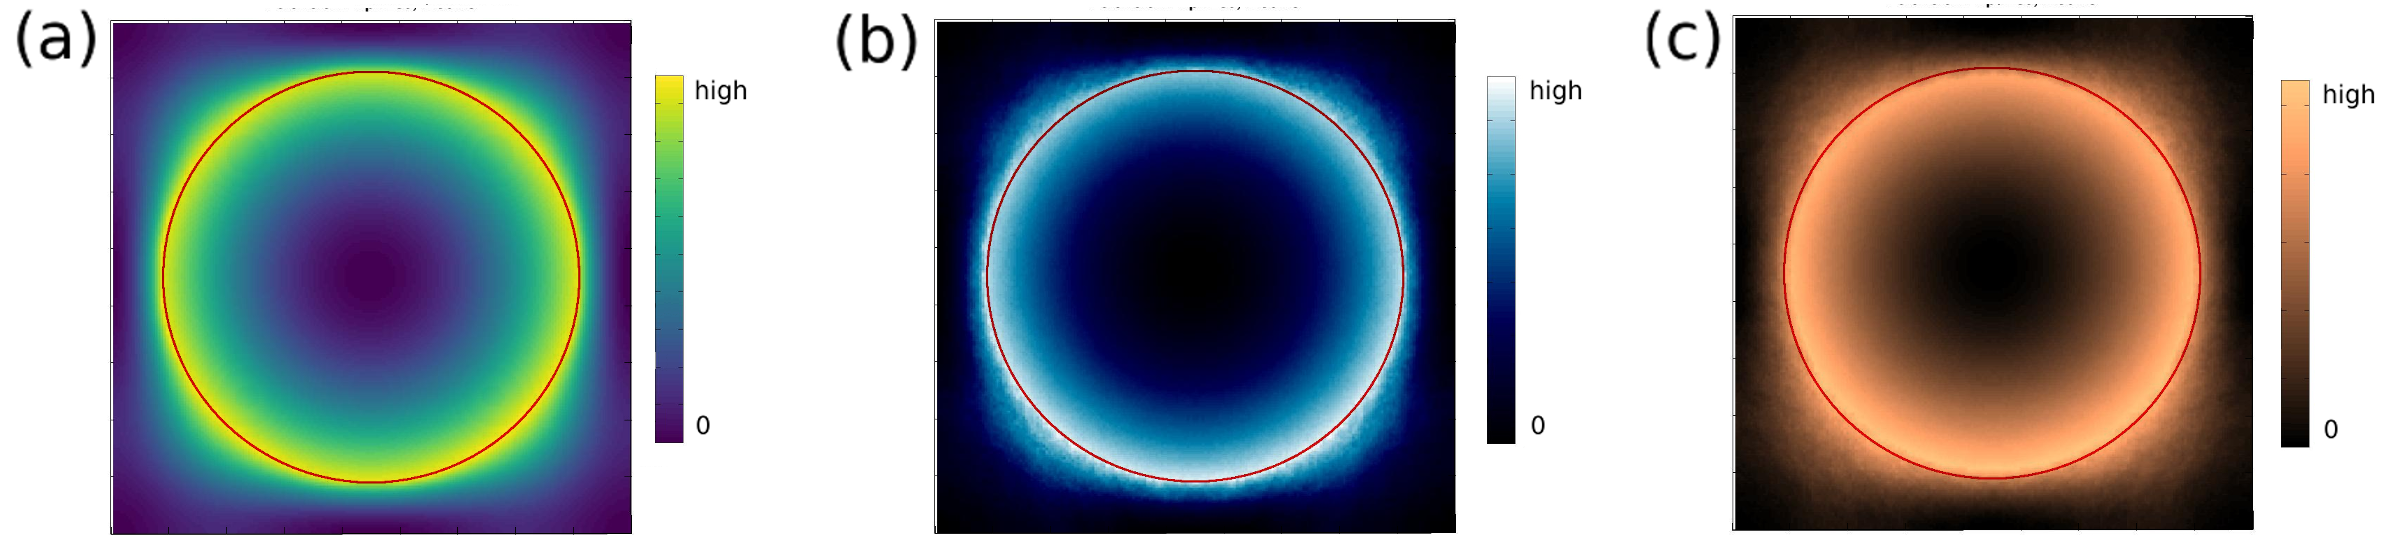
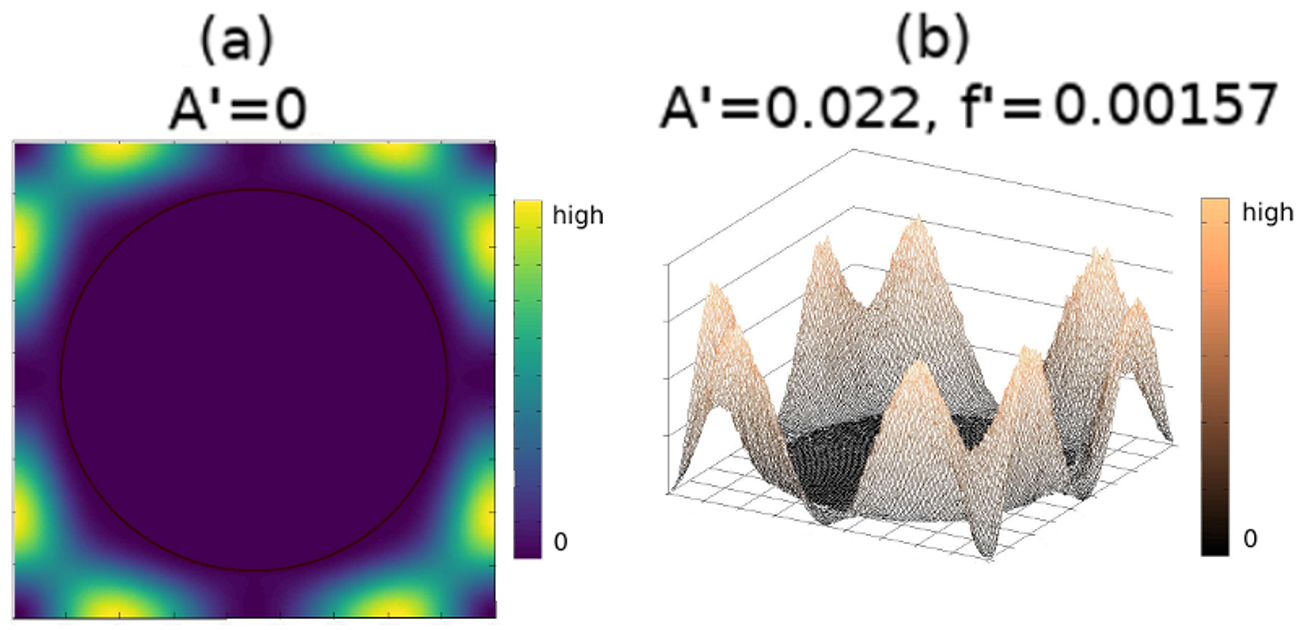
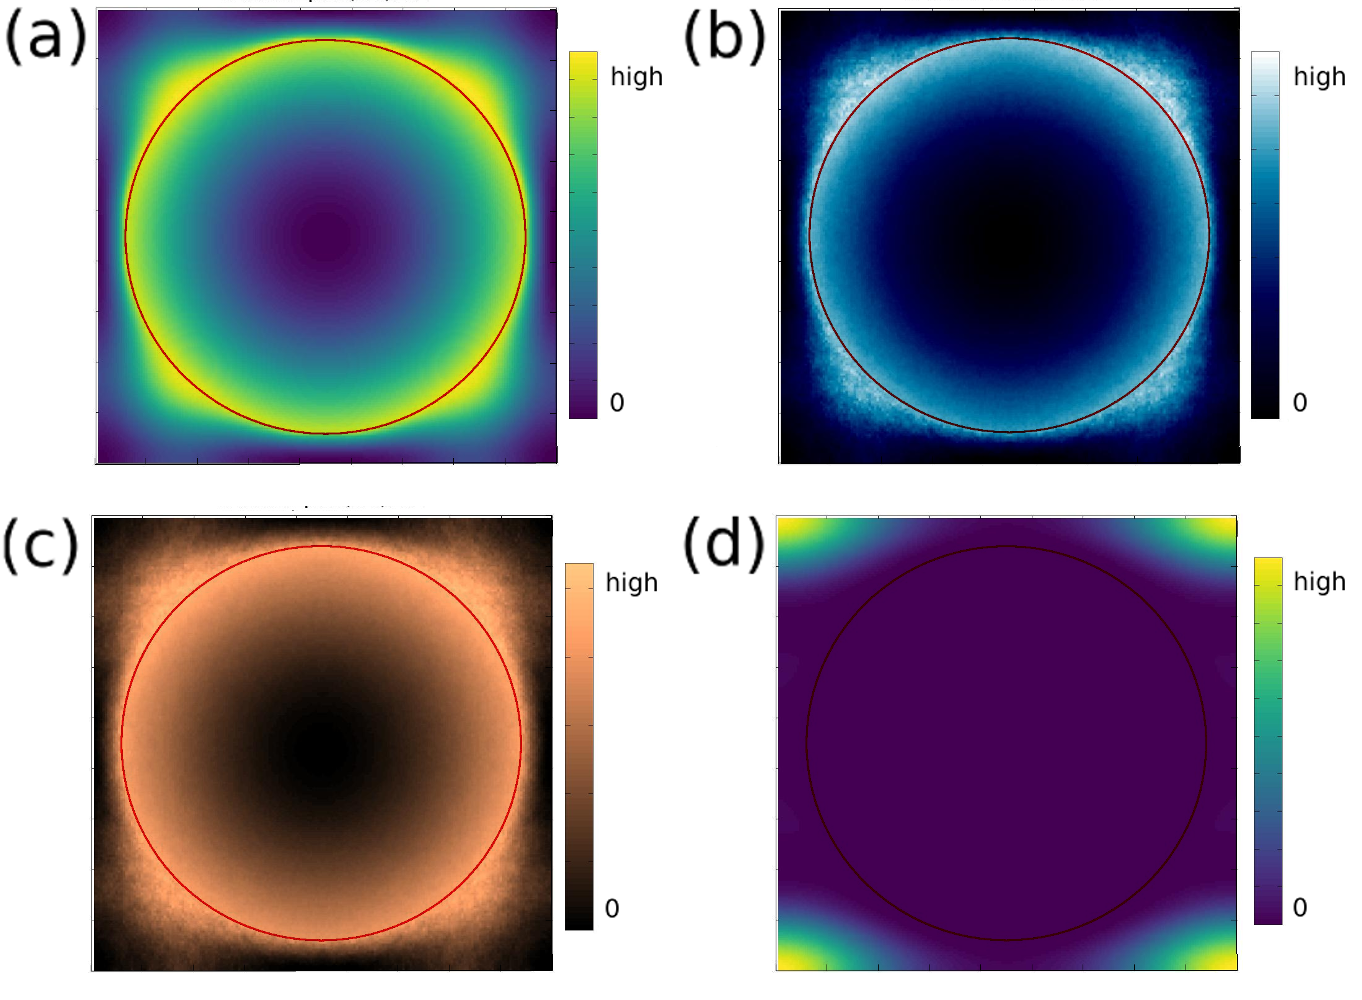
Upon adding time-variation to the material properties, we find that the localization character of the vibrations associated with each resonance remains unchanged; even up to the second harmonic, it remains constant with the only difference from the non-time-varying case being that the surrounding material is also disturbed. In Fig. 5 we show the displacement profile of the lowest resonance peak at the frequency in (a) the non-time-varying case (point X1 in Fig. 2a), and (b) its counterpart for the case where the maximum amplitude is and frequency where the main peak is now at a frequency of . We also show, in Fig. 5c, the localization of the first sideband on the right having a frequency of . In all of these cases, the vibrations were highly localized on the outer edge of the cylinder, albeit blurred in the case of the time-varying case. In all of the higher-frequency resonances, the vibrations were localized outside the cylinder. For example, for point X2 in Fig. 2a, at a reduced frequency of without time-variation, we have Fig. 6a which is only slightly disturbed in Fig. 6b, by adding amplitude and frequency modulation of and respectively, whereupon the resonance frequency shifts slightly to . In all of the above situations, the displacement profile was generated by exciting with a plane wave at the frequency being investigated, and examining the square of the displacement in the plane at steady state once the excitation has long died out. During the steady state, there are of course vibrations but the localization character of each resonance remains unchanged.
In Fig. 7 we plot the displacement profile for a Si cylinder in epoxy for the lowest resonance peak at the frequency 0.1205 in the non-time-varying case (point Y1 in Fig. 2b), and in order to compare it with its counterpart at the frequency 0.1217 in the time-varying case where and (viz. inset in Fig. 4b) in Fig. 7b. In Fig. 7c we show the second harmonic of the lowest resonance at Similar to the case of Fe in epoxy, the vibrations are highly localized on the edge of the Si cylinder (outlined in the figures) although it is markedly blurry in the time-varying case. There are bulges near the corners of the unit cell which are associated with the proximity of the neighbouring cylinders. They are not present in the case of the Fe cylinder in epoxy depicted earlier because there the filling factor was 50%, but they are seen in that system as well for a filling factor of 60%. As for the case of Fe in epoxy, for the higher resonances, the vibrations are localized in the matrix outside the cylinder. In Fig. 7d we show the localization of the vibrations for the point Y2 in Fig. 2b located at Point Y2 actually corresponds to two very nearly degenerate frequencies, with virtually-identical localization profiles. Just one of these is shown in Fig. 7d, with more details provided in the Appendix. Due to the close proximity of the cylinders at this large filling factor in neighbouring unit cells, the vibrations of this resonance are preferentially localized around the corners of the unit cell, where the spacing between neighbouring cylinders is greatest.
IV Conclusions
We have examined the effect of periodic strucural modulations in two phononic materials composed of a cylinder inside a matrix of highly-contrasting elastic properties and we have found that in general the large band gaps are destroyed by harmonics generated by the temporal modulation. However, the resonances’ time-harmonics induced by structural modulations may be exploited in order to achieve tunable phononic isolation or alternatively, bandpass filtering given that in phononic systems with fairly flat bands, by employing a large-enough modulation frequency, it is feasible that small band gaps could be retained for some regions. The harmonics’ periodicity and wide range could also find implementation in a frequency sensor. Modulating the cylinders’ radius may be achieved relatively simply: such as by a mechanically-modulated split-ring structure where the two components have a different radius.
V Appendix
V.1 Fe cylinder in Epoxy, filling factor of 60%
In Fig. A1 we show results for the frequency spectrum for the lowest resonance at (analogous to point X1 in Fig. 2a in the main text) for the system of an Fe cylinder in epoxy for a filling factor of 60% for a time-varying cylinder radius for different maximum amplitude and frequency variations. The blueshift for the smallest amplitude variation (=0.0055) is not discernible for the calculational parameters used but it is evident for the larger In general, the results are similar to the case of 50% filling described in the main text. In the case of a time-varying cylinder radius, sidebands and higher harmonics appear around the main resonance peak, separated by the value of the dimensionless frequency .
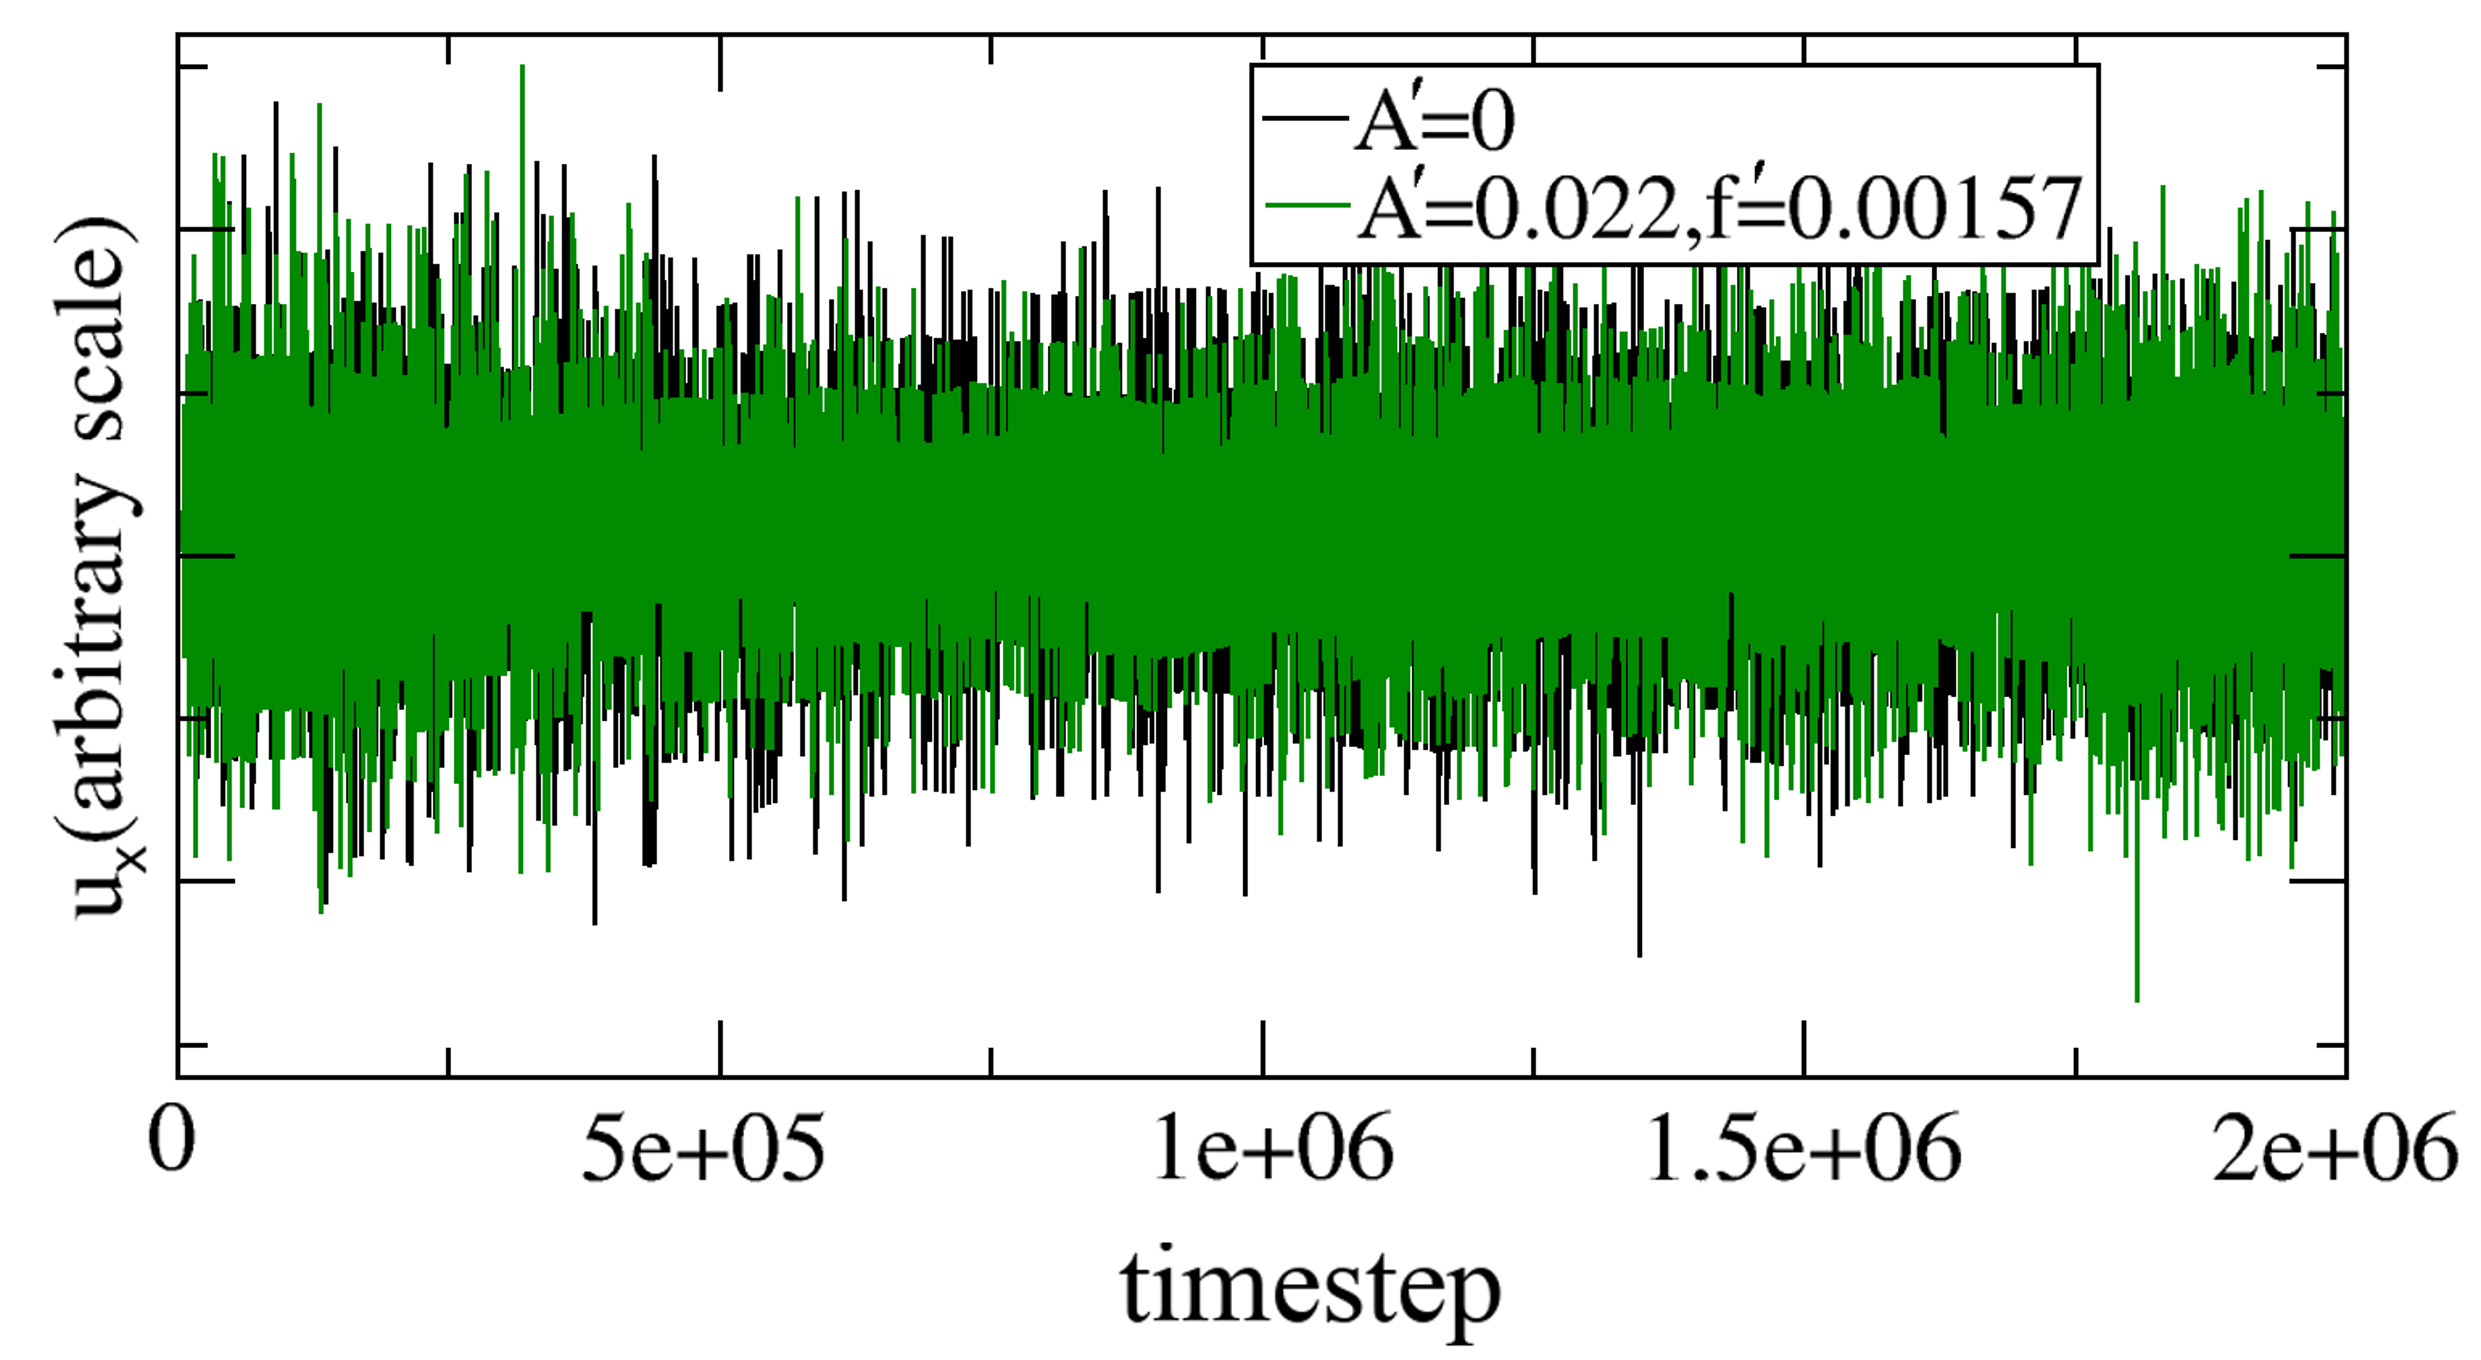
In Fig. A2 we show, for the same system, for a fixed as well as for a time-varying cylinder radius, the variation of the material displacement at a point inside the cylinder, as a function of time, where the timestep is 7.698 for being the lattice parameter and the speed of a longitudinal sound wave in the background medium (epoxy). The magnitude of the displacement is entirely scalable as it varies linearly with the magnitude of the initial pulse used to excite a point inside the system. Therefore, the displacements may in this manner be constrained to the regime of linear elasticity. As can be seen from the figure, the displacements are on the same scale either for a fixed or for a time-varying cylinder radius.
V.2 Hollow Cylinder of Fe in Epoxy
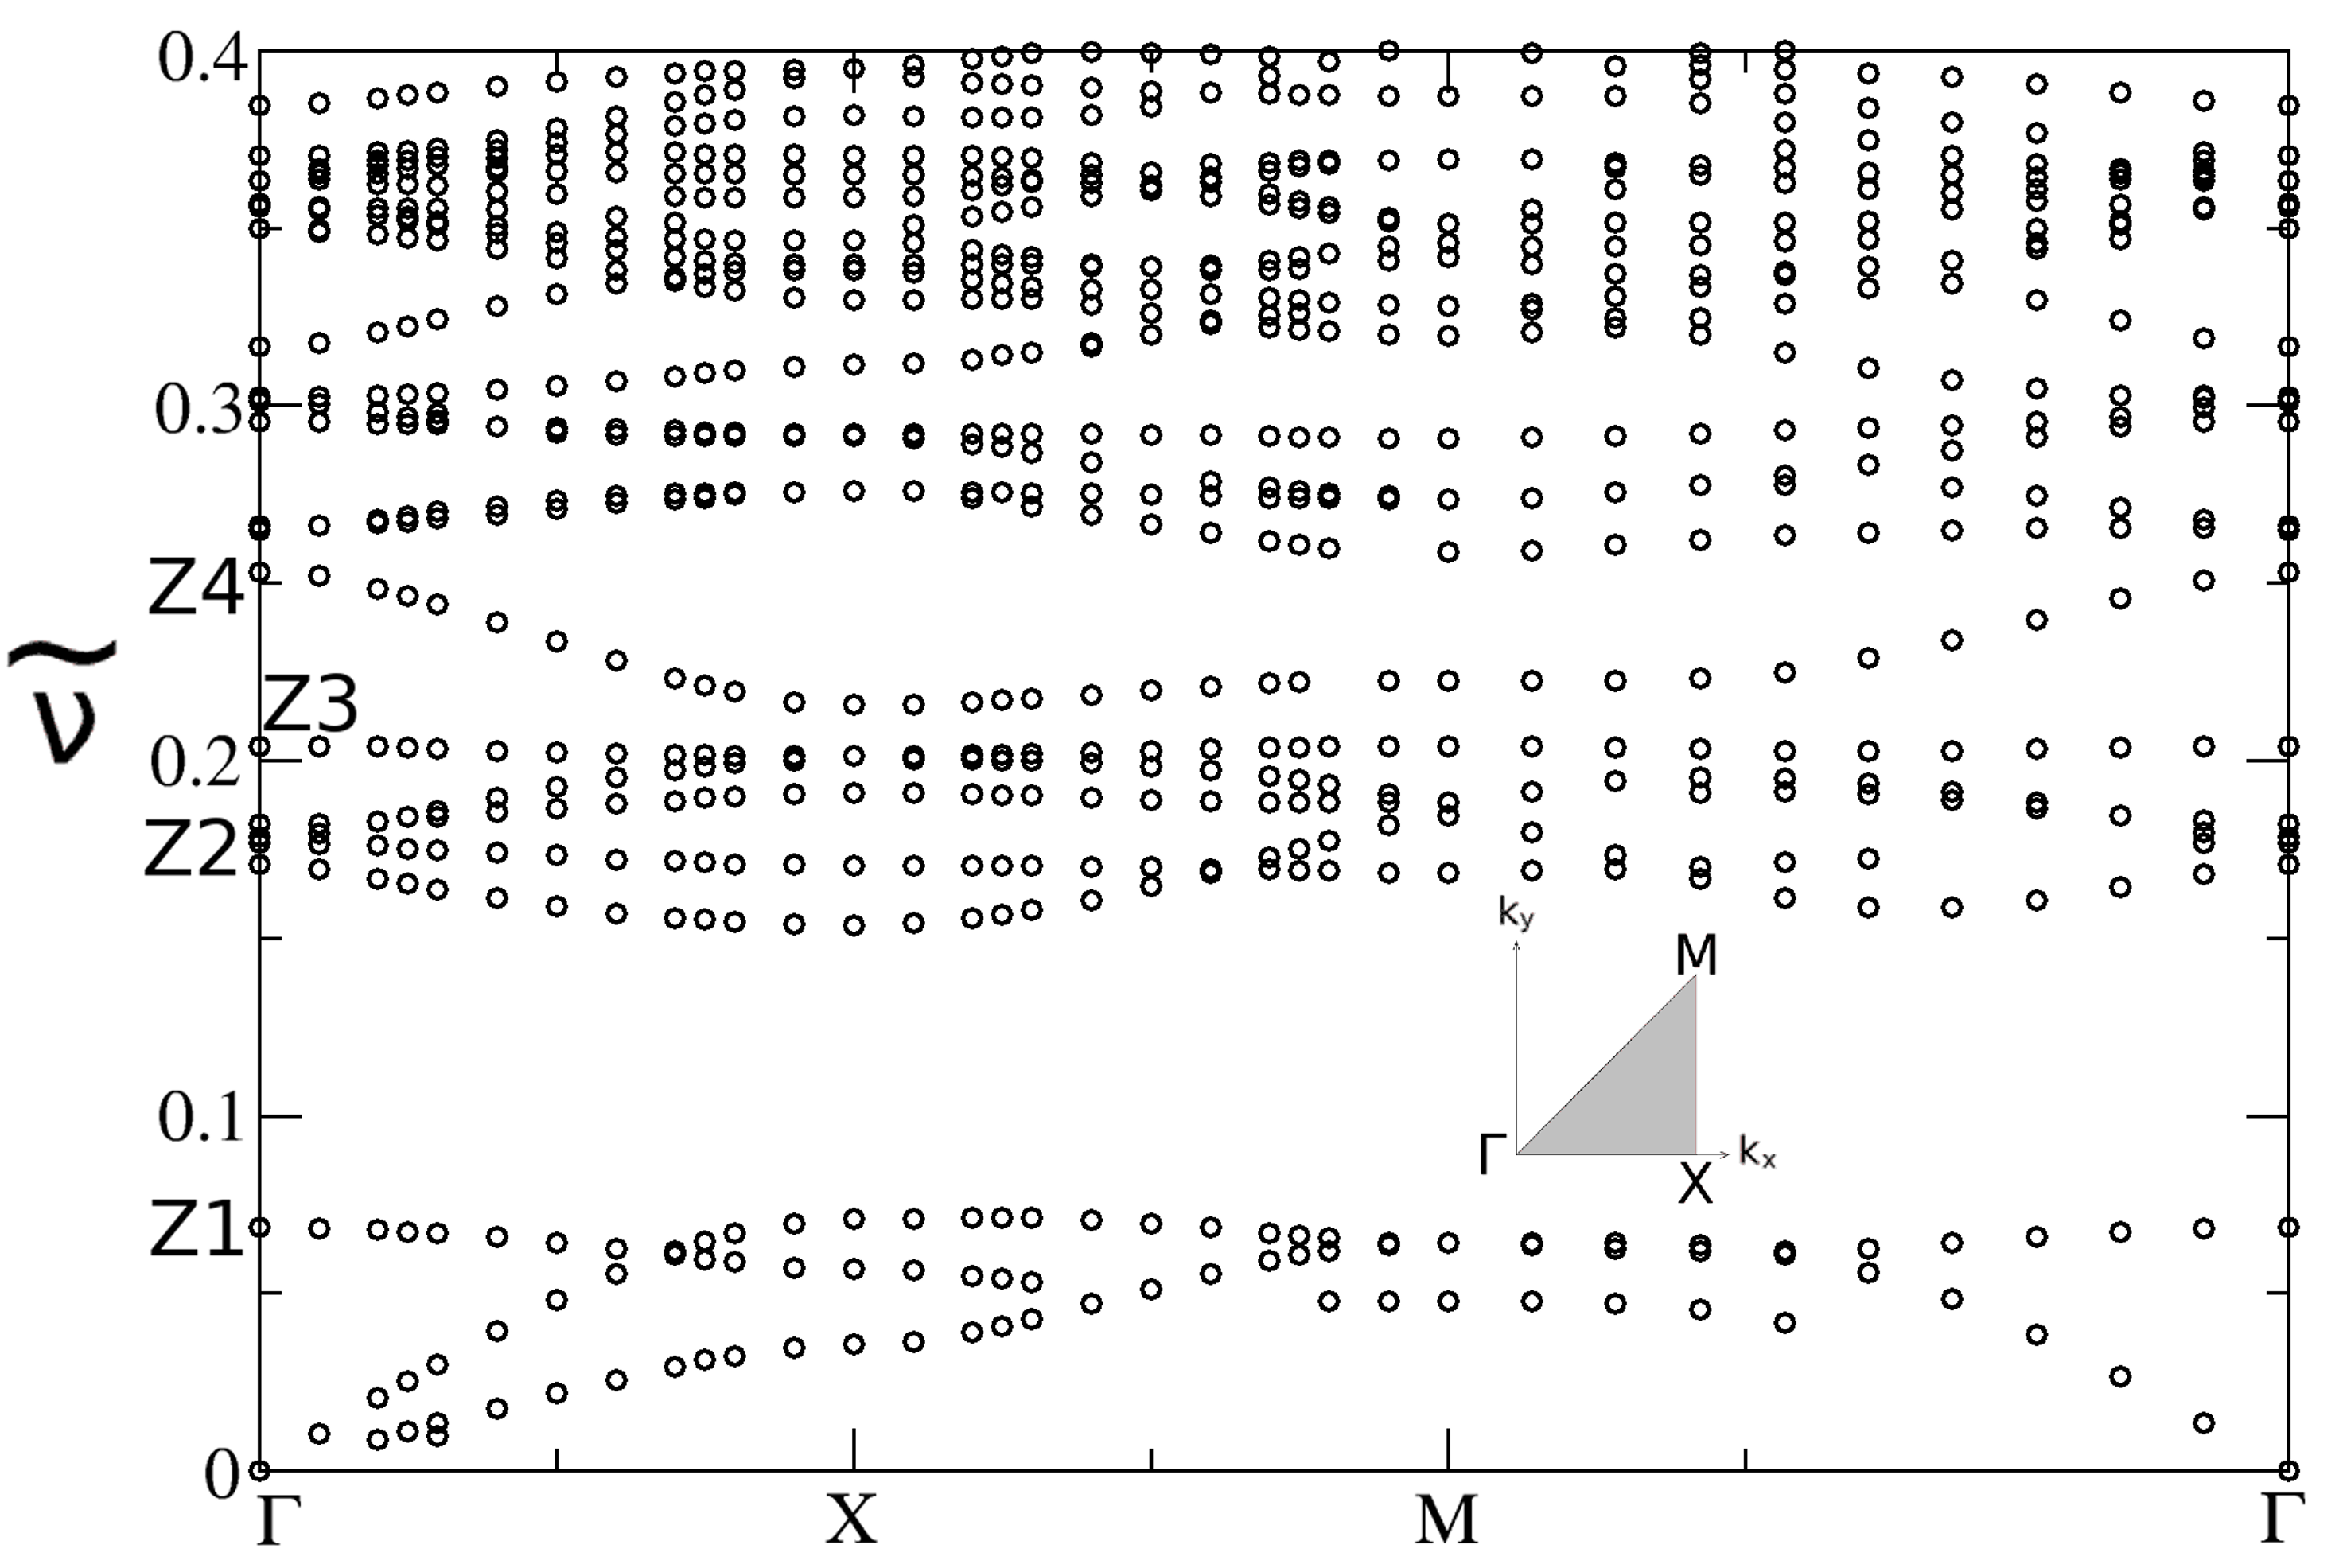
If, instead of a solid cylinder as in the main text, we have a hollow cylinder of Fe in Epoxy with the same outer dimension as the cylinder described in the main text (of 50% filling factor) and inner dimension as shown by the outlines in Fig. A5, we obtain the band structure of Fig. A3 for elastic waves polarized in the plane of the unit cell for a non-time-varying system. In general, the band structure is very similar to its counterpart for a solid cylinder (Fig. 2a in the main text).

As we time-vary the outer radius of the cylinder, we obtain the spectrum shown in Fig. A4 for different maximum amplitude variations and modulation frequencies, scaled respectively to be dimensionless as and at . The vertical axis depicts the amplitude of the frequency spectrum obtained after Fourier-transforming the value of the displacement at a fixed point inside the cylinder, near its centre. The horizontal arrows denote the location of the absolute band gaps in the non-time-varying case (viz. Fig. A3).
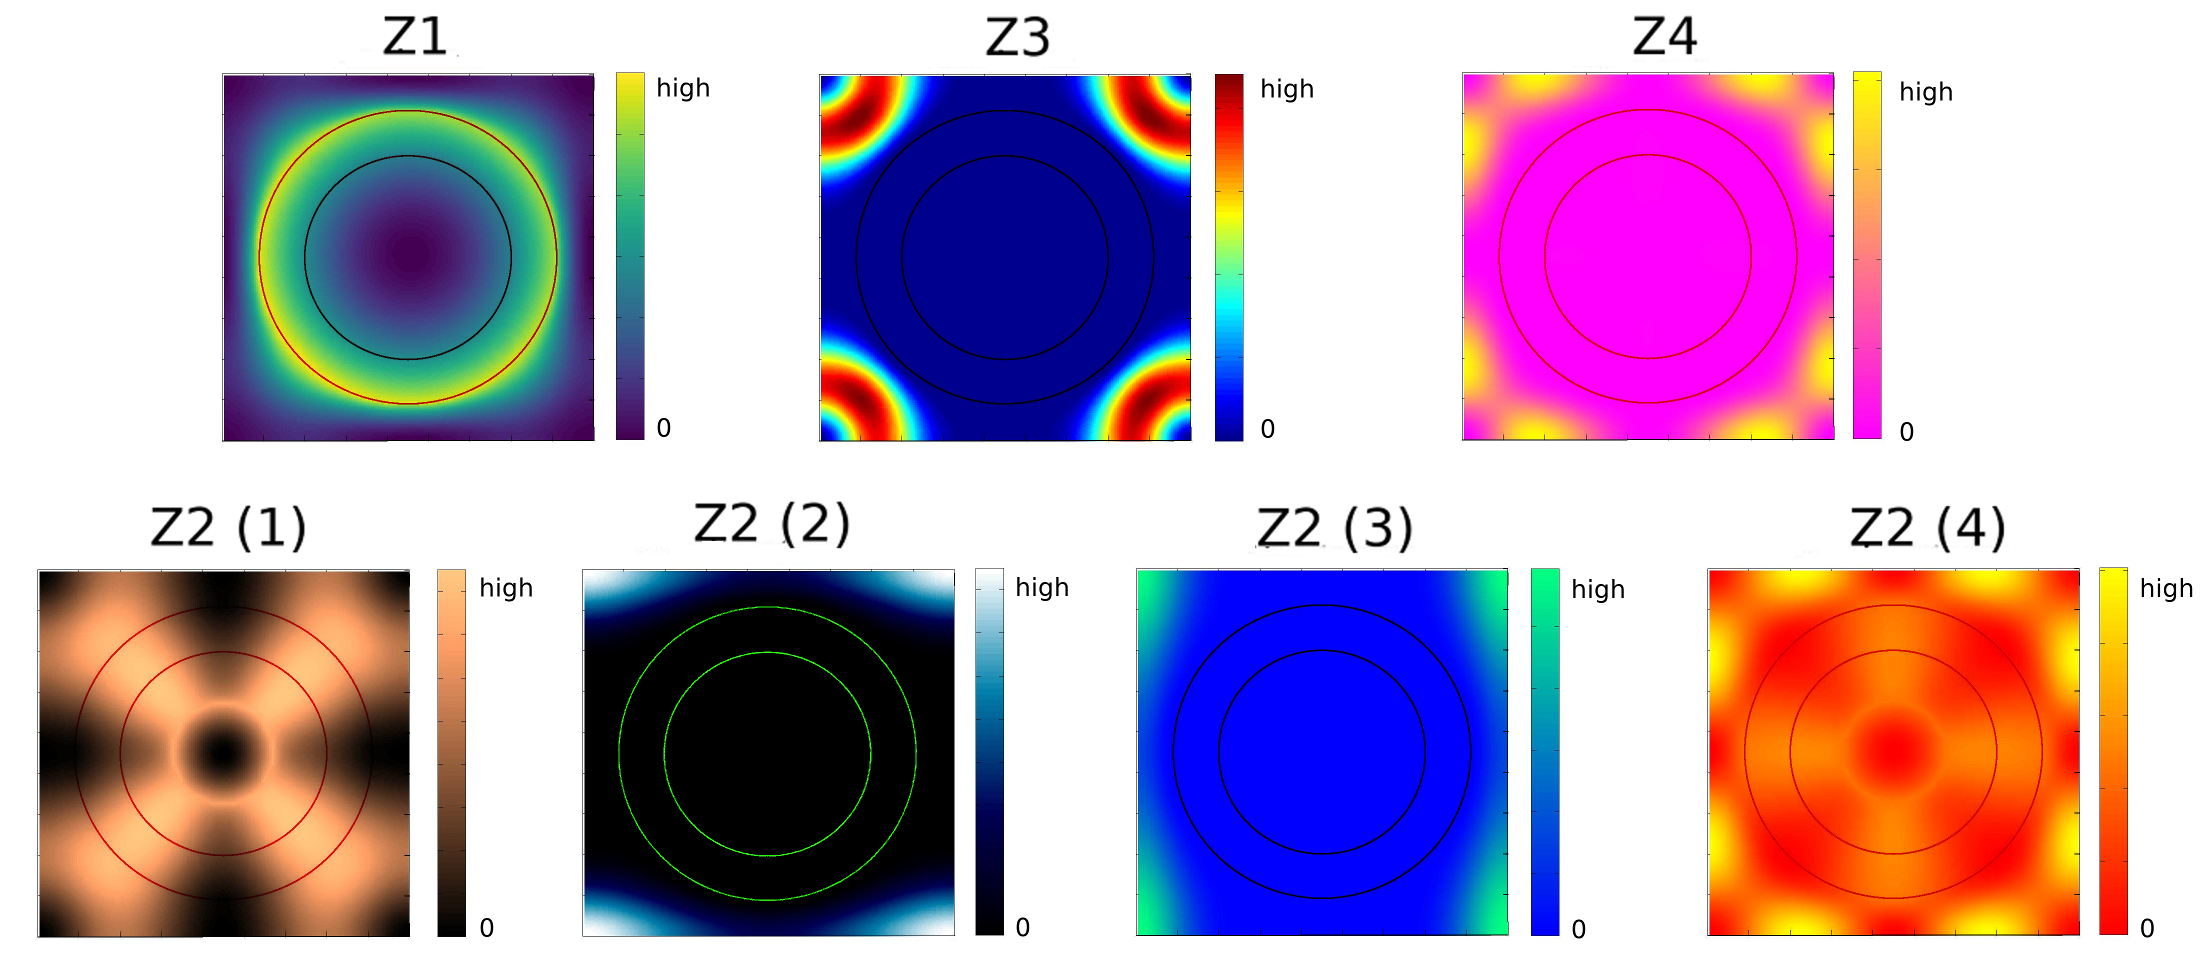
In Fig. A5 we show the displacement profiles of the system for the points Z1-Z4 at in Fig. A3. The point Z2 actually corresponds to four nearly-degenerate frequencies. Specifically, we display a plane projection of the displacement of a point inside the ring in order to visualize the localization of the vibrations.
The results are very similar to the corresponding case of a solid cylinder. The displacement profile of point Z1 has the same character as that of point X1 (viz. Fig. 5a). Point Z4 here corresponds to the displacement profile of point X2 in that case (viz. Fig. 6a). Point Z2 has a strong lifting of its degeneracy and only two of the four closely-spaced modes show the same localization as in the solid cylinder case: Z2(2) and Z2(3) which correspond to the two nearly-degenerate modes located at the point Y2 in Fig. 7d for the Si cylinder in epoxy. In Fig. 7d we showed only one of these (corresponding to Z2(2) here). The profiles Z2(1) and Z2(4) show symmetries not seen in the case of the solid cylinder showing strong indications of mixing with the higher modes Z3 and Z4.
References
- Sigalas et al. [2005] M. Sigalas, M. S. Kushwaha, E. N. Economou, M. Kafesaki, I. E. Psarobas, and W. Steurer, Classical vibrational modes in phononic lattices: theory and experiment, Z. Kristallogr. 220, 765 (2005).
- Cummer et al. [2016] S. A. Cummer, J. Christensen, and A. Alù, Controlling sound with acoustic metamaterials, Nat. Rev. Mater. 1, 16001 (2016).
- Tanaka et al. [2000] Y. Tanaka, Y. Tomoyasu, and S. I. Tamura, Band structure of acoustic waves in phononic lattices: Two-dimensional composites with large acoustic mismatch, Phys. Rev. B 62, 7387 (2000).
- Sigalas [1997] M. M. Sigalas, Elastic wave band gaps and defect states in two-dimensional composites, J. Acoust. Soc. Am. 101, 1256 (1997).
- Sigalas and Garcia [2000] M. M. Sigalas and N. Garcia, Theoretical study of three dimensional elastic band gaps with the finite-difference time-domain method, J. Appl. Phys. 87, 3122 (2000).
- Kafesaki et al. [1995] M. Kafesaki, M. M. Sigalas, and E. N. Economou, Elastic wave band gaps in 3-d periodic polymer matrix composites, Solid State Commun. 96, 285 (1995).
- Sainidou et al. [2002] R. Sainidou, N. Stefanou, and A. Modinos, Formation of absolute frequency gaps in three-dimensional solid phononic crystals, Phys. Rev. B 66, 212301 (2002).
- Vasseur et al. [1994] J. O. Vasseur, B. Djafari-Rouhani, L. Dobrzynski, M. S. Kushwaha, and P. Halevi, Complete acoustic band gaps in periodic fibre reinforced composite materials: the carbon/epoxy composite and some metallic systems, J. Phys.-Condens. Matt. 6, 8759 (1994).
- B.Graczykowski et al. [2020] B.Graczykowski, N. Vogel, K. Bley, H.-J. Butt, and G. Fytas, Multiband hypersound filtering in two-dimensional colloidal crystals: Adhesion, resonances and periodicity, Nano Lett. 20, 1883 (2020).
- A.A.Maznev et al. [2013] A.A.Maznev, A. Every, and O.B.Wright, Reciprocity in reflection and transmission: What is a ‘phonon diode’?, Wave Motion 50, 776 (2013).
- Attarzadeh and Nouh [2018a] M. A. Attarzadeh and M. Nouh, Elastic wave propagation in moving phononic crystals and correlations with stationary spatiotemporally modulated systems, AIP Adv. 8, 105302 (2018a).
- Trainiti and Ruzzene [2016] G. Trainiti and M. Ruzzene, Non-reciprocal elastic wave propagation in spatiotemporal periodic structures, New J. Phys. 18, 083047 (2016).
- Attarzadeh and Nouh [2018b] M. A. Attarzadeh and M. Nouh, Non-reciprocal elastic wave propagation in 2d phononic membranes with spatiotemporally varying material properties, J. Sound Vib. 422, 264 (2018b).
- Nassar et al. [2017a] H. Nassar, X. C. Xu, A. N. Norris, and G. L. Huang, Modulated phononic crystals: Non-reciprocal wave propagation and willis materials, J. Mech. Phys. Solids 101, 10 (2017a).
- Goldsberry et al. [2019] B. M. Goldsberry, S. P. Wallen, and M. R. Haberman, Non-reciprocal wave propagation in mechanically-modulated continuous elastic metamaterials, J. Acoust. Soc. Am. 146, 782 (2019).
- Wang et al. [2018] Y. Wang, B. Yousefzadeh, H. Chen, H. Nassar, G. Huang, and C. Daraio, Observation of nonreciprocal wave propagation in a dynamic phononic lattice, Phys. Rev. Lett. 121, 194301 (2018).
- Trainiti et al. [2019] G. Trainiti, Y. Xia, J. Marconi, G. Cazzulani, A. Erturk, and M. Ruzzene, Time-periodic stiffness modulation in elastic metamaterials for selective wave filtering: Theory and experiment, Phys. Rev. Lett. 122, 124301 (2019).
- Casadei et al. [2012] F. Casadei, T. Delpero, A. Bergamini, P. Ermanni, and M. Ruzzene, Piezoelectric resonator arrays for tunable acoustic waveguides and metamaterials, J. Appl. Phys. 112, 064902 (2012).
- Chen et al. [2014] Y. Y. Chen, G. L. Huang, and C. T. Sun, Band gap control in an active elastic metamaterial with negative capacitance piezoelectric shunting, J. Vib. Acoust. 136, 061008 (2014).
- Merkel et al. [2018] A. Merkel, M. Willatzen, and J. Christensen, Dynamic nonreciprocity in loss-compensated piezophononic media, Phys. Rev. Appl. 9, 034033 (2018).
- Danas et al. [2012] K. Danas, S. V. Kankanala, and N. Triantafyllidis, Experiments and modeling of iron-particle-filled magnetorheological elastomers, J. Mech. Phys. Solids 60, 120 (2012).
- Shen et al. [2019] C. Shen, J. Li, Z. Jia, Y. Xie, and S. A. Cummer, Nonreciprocal acoustic transmission in cascaded resonators via spatiotemporal modulation, Phys. Rev. B 99, 134306 (2019).
- Li et al. [2019a] J. Li, X. Zhu, C. Shen, X. Peng, and S. A. Cummer, Transfer matrix method for the analysis of space-time-modulated media and systems, Phys. Rev. B 100, 144311 (2019a).
- Attarzadeh et al. [2020] M. A. Attarzadeh, J. Callanan, and M. Nouh, Experimental observation of nonreciprocal waves in a resonant metamaterial beam, Phys. Rev. Appl. 13, 021001 (2020).
- Yi et al. [2017] K. Yi, M. Collet, and S. Karkar, Frequency conversion induced by time-space modulated media, Phys. Rev. B 96, 104110 (2017).
- Li et al. [2019b] J. Li, C. Shen, X. Zhu, Y. Xie, and S. A. Cummer, Nonreciprocal sound propagation in space-time modulated media, Phys. Rev. B 99, 144311 (2019b).
- Nassar et al. [2017b] H. Nassar, H. Chen, A. N. Norris, M. R. Haberman, and G. L. Huang, Non-reciprocal wave propagation in modulated elastic metamaterials, Proc. R. Soc. A 473, 20170188 (2017b).
- Zhu et al. [2020] X. Zhu, J. Li, C. Shen, X. Peng, A. Song, L. Li, and S. A. Cummer, Non-reciprocal acoustic transmission via space-time modulated membranes, Appl. Phys. Lett. 116, 034101 (2020).
- Riva et al. [2020] E. Riva, M. D. Ronco, A. Elabd, G. Cazzulani, and F. Braghin, Non-reciprocal wave propagation in discretely modulated spatiotemporal plates, J. Sound Vib. 471, 115186 (2020).
- Attarzadeh et al. [2018] M. Attarzadeh, H. A. Ba’ba’a, and M. Nouh, On the wave dispersion and non-reciprocal power flow in space-time traveling acoustic metamaterials, Appl. Acoust. 133, 210 (2018).
- Cassedy and Olner [1963] E. S. Cassedy and A. A. Olner, Dispersion relations in time-space periodic media: Part I - stable interactions, Proc. IEEE 51, 1342 (1963).
- Cassedy [1965] E. S. Cassedy, Waves guided by a boundary with time-space periodic modulation, Proc. Inst. Electr. Eng. 112, 269 (1965).
- Landau and Lifshitz [1987] L. D. Landau and E. M. Lifshitz, Fluid Mechanics (Pergamon Press, 1987).
- Kushwaha and Halevi [1994] M. S. Kushwaha and P. Halevi, Bandgap engineering in periodic elastic composites, Appl. Phys. Lett. 64, 1085 (1994).
- Kushwaha and Djafari-Rouhani [1998] M. S. Kushwaha and B. Djafari-Rouhani, Giant sonic stop bands in two-dimensional periodic system of fluids, J. of Appl. Phys. 84, 4677 (1998).