Sigl: Securing Software Installations Through Deep Graph Learning††thanks: Sigl is pronounced as “seagull”.
Abstract
Many users implicitly assume that software can only be exploited after it is installed. However, recent supply-chain attacks demonstrate that application integrity must be ensured during installation itself. We introduce Sigl, a new tool for detecting malicious behavior during software installation. Sigl collects traces of system call activity, building a data provenance graph that it analyzes using a novel autoencoder architecture with a graph long short-term memory network (graph LSTM) for the encoder and a standard multilayer perceptron for the decoder. Sigl flags suspicious installations as well as the specific installation-time processes that are likely to be malicious. Using a test corpus of 625 malicious installers containing real-world malware, we demonstrate that Sigl has a detection accuracy of 96%, outperforming similar systems from industry and academia by up to 87% in precision and recall and 45% in accuracy. We also demonstrate that Sigl can pinpoint the processes most likely to have triggered malicious behavior, works on different audit platforms and operating systems, and is robust to training data contamination and adversarial attack. It can be used with application-specific models, even in the presence of new software versions, as well as application-agnostic meta-models that encompass a wide range of applications and installers.
1 Introduction
Software installation is risky. Installer programs often execute with administrative privileges, providing installation-time attackers with powerful capabilities to immediately corrupt a system or establish longer-term persistent threats. Signed installation packages verify a package’s origin, but not its semantic integrity—installers can be corrupted before they are signed. Thus, as post-installation malware detection has become more sophisticated, corruption of digital supply chains increased by 78% in the one year from 2018 to 2019 [2]. For example, CCleaner is a popular application for removing unused files on desktop computers. In 2017, attackers breached several workstations belonging to its developers, inserting bot software into the official application. The compromised installer was downloaded by 2.27 million users, including employees from major tech companies (e.g., Google, and Microsoft) before being detected and removed [40].
Unfortunately, there are no strong defenses against malicious installation. Fingerprint-based malware detection is easy to evade by tweaking a few bytes of installation data [39]. Content-agnostic tools try to blacklist the untrusted servers and web pages that host malicious software [8]; however, as the CCleaner attack demonstrates, corrupted supply chains provide malicious content via trusted sources. More sophisticated detection algorithms assign dynamic reputation scores to file servers [67, 73]. However, calculating reputation scores is difficult, requiring labeled malware samples [73] or a priori knowledge about the characteristics of malicious files [67].
To improve detection accuracy, server reputation scoring can be augmented with client-side anomaly detection. For example, data provenance frameworks observe causal interactions between kernel-level objects, such as processes, files, and network sockets [10]. Malicious installers will manipulate these objects in ways that are statistically unlikely (and thus detectable using statistical analysis). However, approaches using data provenance [28, 49] are designed for long timescales and unpredictable exploit timings: a provenance log spans weeks or months of system activity, with threats potentially arriving at any moment during the logging period. To reduce log sizes, provenance systems reduce high-fidelity event logs to lower-fidelity summarizations, performing intrusion detection on the summaries. Unfortunately, summarizations hurt diagnostic ability; they omit important contextual information about, for example, the specific processes that malware launched, and the specific files that malware accessed. When they correctly detect an anomaly, reconstructing the low-level details of how the attack unfolded requires manual work that is difficult and error-prone, but critical for understanding which attack vectors need to be patched.
Sigl reduces the manual effort needed to (1) detect malicious installations and (2) identify the malicious processes. We observe that once a malicious installation begins, a machine typically exhibits anomalous behavior (§ 3). Thus, Sigl can afford to collect high-fidelity (but short-term) provenance graphs, discarding old ones if no malicious installations are detected. Sigl analyzes provenance data using a novel form of unsupervised deep learning, which means that human analysts do not have to label training sets with both benign and malicious graphs. Instead, given a machine which is known to be malware-free, Sigl automatically featurizes provenance graphs using a novel component-based embedding technique tailored for system graphs (§ 4.3). It then applies long short-term memory networks (LSTMs) [64] to extract the graph features corresponding to normal behavior. These features do not rely on any particular malware; therefore, they are general and robust against malicious behavior. When deployed on in-the-wild machines, Sigl uses anomaly scores (§ 4.5) to calculate how far a machine deviates from the baseline features (and thus how likely it is that a machine is experiencing a malicious installation).
We evaluate Sigl by collecting baseline data from an enterprise database storing system events from 141 machines at NEC Labs America. Using malicious installers from the wild (as well as ones that we created ourselves), we tested Sigl’s ability to detect malicious installation activity. Sigl achieved precision, recall, accuracy, and F-score values all greater than 0.94; in contrast, competing systems that we tested were unable to achieve better than 0.9 on more than a single metric, producing substantially worse scores on the remaining metrics (§ 5.4). We also found that Sigl’s ranking system typically produces a small set of candidate processes responsible for the attack, including the one actually responsible (§ 5.5). To demonstrate the applicability and robustness of our approach, we further evaluate Sigl on different platforms (i.e., Windows and Linux) and with various adversarial scenarios (e.g., data contamination and evasion).
In summary, we make the following contributions:
-
•
We formalize the problem of detecting malicious software installation. In particular, we introduce a new kind of provenance graph, called a software installation graph, that records the short-term (but high-fidelity) provenance information needed to capture malicious installation activity.
-
•
We are the first to apply deep graph learning to the automatic detection of anomalies in software installation graphs (SIGs). Our approach uses a novel autoencoder architecture layered atop a long short-term memory network.
-
•
We present a novel node featurization model for system-level provenance entities that is generalizable to applications beyond our current project.
-
•
We build and thoroughly evaluate Sigl, an unsupervised detection system, that identifies malicious installations. Sigl creates SIGs using information provided by lightweight audit frameworks such as Windows ETW or Linux Audit. Thus, Sigl requires no additional infrastructure on end hosts, besides a daemon that collects audit data and sends it to a centralized analysis machine. Sigl outperforms current state-of-the-art malware detectors, while also providing the unique ability to identify the set of processes potentially involved in malicious installation activity.
- •
2 Background & Motivation
We simulate the following real-world enterprise attack scenario [53] to illustrate the limitations of existing tools and motivate Sigl’s design. Our scenario uses the Dharma ransomware, also known as CrySIS, which has become increasingly prevalent in enterprises [4]. One important factor that contributes to its popularity is its continuous evolution to avoid detection. We simulate a recent Dharma variant where the adversary bundles the ransomware tool with a benign anti-virus remover, ESET AV Remover, creating a new version of the software package. The attackers then launch a phishing attack, impersonating Microsoft, urging enterprise employees to upgrade their anti-virus tool. When an unsuspecting employee runs the installer, Dharma runs in the background, encrypting user files, while the employee interacts with the ESET AV Remover installer 111We evaluate Sigl in this scenario in § 5.. Neither existing malware detection tools nor newer log- or provenance-based analysis systems are a good match for these kinds of attacks because:
Limitations of Malware Detection Tools. The Dharma scenario poses several challenges to existing malware detection solutions. First, customized variants of Dharma will effectively evade signature-based malware analysis, including commercial anti-virus detection [48]. In fact, many variants of ransomware families, including Dharma, leverage popular installation frameworks (§ 5.1) to circumvent anti-virus detection without even changing the malware signature [16]. A recent incident demonstrates that, similar to our motivating scenario, malware can safely hide in those installation frameworks, bypassing all anti-virus products on VirusTotal [69]. Second, bundling malicious software with legitimate software thwarts conventional file reputation analysis [67, 73].
Downloader graph analysis [46] or malware distribution infrastructure analysis [8] might have proven effective in this instance if it were possible to notice the suspicious origin of the bundled installer. However, if the attackers infiltrated trusted software vendors to distribute the compromised software package [15] (e.g., the CCleaner incident), then, even those approaches would have been rendered ineffective [8].
In summary, these types of exploits can successfully evade detection from existing solutions.
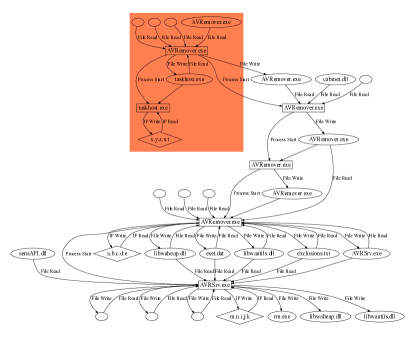
Limitations of Log and Provenance Analysis Solutions. Today’s enterprises are rich in commercial threat detection tools and log data; however, as we show in § 5.3, the log-based commercial TDS [61] deployed in our enterprise produces a large number of false positive alarms, because it is strict in matching predefined, single-event signatures (e.g., a process should not write to an unknown file). Newer research prototypes use provenance for intrusion detection [49, 28, 29, 63], which provides more contextual analysis, but these systems value time and space efficiency over fine-grain learning precision. As such, they tend to over-generalize statistical graph features with constrained graph exploration. For example, Fig. 1 depicts the graph structure surrounding the malicious process (taskhost.exe). Rectangles, ovals, and diamonds represent processes, files, and sockets, respectively; edges represent relationships between these objects. The shaded area represents the malicious activity that does not exist in normal ESET AV Remover installations. These malicious activities comprise only a small portion of the entire graph, essentially hiding among the greater number of normal events that take place during benign installation. Notice that the graph structure surrounding the malicious process (taskhost.exe) is similar to that around the benign AVRemover.exe, both of which start a new process and communicate with an outside IP address. Existing IDS cannot distinguish these similar structures, because those systems use localized graph analysis (e.g., 1-hop neighborhoods) that limits their ability to explore more distant relationships that provide a richer picture of host behavior. Thus, they produce a large number of false alarms. Even when the alarms are real, it is difficult to pinpoint the cause of an alarm, because existing systems summarize features, thereby losing details.
These existing systems make rational tradeoffs, because their goal is whole-system realtime detection over a long time period. Consequently, they must handle large and fast-growing provenance graphs. In contrast, Sigl focuses on the detection of malicious installation and thus requires a different set of trade-offs.
Sigl Insight. The key insight behind Sigl is that software installation is generally a well-defined, multi-staged process that can be represented as a bounded, static graph. The bounded nature of the graph means that we can analyze the graph in its entirety rather than having to summarize it. The multiple stages of installation suggest that we use models that are inherently temporal. Sigl learns both the structure and sequencing of installation without manual feature engineering.
3 Problem Formulation and Threat Model
We formalize the software installation malware detection problem as a graph-based outlier detection problem. Software installation begins when installer execution begins, e.g., the user double clicks on the downloaded package; it terminates when the installer process and all its descendants exit.
We characterize the installation behavior of a software package as a chain of system events leading to its binary files being written to a host system. We then define a software installation graph , an attributed directed acyclic graph (DAG), to represent this event chain. Nodes represent system subjects (i.e., processes) and objects (e.g., files, sockets), and edges record interactions between them. Given a number of benign installations on endpoint systems , our goal is to learn a model of the installation behavior that classifies a new installation graph as benign or malicious. Given an abnormal , we also want to rank process nodes to identify processes exhibiting the most anomalous behavior.
We assume that the attacker’s attempt to infiltrate an enterprise network through malicious software installation is the initial system breach. The attacker may distribute malicious installers using phishing emails, through legitimate software distribution channels (i.e., by compromising the integrity of such channels or acting as a man-in-the-middle), or by direct access to the network (i.e., an insider attack).
4 Sigl Framework
We begin with an overview of Sigl’s architecture and then present the technical details of each major component.
4.1 System Overview

Sigl uses abnormal system behavior to detect installation of malicious software. Its operation consists of three stages: data collection & featurization, model training & validation, and anomaly detection & prioritization. Fig. 2 illustrates Sigl’s architecture and workflow.
Data Collection & Featurization. For each software installation considered, Sigl gathers audit logs from a collection of machines in the enterprise and transforms each machine’s audit logs into a graphical representation called a software installation graph (SIG, § 4.2). It then divides the complete set of graphs () into training () and validation () sets, with approximately 80% in the training set and 20% in the validation set. Thus, represents a benign software installation graph for a particular install. Sigl then learns two node embedding models (§ 4.3) from .
Model Training & Validation. Given the features learned in , Sigl trains a deep graph learning model (§ 4.4), which is a deep autoencoder with a graph LSTM component as its encoder and a multilayer perceptron as its decoder. The autoencoder learns to reconstruct normal process nodes in from their latent representations encoded by the graph LSTM, minimizing reconstruction errors. Sigl then uses the validation data to verify the performance of the learned model and, using the reconstruction errors, determine the threshold for anomaly detection.
Anomaly Detection & Prioritization. Given a trained model and threshold (§ 4.5), Sigl takes audit logs from a new software installation, generates its corresponding SIG, embeds its nodes using the trained node embedding models, and uses the autoencoder model to reconstruct all process nodes. The resulting reconstruction losses are the anomaly scores for each node. If the overall anomaly score exceeds the threshold, Sigl classifies the installation as abnormal and reports a list, sorted by anomaly score, of the most suspicious processes. System administrators can analyze process behavior through the SIG, prioritizing the ones with the highest anomaly scores.
4.2 Software Installation Graphs
| Subject | Object | Event Relationship |
|---|---|---|
| process | process | start; end |
| file | rename; read; write; execute; delete | |
| socket | send; receive |
Similar to prior systems [23, 32], Sigl builds SIGs using common logging frameworks (e.g., Windows ETW and Linux Audit) based on standard provenance models [79]. Sigl transforms each audit log event into an edge, whose source represents the subject of the event (i.e., the entity responsible for creating the log record) and whose destination represents the object being acted upon (e.g., files, socket connections). The edge itself represents a dependency relationship between these entities. Table 1 shows the dependency relationships that we consider in our work.
Sigl produces the SIG by backtracking [44] from the installed software executable(s), represented as file node(s). Given a file node, Sigl adds all edges having that node as their destination. It then recursively repeats this procedure for each newly added node, backtracking to the download of the installation package. The resulting graph includes all processes involved in the installation as well as any e.g., dynamically linked libraries (DLL) that were executed. We apply an adjustable time bound on how far back we track generic system services (represented as process nodes) that are commonly invoked during software installation, thereby minimizing dependency explosion [47]. If the installation produced more than one installed executable, we combine the backtraces into a single SIG. As is done in existing provenance based analysis work [62, 63, 58], we produce acyclic SIGs by creating multiple node versions as the state of the corresponding subject/object changes [60].
4.3 Node Embedding for System Entities
Machine learning tasks depend on having a set of informative, discriminative, and independent features [25]. Node featurization is an important building block in graph learning.
Popular network representation learning frameworks, such as node2vec [25], DeepWalk [65], and metapath2vec [18], apply natural language processing (NLP) techniques, most notably word2vec [57], to derive latent embeddings that capture contextual information encoded in the networks. However, these approaches are not designed in the context of representing system entities; in particular, their node features do not encode relationships between system entities and their functionality within the system, which are important for downstream graph learning and anomaly detection.
A good embedding approach for system-level provenance nodes must satisfy two important properties. First, given a system entity that plays a particular role in a system, its embedding must be close to that of other entities if and only if their roles are similar. For example, both system DLLs c:\windows\system32\ntdll.dll and c:\windows\system32\kernel32.dll contain kernel functions. Their embeddings should be close to each other in the embedding space to facilitate downstream graph learning that captures behavioral similarity of processes loading and executing these two DLLs.
Second, the embedding approach must generalize to system entities not in the training dataset. Such entities are especially common in software installation, because the installation almost always introduces temporary files and processes that have semi-random path names. Mishandling such entities (e.g., assigning random embeddings) would cause downstream graph learning to produce excessive false positives for lack of meaningful features.
We satisfy both of these properties by featurizing SIG nodes in an embedding space such that node embeddings encode semantic meanings of the system entities they represent, while effectively leveraging the classic word2vec [57] learning model. To the best of our knowledge, we are the first to use a neural-network-based approach to meaningfully featurize system-level provenance nodes.
Node Embedding in Sigl. In NLP, word2vec embeds words into a low-dimensional continuous vector space, where words with similar context map closely together. Given a sequence of words, word2vec employs a skip-gram model whose objective is to maximize the log probability of predicting the context around a given target word. A fixed size sliding window on the text sequence determines the context. Assuming the likelihood of observing each context word is independent given the target word, word2vec maximizes: . is defined by a softmax function: where is the window size, and are the embeddings of the context word and the target word ; is the vocabulary size.
We apply word2vec as a basis for our embedding approach to featurize path names associated with SIG nodes. Each node in a SIG, whether file, process, or socket, corresponds to a file system path name. These path names encode important semantic relationships. Using the same example from earlier, c:\windows\system32\ntdll.dll and c:\windows\system32\kernel32.dll reside in the same directory, because they both contain kernel functions.
To map semantically related nodes close in the embedding space, we use a component-based node embedding model, where Sigl learns the embedding of each component of a path and then follows an additive method [35] to embed a node as the normalized summation of its path components. Sigl performs directed random walks of fixed length to construct the causal context for each node: Given a source node in the SIG, Sigl traverses the graph following the direction of the edges. If a node has more than one outgoing edge, Sigl randomly picks an edge to continue the walk. Let denote the node in the walk. The causal context for is , where is generated by the distribution: , where is the number of outgoing edges from . Sigl generates multiple causal contexts for each node.
Unlike existing embedding frameworks [25, 65, 18], our approach does not consider each node label as an atomic individual whose meaning can be derived only from neighboring nodes through random walks along the network; instead, each path component essentially becomes part of the context. If we treat the pathname as a single attribute, such context information is lost in the resulting embedding.
Embedding Unseen Nodes. The approach described so far produces embeddings for only those nodes that have been observed in the training graphs (). As mentioned above, software installation often creates temporary folders with meaningless base path names, sometimes containing machine-specific variations. In these cases, Sigl uses the à la carte embedding model [42], which follows the distributional hypothesis [30] to efficiently infer the embeddings for out-of-vocabulary (OOV) words via a linear transformation of additive context embedding (i.e., the average embeddings of context words). Given the contexts of a word in a vocabulary and assuming a fixed context window size , a linear transformation is learned through , where are existing high-quality word embeddings. After learning the matrix , any OOV word can be embedded in the same semantic space by . à la carte complements the component-based embedding approach, because it uses the same context-aware and additive mechanism. Thus, we produce meaningful embeddings using both random walks and pathname components. For example, given an unseen DLL c:\windows\system32\wow64.dll, our component-based approach allows à la carte to take into consideration its parent directories (which are the same as those learned for the ntdll.dll and kernel32.dll nodes), in addition to any random walks that pass through the node.
Sigl trains the à la carte model using and uses the trained model to featurize unseen nodes in the validation graphs and during live deployment.
4.4 Deep Graph Learning on SIGs
Sigl uses an autoencoder to learn a robust representation of the process nodes in a SIG for both anomaly detection and prioritization. The autoencoder consists of two parts: an encoder, for which we use a graph long short-term memory network (graph LSTM), and a decoder, for which we use a multilayer perceptron (MLP).
Graph LSTM. An LSTM [33] captures long-term dependencies of linear sequences. Originally developed for NLP tasks, LSTMs have been successfully adapted to a variety of sequence modeling and prediction tasks, such as program execution [87] and attack prediction [71]. The standard LSTM architecture learns sequential information propagation only; tree-structured LSTMs [75] and the more general graph LSTMs [64] are two natural extensions that incorporate richer network topologies. Graph LSTMs allow for flexible graph structures (e.g., DAGs) and consider distinct edge types. We refer interested readers to Peng et al. [64] for technical details.
Sigl’s Autoencoder. Intuitively, Sigl’s autoencoder models process nodes as a function of those nodes that came before them (temporally) in the SIG. The intuition underlying this encoder-decoder architecture is that anomalous nodes are inherently difficult to be represented accurately in the embedding space, so trying to reconstruct them produces much larger reconstruction losses. Sigl uses those losses to distinguish abnormal installations from normal ones (§ 4.5).
Although an alternative solution would be to use a binary classifier to determine if a SIG represents a normal installation or not, training such a classifier would require more labeled data (both normal and anomalous SIGs) than can easily be collected [5]. A set of SIGs dominated by normal installations produces class imbalance, and imbalanced two-class training often results in poor model performance [83]. Additionally, as an attacker’s modus operandi changes over time, keeping the trained classifier up-to-date becomes impractical [71]. Binary classification also provides no insight on the cause of the attack. A system administrator would have to manually compare a problematic SIG to one or more known good SIGs to identify potentially malicious processes.
Sigl’s autoencoder addresses limitations of binary classification through unsupervised one-class learning that requires only normal SIGs. It jointly trains the graph LSTM, as the encoder, with a MLP as the decoder. The encoder learns the hidden representation of each process node through the graph LSTM, taking into account the node’s attributes (i.e., feature embedding) and the hidden representations of all its source nodes (i.e., temporality) distinguished by the connection types (i.e., heterogeneity). The decoder then learns to reconstruct the original node embedding from the hidden representation (). The objective is to minimize the reconstruction loss in the training dataset , which consists of only normal SIGs (i.e., unsupervised learning).
4.5 Anomaly Detection
The autoencoder’s neural network architecture learns to reconstruct process nodes. Nodes that show significant topological difference from those encountered during training correspond to unexpected changes in installation behavior, which signals malware activity and will lead to large reconstruction errors. Sigl is a deviation-based anomaly detection system [3], in that it treats process nodes with high reconstruction loss as anomalies. By ranking process nodes in a SIG by their reconstruction losses (i.e., anomaly scores), Sigl helps system administrators prioritize analysis of anomalous nodes and quickly eliminate false alarms.
Sigl determines a normality threshold from the reconstruction losses observed during validation. We typically observe that a small number of process nodes (e.g., those with a large number of descendants) are inherently much more difficult to reconstruct than the rest of the process nodes in a SIG. These nodes have orders of magnitude higher reconstruction losses. If we arrange the losses in descending order, we observe “natural breaks” that partition nodes into ranges. The losses in the first range, i.e., the ones with the largest values, represent the “limits” of Sigl’s representational capability, thus providing us with a reasonable baseline to determine the threshold of normal software installation.
Sigl uses Jenks’ natural breaks [37], a statistical mapping method, to systematically discover class intervals of the natural breaks in the data series (i.e., reconstruction losses). Jenks’ natural breaks is an iterative optimization method that minimizes intra-class variance while maximizing inter-class variance by moving one value from the class with the largest deviations from the mean to the class with the lowest until the sum of the intra-class deviations reaches its minimum [38].
Using Jenks’ natural breaks, which separates reconstruction losses of a SIG’s process nodes into multiple “zones”, Sigl identifies the zone with the largest average loss for each validation graph and constructs a threshold list that contains those average losses for all the validation graphs. The normality threshold in our experiments (§ 5) is set to be three standard deviations above the average value of the threshold list. However, system administrators can easily adjust this threshold according to their needs (e.g., to optimize towards a low false positive/negative rate). Alg. 1 shows the pseudocode for setting the threshold. Given the normality threshold, Sigl considers any SIG exceeding this threshold as abnormal and provides system administrators with a list of its process nodes sorted by their anomaly scores.
5 Evaluation
| Software Installer | Version | Installation Framework | # T | # V | # BT | # M |
|---|---|---|---|---|---|---|
| FireFox ✽ | 18.1.0 | Mozilla Installer | 86 | 12 | 24 | 20 |
| FileZilla ✽ | 3.35.1 | Nullsoft Scriptable Install System | 88 | 12 | 24 | 40 |
| PWSafe | 3.48.0 | Nullsoft Scriptable Install System | 88 | 12 | 24 | 40 |
| MP3Gain | 1.2.5 | Nullsoft Scriptable Install System | 88 | 11 | 23 | 40 |
| ShotCut | 18.12.23 | Nullsoft Scriptable Install System | 85 | 12 | 24 | 40 |
| TeamViewer ✽ | 14.4.2669 | Nullsoft Scriptable Install System | 84 | 12 | 24 | 40 |
| Foobar | 1.4.6 | Nullsoft Scriptable Install System | 85 | 12 | 24 | 40 |
| 7Zip | 18.5.0 | SFX | 88 | 12 | 24 | 40 |
| TurboVNC | 2.1.2 | Inno Setup | 88 | 12 | 24 | 40 |
| WinMerge | 2.14.0 | Inno Setup | 85 | 11 | 23 | 40 |
| Launchy | 2.5 | Inno Setup | 151 | 21 | 42 | 40 |
| Skype ✽ | 8.50.0 | Inno Setup | 80 | 11 | 22 | 40 |
| WinRAR | 5.71.0 | SFX | 84 | 12 | 24 | 20 |
| DropBox ✽ | 79.4.143 | DropBox Installer | 84 | 11 | 23 | 20 |
| Slack ✽ | 4.0.1 | NuGet Package | 84 | 12 | 24 | 20 |
| Flash ✽ | 32.0.0.223 | Flash Installer | 84 | 12 | 24 | 20 |
| OneDrive ✽ | 19.103.527 | SFX | 84 | 12 | 24 | 20 |
| NotePad++ | 7.7.1 | NotePad Installer | 85 | 11 | 23 | 20 |
| ICBC Anti-Phishing | 1.0.8 | ICBC Installer | 85 | 11 | 23 | 20 |
| ESET AV Remover | 1.4.1 | ESET Installer | 75 | 10 | 21 | 20 |
We present a number of experiments to evaluate Sigl as a behavior-based malware detection system for secure software installation on enterprise end-point systems and an experimental testbed. We focus on the following research questions:
Q1. What is the performance of Sigl in detecting malicious software installation, and how does it compare to existing commercial TDS and other anomaly-based detection systems that leverage data provenance? (§ 5.3, § 5.4)
Q2. Can Sigl effectively guide cyber-analysts to quickly identify abnormal processes and potential malware? (§ 5.5)
Q4. How robust is Sigl against adversarial attackers? (§ 5.9)
Q5. Can Sigl generalize to a large variety of software packages and different platforms? (§ 5.12)
5.1 Datasets
We describe our methodology to collect audit data from benign and malware-infected software installations from all the workstations at NEC Labs America using Windows ETW. We also generated additional datasets on our Linux testbed using Linux Audit. All experiments related to the testbed are discussed in § 5.12, while other sections focus on real-world Windows logs from the enterprise.
Benign Data. We collected benign data from the enterprise event database where system administrators store and monitor company-wide system activity. We constructed software installation graphs (§ 4.2) for popular software in the enterprise. Software versions are consistent across different machines. Administrators carefully monitor installations to ensure their authenticity. We installed additional legitimate and popular software packages [20] to increase the size of our dataset. We also included benign versions of malicious installers found in the wild (Table 3). Table 2 shows the complete list of software installers used in our evaluation.
| Installer Name | Malware Signature (MD5) | Malware Type | Malware Family |
|---|---|---|---|
| TeamViewer | a2fd7c92f1fb8172095d8864471e622a | Win32/Agent | Trojan |
| TeamViewer | a538439e6406780b30d77219f86eb9fc | Win32/Skeeyah.A!rfn | Trojan |
| ESET AV Remover | d35fa59ce558fe08955ce0e807ce07d0 | Win32/Wadhrama.A!rsm | Ransomware |
| Flash | ab6cef787f061097cd73925d6663fcd7 | Win32/Banload | TrojanDownloader |
| Flash | 7092d2964964ec02188ecf9f07aefc88 | Win32/Rabased | HackTool |
| Flash | 5a9e6257062d8fd09bc1612cd995b797 | Win32/Offerbox | PUA |
| Malware Signature (MD5) | Malware Type | Malware Family |
|---|---|---|
| 03d7a5332fb1be79f189f94747a1720f | Win32/VBInject.AHB!bit | VirTool |
| 02c7c46140a30862a7f2f7e91fd976dd | Win32/VBInject.ACM!bit | VirTool |
| 1243e2d61686e7685d777fb4032f006a | Win32/CeeInject.ANO!bit | VirTool |
| 056a5a6d7e5aa9b6c021595f1d4a5cb0 | Win32/Prepscram | SoftwareBundler |
| 0f0b11f5e86117817b3cfa8b48ef2dcd | Win32/Prepscram | SoftwareBundler |
| c649ac255d97bd93eccbbfed3137fbb8 | Win32/Unwaders.C!ml | SoftwareBundler |
| 02a06ad99405cb3a5586bd79fbed30f7 | Win32/Fareit.AD!MTB | PasswordStealer |
| 1537083e437dde16eadd7abdf33e2751 | Win32/Fareit.AD!MTB | PasswordStealer |
| 01abfaac5005f421f38aeb81d109cff1 | Win32/Primarypass.A | PasswordStealer |
| c622e1a51a1621b28e0c77548235957b | Win32/Fareit!rfn | PasswordStealer |
| 04e8ce374c5f7f338bd4b0b851d0c056 | Win32/DownloadGuide | PUA |
| c62ced3cb11c6b4c92c7438098a5b315 | Win32/Puwaders.A!ml | PUA |
| 73717d5d401a832806f8e07919237702 | Win32/KuaiZip | PUA |
| 05339521a09cef5470d2a938186a68e7 | Win32/Adload | TrojanDownloader |
| 0e8cce9f5f2ca9c3e33810a2afbbb380 | Win32/Gandcrab.E!MTB | Ransomware |
| 0f030516266f9f0d731c2e06704aa5d3 | MSIL/Boilod.C!bit | HackTool |
| 0ed7544964d66dc0de3db3e364953346 | Win32/Emotet.A!sms | Trojan |
| c60947549042072745c954f185c5efd5 | Win32/Delpem.A | Trojan |
| 02346c8774c1cab9e3ab420a6f5c8424 | Win32/Occamy.C!MTB | Trojan |
| 0314a6da893cd0dcb20e3b46ba62d727 | Win32/Occamy.B!bit | Trojan |
Malware Data. We collected malware data from malicious installers discovered in the wild (Table 3). We also created more than 600 malicious installers by combining benign software installers in Table 2 with real malware from VirusShare.
Table 4 lists the malware samples we used in our evaluation. We randomly selected malware samples from a wide range of malware families that exhibit diverse behavior. For example, trojan attacks and ransomware typically communicate with a remote server, while malware of the PUA family downloads and installs potentially unwanted applications.
We investigated past real-world security incidents (e.g., [53, 54, 41]) that involve malicious installers as the entry point to high profile attacks and observed two general approaches to designing malicious installers:
Bundle malware with legitimate installers. The attackers create a “wrapper installer” that simultaneously runs an unmodified benign installer in the foreground and malware in the background. We bundle each legitimate installer with every malware sample in Table 4 to create malicious installers.
Embed malware in legitimate installers. The attackers modify an existing benign installer and embed malware in it. The installer executes the malware during installation. This approach requires us to decompile existing installers and recompile them with malware.
To construct representative malicious installers, we select software using three popular installation frameworks: Nullsoft Scriptable Install System (NSIS), Inno Setup, and SFX, and insert every malware sample in Table 4. Those frameworks are popular vehicles to spread malware [69, 16]; they are also widely used among popular software installers. Based on our survey of 1,237 Windows applications hosted on Softpedia, over 86% of the installers use these three frameworks.
5.2 Implementation & Experimental Setup
We implement Sigl’s data collection and graph generation module in Java 8 so that we can use the existing audit event server deployed in our enterprise, which provides APIs only in Java. Sigl’s core analytic algorithms, including node embedding, modeling, and anomaly detection, are implemented in Python 3.5 and PyTorch 1.1.0 with the CUDA 9.0 toolkit. We use the Gensim [68] library to generate node embeddings for training graphs and the Deep Graph Library (DGL) [1] to implement deep graph neural networks on top of PyTorch.
For all experiments, we partition the benign input data into a training set (70%), a validation set (10%), and a false positive test set (20%). Table 2 shows the number of software installation graphs used for training, validation, and testing.
We parameterize the node context for node embedding with window size 5, 10 random walks, each of length 10, and 128 dimensions. The same window size is used in à la carte. We use the skip-gram training algorithm with negative sampling [26] and run 20 epochs over the corpus.
Sigl performs unsupervised learning, so we need only benign installers for training. We train Sigl’s deep graph neural network on a system with a NVIDIA GTX 1080 Ti GPU with 12 GiB of memory. We train the model for 100 epochs with the training batch size set to 25, validate model performance after every epoch, and choose the model that produces the best performance on validation data.
5.3 Sigl Experimental Results
| Method | Precision | Recall | Accuracy | F-Score | FP Percentage |
|---|---|---|---|---|---|
| Sigl | 0.94 | 0.99 | 0.96 | 0.96 | 0.06 |
| Commercial TDS [61] | 0.07 | 0.59 | 0.90 | 0.12 | 0.93 |
| StreamSpot [49] | 0.97 | 0.52 | 0.72 | 0.68 | 0.03 |
| Frappuccino [28] | 0.95 | 0.12 | 0.51 | 0.21 | 0.05 |
| Software Installer | Precision | Recall | Accuracy | F-Score |
|---|---|---|---|---|
| FireFox | 0.78 | 0.70 | 0.77 | 0.74 |
| FileZilla | 0.98 | 1.0 | 0.98 | 0.99 |
| PWSafe | 0.98 | 1.0 | 0.98 | 0.99 |
| MP3Gain | 0.98 | 1.0 | 0.98 | 0.99 |
| ShotCut | 0.98 | 1.0 | 0.98 | 0.99 |
| TeamViewer | 0.87 | 1.0 | 0.91 | 0.93 |
| Foobar | 1.0 | 1.0 | 1.0 | 1.0 |
| 7Zip | 0.98 | 1.0 | 0.98 | 0.99 |
| TurboVNC | 0.95 | 1.0 | 0.97 | 0.98 |
| WinMerge | 0.98 | 1.0 | 0.98 | 0.99 |
| Launchy | 0.8 | 1.0 | 0.88 | 0.89 |
| Skype | 1.0 | 1.0 | 1.0 | 1.0 |
| WinRAR | 0.95 | 1.0 | 0.98 | 0.98 |
| DropBox | 0.91 | 1.0 | 0.95 | 0.95 |
| Slack | 0.91 | 1.0 | 0.95 | 0.95 |
| Flash | 1.0 | 1.0 | 1.0 | 1.0 |
| OneDrive | 0.74 | 1.0 | 0.84 | 0.85 |
| NotePad++ | 1.0 | 1.0 | 1.0 | 1.0 |
| ICBC Anti-Phishing | 0.95 | 1.0 | 0.98 | 0.98 |
| ESET AV Remover | 0.95 | 1.0 | 0.98 | 0.98 |
We evaluate Sigl’s detection performance on 625 malicious installers across a variety of software packages (Table 2). Table 5 shows that Sigl achieves over 90% precision, recall, accuracy, and F-score correctly identifying all malicious installers in the wild.
Sigl shares a common characteristic with many anomaly-based detection systems in that it produces more false positives (FPs) than false negatives (FNs), as reflected by its higher recall (99%) than precision (94%). However, precision and recall are well balanced, meaning that Sigl does not reduce the number of FPs by compromising its ability to detect actual malicious installers, as do other anomaly-based detection systems (§ 5.4).
Table 6 further details the experimental results for each installer. It shows that Sigl delivers consistent performance over a wide range of software exhibiting vastly different installation behaviors. We investigate two, FireFox and OneDrive, that have slightly lower precision and recall. We notice that the installation process of these applications sometimes includes software updates that are captured in SIGs. Sigl has difficulty generalizing both installation and update behavior from only a few instances of training graphs, resulting in lower performance than that of other applications.
5.4 Comparison Study
We compare Sigl to our in-house commercial TDS [61] and two provenance-based research anomaly detection systems, StreamSpot [50] and Frappuccino [28]. We do not compare Sigl to other commercial TDS, because they typically require intelligence service subscriptions and customized deployment from external vendors. Similarly, we exclude comparison to academic systems (such as Mastino [67] and Dropper Effect [46], see § 8) that leverage proprietary information from security vendors that is unavailable to us. Sigl enables an enterprise to detect threats using local, enterprise-wide information readily available to system administrators; additional protection from global services (e.g., Symantec) is complementary.
We conducted a preliminary experiment to show that our malicious installers (created using real malware in Table 4) can already significantly reduce the efficacy of commercial anti-virus tools, even without changing malware signatures. We upload the original malware samples (Table 4) to VirusTotal, which scans the samples and reports the number of anti-virus engines that detect them. On average, 80.8% of the engines detect the malware listed in Table 4; the lowest detection rate was 70.0%. Testing on our malicious installers, VirusTotal reports only 42.4% on average and the minimum detection rate of 10.8%. Therefore, we do not further compare Sigl to commercial anti-virus tools, because their limitations are well documented in the literature [67].
We briefly describe each evaluated system and discuss the results in the remainder of this section. Table 5 summarizes the overall results for all the systems in this study.
Commercial TDS. The commercial TDS [61] inspects every event between a process and a file and determines its potential to be a threat based on two factors: A) the familiarity of a file – if the TDS has some knowledge of the file in the past (based on the file name in the training data), then it is less likely to be malicious; B) the diversity of a process – if a process writes to many different files, then the write event itself is less likely to be malicious, even if the file is unfamiliar to the TDS.
Frappuccino. Frappuccino [28] detects program anomalies by analyzing whole-system provenance graphs [62]. It explores the graph’s local neighborhood structures using a vertex-centric label propagation algorithm to compare the similarity between two provenance graphs. Based on the assumption that normal behavior of a program produces similar provenance graphs when it runs on different host systems, it clusters normal provenance graphs of many running instances of the program as its model and detects abnormal program runs when their graphs cannot fit into any existing clusters. We compare Sigl to Frappuccino, because both systems make similar assumptions on the ability to distinguish abnormality from normalcy using provenance graphs.
StreamSpot. StreamSpot [49] detects host-system intrusions based on information flow graphs. Similar to Frappuccino, it leverages a clustering-based approach using a similarity function that compares two graphs based on their statistics. It represents each graph as a vector of local substructure frequencies and further approximates the vector using a similarity-preserving hashing scheme. The hashing scheme reduces the dimensionality of the vector while preserving discriminatory, principal features that better generalize the learned model. Since StreamSpot claims to detect any anomalies on the host system, we expect it to identify abnormal installation activity.
Experimental Results. Table 5 shows the overall results for all the baseline systems. For StreamSpot and Frappuccino, we use the same experimental setups as described in their respective papers or as implemented in their publicly available code repositories. We notice that StreamSpot’s original implementation analyzes only small local substructures in the graph. Such a constrained graph exploration tends to make graphs look overly similar to each other, thus resulting in high FNs and low true positives (TPs). We reimplement StreamSpot to analyze larger graph neighborhoods. We show the reimplementation results (i.e., better performance) in Table 5.
We see from Table 5 that Sigl significantly outperforms all baseline systems in terms of recall, accuracy, and F-score. It reported only 42 FPs among over 1,000 software installations in three months. On the contrary, the commercial TDS produces an overwhelmingly large number of FPs (9,240 events are considered potential threats during the experiment), resulting in exceedingly low precision 222The commercial TDS’s performance values are computed on a per-event basis, rather than a per-graph basis, because it has no notion of causality. To understand an alarm, however, system administrators typically resort to causal analysis, which requires them to inspect benign events in addition to the alarm-triggering event.. The commercial TDS results are consistent with a recent study that shows that many enterprises receive at least 300 alerts per day with more than 50% being FPs [21]. StreamSpot marginally outperforms Sigl in precision by only 3%, at the expense of a much lower recall (by 47%). A low recall is typically a product of low TPs and high FNs. Both StreamSpot and Frappuccino suffer from low recall because they have limited graph analytical capability. They use a vertex-centric approach to explore local graph neighborhoods, but such exploration ignores temporal relationships among those substructures and provides only limited views of graph evolution. As a result, they are unable to distinguish malicious installers from benign ones, producing few FPs (i.e., higher precision) but many FNs (i.e., lower recall). Although Sigl reports slightly more FPs, we show in § 5.5 that it provides auxiliary information that allows rapid inspection and dismissal of FPs, which is absent in both StreamSpot and Frappuccino. Reducing FPs from the hundreds per day of a typical commercial TDS [21] to fewer than one per day is a significant step at mitigating “alert fatigue” [32]. Existing techniques, such as whitelisting trusted processes during backtracking, can further reduce these FPs. The performance of our StreamSpot reimplementation demonstrates the importance of incorporating structural information in the analysis. StreamSpot outperformed Frappuccino, because Frappuccino is unable to retain just the relevant information; it overgeneralizes its model with “noise” in the dataset.
Sigl benefits from three important features of graph neural networks. First, they effectively filter noise. Sigl learns to capture relevant information during training, a data-oriented approach different from the hashing technique used in StreamSpot. Second, they preserve long-term memory. Sigl memorizes the sequential procedure of a software installation and uses this long-term memory to determine the legitimacy of a process during different stages of the installation. StreamSpot and Frappuccino consider only “bag-of-subgraphs” when analyzing provenance graphs. Third, they consider non-linear encoding of graph structures. Graph structures are contexts that help distinguish normal and abnormal process nodes. Sigl learns graph structure via its unique neural network architecture, while the commercial TDS isolates each event from its broader execution context.
5.5 Prioritizing Anomalous Processes
Many existing provenance-based detection systems [28, 49, 63] lack support for postmortem attack investigation, because their contextual analysis typically requires a holistic understanding of a large provenance (sub)graph. It is therefore difficult to pinpoint the exact nodes/edges responsible when a decision is made based on the entire (sub)graph. Others [32, 34, 58] instead focus on using data provenance to correlate alerts from simple edge-based detection systems (e.g., commercial TDS) to reduce false alarms and provide attack attribution. However, they depend on the underlying threat detection system to reliably report all possible threats, assuming a 100% detection rate [32]. Sigl conducts contextual graph analysis to maintain high detection accuracy. We show in Fig. 3 that it also assists attack attribution by accurately identifying anomalous processes within the graph.
We consider three levels of attribution that provide cyber-analysts with increasing degrees of guidance. We call the malware process (and its associated file) the target and the ranked list generated by Sigl based on processes’ anomaly scores the list. Note that Sigl assigns every process and its versions (§ 4.2) an anomaly score. If Sigl identifies a process among the top 10 in the list that is fewer than 3 hops away from the target (Fig. 3, checks), we consider Sigl successfully having provided basic guidance. If the process is ranked among the top 5 and is less than or equal to 3 hops away (Fig. 3, stripes), Sigl has provided improved guidance. Finally, if Sigl identifies the target among the top 5 in the list or the target is only 1 hop away from a top-5 process (Fig. 3, solid), we say that Sigl offered targeted guidance. These three levels of guidance are based on typical behavior of system administrators, trying to understand the sequence of steps that produced an attack [44], and the value (e.g., time savings) that Sigl brings to the human analysts.
Fig. 3 shows that Sigl is able to provide at least basic guidance to identify almost all malicious processes or files for all software installers in the experiment. In fact, it provides targeted guidance for at least 10% of malicious installers in all cases and more than 50% of them in the majority (75%) of the cases. We investigate two specific examples, Foobar and OneDrive, as they have distinctive results. Sigl has difficulty providing effective guidance for about half of the malicious Foobar installers. We inspected the SIGs of those installers manually and discovered that Sigl identifies many versions of a process that originally connects to the malware file as the most anomalous. It is likely that anomaly scores “accumulate” as later versions of the process are being analyzed. Concrete investigation of how provenance graph versioning affects graph analysis is left for future work.
Sigl is not able to provide targeted guidance for OneDrive, because OneDrive frequently identifies the update processes in the SIG as among the most anomalous. As mentioned in § 5.3, a small number of OneDrive training SIGs include both installation and update processes. Sigl cannot accurately learn update behavior from only a small number of samples and therefore incurs high reconstruction losses for those processes. The same situation is less severe in FireFox, because the update process occurs more frequently in its training data. However, it does result in lower recall (Table 6) as the FireFox model attempts to generalize both behaviors using a small number of training samples.
Overall, Sigl can effectively guide cyber-analysts to quickly identify abnormal processes and potential malware. Neither StreamSpot nor Frappuccino provides any guidance.
5.6 Using Sigl in an Enterprise
In an enterprise environment, system administrators configure workstations to include a standard set of installations. When there is a new software release, the installed software needs to be updated. This can lead to a supply-chain-attack scenario, where the attacker exploits a vulnerability in the new release by compromising the software distribution channel, so no legitimate version of the new release is available. Therefore, we investigate how well Sigl models generalize across versions, given that administrators’ only defense is the model from the previous version of the software installation.
Experimental Setup. We installed an adjacent version of the software listed in Table 2. In some cases, our modeled software was already the latest release (at the time of writing); in those cases, we installed its previous version instead. To create malicious installers, we bundle each software installer with a random malware in Table 4. Table 7 lists the versions of the software we use in this experiment. Note that ICBC Anti-Phishing has only one version.
| Software Installer | Modeled Version | Test Version | False Alarm | True Alarm | Guidance |
|---|---|---|---|---|---|
| FireFox | 18.1.0 | 19.0.1 | ✗ | ✓ | |
| FileZilla | 3.35.1 | 3.34.0 | ✗ | ✓ | |
| PWSafe | 3.48.0 | 3.49.0 | ✗ | ✓ | |
| MP3Gain | 1.2.5 | 1.2.4 | ✗ | ✓ | |
| ShotCut | 18.12.23 | 18.12.25 | ✗ | ✓ | |
| TeamViewer | 14.4.2669 | 14.5.1691 | ✗ | ✓ | |
| Foobar | 1.4.6 | 1.5 | ✗ | ✓ | |
| 7Zip | 18.5.0 | 19.0.0 | ✗ | ✓ | |
| TurboVNC | 2.1.2 | 2.2.2 | ✗ | ✓ | |
| WinMerge | 2.14.0 | 2.13.22 | ✓ | ✓ | |
| Launchy | 2.5 | 2.6 | ✗ | ✓ | |
| Skype | 8.50.0 | 8.51.0 | ✗ | ✓ | |
| WinRAR | 5.71.0 | 5.61.0 | ✗ | ✓ | |
| DropBox | 79.4.143 | 69.4.102 | ✓ | ✓ | |
| Slack | 4.0.1 | 4.0.2 | ✗ | ✓ | |
| Flash | 32.0.0.223 | 32.0.0.238 | ✗ | ✓ | |
| OneDrive | 19.103.527 | 19.086.502 | ✓ | ✓ | |
| NotePad++ | 7.7.1 | 7.7.0 | ✗ | ✓ | |
| ICBC Anti-Phishing | 1.0.8 | N/A | N/A | N/A | N/A |
| ESET AV Remover | 1.4.1 | 1.3.2 | ✗ | ✓ |
Experimental Results. Table 7 shows the results for each installer modeled in § 5.3. We run only one benign and one malicious instance against each model. If Sigl considers a benign installer abnormal, we put a check mark (✓) in the False Alarm column in Table 7; we check the True Alarm column if Sigl correctly detects a malicious installer. We see in Table 7 that Sigl continues to maintain high precision and recall across versions. Among the 19 benign installers, Sigl correctly classifies 16 of them (84%) without raising a false positive alarm. False alerts in our experiments are caused by significant changes in graph structures (corresponding to changes in installation behavior) and node identities (corresponding to changes in files installed) between two versions. For example, Dropbox’s installation behavior changed across the two versions. We observe that the older version of the Dropbox installer frequently reads from and executes a temporary file during the installation process. This behavior creates a large subgraph in the SIG between the file and the process that is absent in the training dataset. We quickly identify this difference following the guidance provided by Sigl. In § 7, we further discuss this issue regarding software evolution. In terms of true alerts, Sigl detects all malicious installers with the majority (74%) having targeted guidance.
5.7 Sensitivity Analysis
Anomaly-based detection systems [11] typically require setting threshold values representing how much of a deviation from normality constitutes an anomaly. Thresholds determine the tradeoffs between precision and recall. Detection systems that are overly sensitive to threshold settings are difficult to use in practice, even if there exists an optimal threshold that performs perfect detection.
Sigl quantifies a normality threshold from the validation dataset based on the anomaly scores of individual nodes in the graph (§ 4.5). We demonstrate in Fig. 4 that the anomaly scores of benign and malicious graphs are well-separated with considerable margins such that Sigl’s detection performance generally does not depend on finding a precise threshold.
Fig. 4 shows the average (circled mark), minimum, and maximum (two ends of the error bar) anomaly scores for benign (blue) and malicious (red) installers for each experiment. None of the installs have overlapping benign and malicious ranges, although the precise break between the ranges is, in fact, installer specific. However, many of the benign installers have scores orders of magnitude smaller than those of the malicious installers. For example, compared to the malicious NotePad++ installer with the smallest anomaly score (Fig. 4), even the benign installer with the largest score has a value two orders of magnitude smaller. Such liberal margins not only make it practical to set anomaly thresholds but also indicate the likelihood of an installer being benign/malicious.
5.8 Robustness Against Data Contamination
So far, we have assumed that anomaly-free data is available for training, but this assumption does not hold in most real-life scenarios. On the contrary, real-world data often contains noise or undetected anomalies (i.e., contaminations) that potentially affect detection performance [7]. Hence, a fully unsupervised learning system requires a certain degree of robustness that minimizes the need for weak labeling of benign data [43]. We evaluate the effects of anomaly contaminations in the training set for each software installer in Table 2.
Experimental Setup. We contaminated 5%, 10%, 15%, 20%, and 25% of the original training set with malware data from the test set and rebuilt the model for each level of contamination. Malware data used for training is also included in the test set to evaluate Sigl’s robustness against anomaly data pollution. We use the Area Under the Receiver Operating Characteristics (ROC) curve, or AUC, to compare anomaly detection results for each installer (Fig. 5). AUC, ranging between 0 and 1, measures the quality of model prediction regardless of classification threshold.
Experimental Results. Fig. 5 shows that in general, Sigl is tolerant to contamination in training data. In the majority of cases, the AUC stays above 0.90, even when contamination is severe (e.g., 25%). We notice that applications with lower performance in § 5.3 (e.g., FireFox) are more likely to be affected by contamination, as their benign installation behavior is already difficult to learn even with clean training data.
5.9 Robustness Against Adversarial Attacks
With the growing popularity of graph-based classification methods in security applications, adversarial attacks on graph data are likely to become increasingly common for an attacker to evade those methods [80]. However, there exist only a few studies [17, 88, 80, 89] on this topic, with the majority focusing on citation networks (e.g., Cora [51], Citeseer [9]) and social networks (e.g., Facebook, Twitter [81]), and designed only for a particular type of graph neural networks (e.g., GCN [89]).
To demonstrate Sigl’s robustness against adversarial attacks, we investigate two realistic attack scenarios from a practical, systems perspective. Different from prior approaches that focus on network graph attacks, our scenarios require a distinct set of attacker behavior (and thus resulting graph perturbations), constrained by the threat model (§ 3), our neural network architecture and classification method, but more importantly, the feasibility of system manipulations.
Background. We consider the restrict black-box attack (RBA) and practical black-box attack (PBA) adversarial settings [17] 333We do not consider the white-box attack (WBA) setting in which the attacker can access any model information, including model parameters and gradient information, since such accessibility is rarely possible in real-life situations [12].. In RBA, the attacker must perform adversarial graph modifications without any knowledge of our model, given only sampled benign and attack graphs. The PBA scenario relaxes the restrictions on model knowledge by disclosing discrete prediction feedback from the target classifier (but not any other information e.g., the normality threshold). Our threat model assumes the integrity of data provenance, so the attacker cannot directly modify SIGs. They can manipulate graph structures (i.e., structure attack) and node feature vectors (i.e., feature attack) only by manipulating software installation process, while ensuring successful malware execution.
We follow state-of-the-art graph-based adversarial machine learning literature [80, 88] to generate adversarial attack graphs by 1) adding or removing edges, and 2) modifying node attributes on the malicious graphs in Table 2. As discussed in detail below, we also define an equivalency indicator [17] for each attack setting to restrict graph perturbations that are realistically available to the attacker (e.g., the attacker cannot add a directed edge between two file nodes).
Experimental Setup (RBA). We define the equivalency indicator as any allowed graph modifications on nodes/edges related to the malicious processes. The attacker can easily identify those graph components given both benign and attack graphs. Without any additional information, the attacker is empirically better off to focus on malicious process nodes that typically receive high anomaly scores and influence graph classification (§ 4.5). Conceptually, this is equivalent to adversarial attacks in node classification problems, where malicious process nodes are the attacker’s target nodes. Prior studies have demonstrated that manipulations on target nodes result in significantly more adversarial damage [88, 12].
One strategy is to disguise malicious processes to mimic the benign ones. We design a feature attack, a structure attack, and a combination of both. In the feature attack, we modify the malicious process’ node attributes to be the same as those of the benign ones, effectively aligning feature vectors of both malicious and benign nodes (§ 4.3). In the structure attack, we ensure that the malicious processes read/write the same number of files/sockets and fork the same number of child processes, so that their local structures approximate those of the benign processes. In the combination of both attacks, we further make sure that feature vectors of files/sockets/processes related to the malicious processes are similar to those related to the benign processes (e.g., by manipulating file node attributes). We evaluate the effects of all attack vectors for each software installer in Table 2.
Experimental Results (RBA). Fig. 6 shows the results for only those software installers affected by at least one attack vector. AUCs of the other installers in Table 2 remain unchanged. We see that the efficacy of the feature and structure attack in isolation is installer independent: while TeamViewer and Slack are slightly more vulnerable to the structure attack, the rest are more affected by the feature attack. Combining both feature and structure attacks improves attack performance, but overall, Sigl is robust to adversarial attack in this scenario. Sigl’s use of deep graph learning means that changes in one part of the graph can have far-reaching consequences. Manipulating anomalous process nodes does not remove all the effects of such nodes; the benign nodes to which they connect are also affected by their originally malicious behavior [88]. The attackers could strengthen RBA if they can also accurately identify target nodes that are not malicious but have been influenced by the malicious processes, but such information is not available in this setting.
Experimental Setup (PBA). PBA allows the attacker to obtain prediction feedback from the classifier, so the attacker can iteratively add/remove edges or modify node features in the graph, until the resulting graph produces a false negative from Sigl’s model. We will generate such a PBA attack using reinforcement learning (RL). Our goal is to build an RL-model that takes as input a SIG produced by an existing malware package and produces, as output, a SIG that Sigl improperly classifies as benign. We constrain the changes that the RL-model can make on the graph to structural changes that can be produced according to the criteria discussed in the previous section (i.e., that the attackers can produce manipulated graphs only by changing their attack implementation), and define the equivalency indicator as the minimal number of such modifications within a fixed budget [88]. We adopt a hierarchical reinforcement learning (RL) based attack method through Q-learning to learn a generalizable attack policy over graph structure [17]. We build our RL-model using a subset of the malware of a single application (we randomly chose 5% of the Skype malware installations) and then evaluate the model using the full suite of malware from Table 2.
Experimental Results (PBA). The adversarial attacker tries to increase the false negative rate (FNR) of the attack graphs, but we observe no such changes for Skype nor for the majority of the other installers in Table 2. The two exceptions are TeamViewer and FireFox; TeamViewer exhibits more FNs for one attack graph, and FireFox exhibits fewer FNs for one attack graph. When applying the adversarial model trained on the Skype dataset to other installers, its performance varies depending on the installer. In fact, its efficacy fluctuates even within the Skype dataset itself where the target model is known to the attacker. We investigate the changes in anomaly scores of Skype’s attack graphs under the adversarial influence. Fig. 7 shows that even the best possible manipulation (predicted by the trained RL model) does not necessarily reduce an attack graph’s anomaly score. Our results differ significantly from prior work demonstrating the efficacy of adversarial attacks on graphs (e.g., [17]). This prior work demonstrated efficacy on graphs from citation and social networks. We hypothesize that adversarial attacks are less effective in our setting, because 1) provenance graphs are structurally different from these network graphs, and 2) our setting allows a more constrained set of changes to the graph.
5.10 Building Sigl Meta-Model
Sigl is designed to build one model per application, but it can easily build a “meta-model” that learns generic software installation behavior. Intuitively, such a generalized model can classify unseen installers, thus saving considerable manual labor from training new application-specific models. On the other hand, it must perform comparably to those models to warrant its usability for the installers in the training dataset.
Experimental Setup. We trained a meta-model using the training sets from all but the Skype installer (selected randomly). We then evaluated the meta-model using both the benign and malicious datasets from each application, including Skype. This experimental setup is identical to the one described in § 5.2 to fairly compare against application-specific models. We repeated this experiment by randomly excluding different installers; the results are similar.
We further investigated meta-model performance when trained with various numbers of applications. We excluded 5%, 10%, 20%, and 40% of the original applications from the training set and rebuilt the meta-model for each scenario. We evaluated each meta-model with two sets of test data, 1) the benign and malicious test sets from the applications used in training (INC in Fig. 9), and 2) the benign and malicious test sets from the excluded applications (EXC).
Experimental Results. Fig. 8 shows the AUC results for all the installers. For half of the installers, the AUC is unchanged; even for the other half, it decreases marginally. Most installers achieve over 0.9 AUC under the meta-model. Although the model is never trained on the Skype dataset, it is able to accurately separate its benign and malicious instances. This result implies that commonalities exist in legitimate software installations, and Sigl learns these shared characteristics. Surprisingly, we also see AUC improvement for TeamViewer and WinMerge, which is likely the result of model generalizability. Fig. 9 shows the AUC results for meta-models trained with different percentages of applications. When the meta-model learns from a smaller set of applications, it inevitably faces more challenges generalizing to unseen software, but works better on the trained ones. Since the performance gracefully degrades with an increasing number of new applications, Sigl provides abundant opportunities for system administrators to retrain the meta-model ( § 7).
5.11 Runtime Performance
Sigl takes, on average, fewer than 90 minutes (on a single GPU on our local test machine) to train a model for a particular software. Training for different installations can be performed in parallel and/or distributed to the cloud. Table 2 shows the number of installation graphs we used for training. We train only on the graphs available in our current database; Sigl can be effective even across versions (§ 5.6) and on unseen software (§ 5.10). Sigl supports incremental learning to efficiently train on new graph samples. With Sigl’s guidance (§ 5.5), system administrators can easily decide to further improve a model if top-ranked processes are not malicious. Once trained, Sigl takes less than second to evaluate a SIG.
5.12 Sigl in Linux
We see in § 5.10 that Sigl can build generic, application-agnostic models that detect abnormal installation behavior on Windows. In this section, we further demonstrate that Sigl is generalizable to an even larger variety of software packages and on different platforms. Since our enterprise monitoring system collects only Windows audit data, we set up our own Linux testbed and generated a dataset of 2,885 Python package installation graphs.
Experimental Setup. We trained Sigl on 1,708 benign installation graphs, each of which was collected using Linux Audit from installing different Python packages including popular tools [78] such as urlib3, and six. After training such a meta-model on all 1,708 packages, we design our experiments to focus on two research questions:
Q1. Given that Sigl is trained on a large number of distinct software packages, is it able to generalize to new benign packages and maintain a low false positive rate (FPR)? We are particularly concerned with FPs, because anomaly-based systems are generally more likely to produce excessive FPs that overwhelm cyberanalysts, especially when they are trained on diverse datasets. We tested the model on 1,176 installation graphs of benign packages unknown to the model.
Q2. Can Sigl accurately detect malicious software packages and provide targeted guidance? We used a real-world malicious Python package python3-dateutil that was uploaded to PyPI in 2019. The benign version of the same package is a popular utility tool that extends Python’s standard datetime module. We note that the attack does not create any malicious binary files on the victim system. Instead, it executes obfuscated malicious code in the package that transmits sensitive user information to a remote host.
Experimental Results (Q1). Among 1,176 benign test graphs, Sigl reports 29 FPs, resulting in only 2.47% FPR. This further corroborates our experimental results in § 5.10 that Sigl is capable of learning from a diverse set of training data to model generic installation behavior.
Experimental Results (Q2). Sigl correctly detects the malicious Python package. It indicates the process making a network connection to a Bitly URL as the most abnormal, thus providing accurate attack attribution.
Overall, Sigl is effective in modeling diverse installation behaviors from a large variety of software packages on different OS platforms and installation frameworks.
6 Case Studies
We describe two case studies illustrating Sigl using different real-world malicious installers in Table 3.
Malware Bundled with ESET AV Remover Installer. In § 2, we described a real-world attack scenario where the user is phished to install a legitimate ESET AV Remover installer [55] bundled with malware. Fig. 1 shows a simplified software installation graph from this scenario. When the malware (taskhost.exe in the shaded area in Fig. 1) runs during benign software installation (AVRemover.exe), it establishes a communication channel (x.y.z.s:t) with the attacker, which allows the attacker to perform further damage (e.g., exfiltrate sensitive information). Note that the user is unaware of this activity since she is distracted interacting with the benign ESET AV Remover installer.
We discuss in § 2 how existing tools might fail to detect malicious activities from such an installation. Sigl, on the other hand, constructs a SIG from the audit data, and tests the graph against the existing ESET AV Remover model. Sigl generates a threat alert for this graph because its anomaly score is much larger than the set threshold and orders of magnitude greater than those of the training graphs. Sigl also ranks the AVRemover.exe process node in the shaded area in Fig. 1 among the most anomalous processes (i.e., targeted guidance). We observe that AVRemover.exe is considered more anomalous than the malware process taskhost.exe, probably because it is uncommon for the installer process to spawn two child processes at the beginning of the installation. Sigl ranks the malware process taskhost.exe lower because structurally, it resembles benign process behavior that also communicates with outside IP addresses. However, system administrators can easily identify the malicious process through quick one-hop backtracking starting from the top-ranked AVRemover.exe process. Compared to the entire SIG, Sigl reduces the number of events that the administrator needs to inspect by two orders of magnitude.

Malware Embedded within Flash Installer. Different from the malicious ESET AV Remover installer, the malicious Flash installer embeds a dropper and a potentially unwanted application (PUA). The dropper (downloader.exe) communicates with outside channels and downloads additional malware (e.g., yandexsetup.exe). The installer also installs anti-virus software (AvastAntiVirusSetup.exe) without user consent. Fig. 10 shows a simplified software installation graph.
Sigl identifies FlashPlayer.tmp (red) as the most anomalous process (i.e., targeted guidance) and downloader.exe (yellow) in the top 10. The additional processes started by the installation process (FlashPlayer.tmp) and their progeny subgraphs possibly lead to its high anomaly score. The PUA, the dropper, and the malware it drops all behave differently from the benign Flash installer. Sigl ranks the dropper process and all the malware processes (not shown in Fig. 10 for clarity) above the PUA process, because the PUA process behaves in a manner closer to that of the real installation process (FlashPlayerInstaller.exe) than do the other malicious processes. We can see from Fig. 10 that their substructures resemble each other. Regardless, given the dropper process, administrators already have sufficient information to confirm the malicious nature of the installation.
7 Discussion & Limitations
Sigl’s ML model shares characteristics common to other statistical models [76]; model performance improves with more training data. As we see in § 5.3 and § 5.4, Sigl achieves good detection performance with only a small number of benign installation graphs for training because of the specificity of the domain, which enables Sigl to quickly learn representative behavior patterns. Other deep-learning-based detection systems, e.g., DeepLog [19] and Tiresias [71], also enjoy the same advantage as they target specific areas in the security domain. For example, DeepLog mines log data in regulated environments such as Hadoop and thus can learn normal application behavior from a small fraction of normal log entries.
Regardless of training data size, one important key to Sigl’s success, and of any modeling-based system, is data quality. We see in § 5.3 that when data quality deteriorates, it adversely affects system performance. However, Sigl can significantly outperform its peer systems, even with fairly limited training data. We attribute its efficacy to the fact that Sigl learns on the entire graph, not a summary of it. This makes Sigl desirable in an enterprise environment where the only training data available have been generated internally or in which the third party tools that collect the data might lose data, e.g., due to small buffers or slow ingestion rates [56].
Software Evolution. We see that Sigl delivers consistent performance across software versions (§ 5.6) and builds application-agnostic models with a diverse training dataset (§ 5.10, § 5.12). It can also learn deltas of software versions, by modeling past versions of software, which we leave for future work. However, as software continues to evolve and additional software packages are installed, Sigl may eventually require retraining on the SIGs of new installers. We lessen such burdens in several ways: 1) Sigl maintains a good margin between anomaly scores of benign and malicious installers (§ 5.7). System administrators can easily position an installer’s anomaly score among those used in training and determine whether retraining is necessary. For example, the benign NotePad++ installer with the highest anomaly score () is, in fact, the older version, while the training instances used to model the newer version have much lower scores (between and ). Admins might want to consider retraining if they want all benign instances to have anomaly scores . 2) Sigl provides effective guidance (§ 5.5) to help analysts identify alert causes and dismiss false positives. 3) Sigl’s performance degrades slowly (§ 5.10). 4) Sigl’s retraining is fast (§ 5.11).
Evasion. Stealthy malware might leverage process injection techniques (e.g., DLL injection [14]) to inject malicious code into a legitimate live process. If SIG did not capture the causality relationship between the malware and the legitimate process as a result of the injection, the attacker could evade detection. This may be the case given that our current prototype monitors only a subset of system events, but state-of-the-art provenance-capture systems [62] are capable of tracking memory-related events between processes, which would allow Sigl to include affected legitimate processes into analysis. We leave as future work to show that such evasion is a mere artifact of our prototype, not the approach.
Attackers might use software installation to deposit malicious software on a system but delay exploiting that software. As Sigl is optimized for detecting malicious installations, such a deployment might go unnoticed: Sigl might notice that an extra piece of software appeared, but if that software is not executed during the installation process, Sigl might not flag its existence as an anomaly. One possible solution is to leverage forward tracking [45] to obtain a broader view of system behavior to detect such time-dispersed anomalies. Prior work [58] has shown that data provenance facilitates such analysis by closely connecting causal events, even if they are temporally distant. This makes it manageable to incorporate forward tracking into Sigl. Interesting future work would quantify the amount of tracking necessary for detection.
Benign Dataset. Many enterprises tightly control software installation via centralized IT departments. Best practices for deploying new software are to test initially on a limited set of canary machines to detect stability or compatibility issues; those machines are a natural source of labeled installation data. Our IT department at NEC Labs America also places remote telemetry facilities on end-user machines, collecting data using enterprise-wide security monitoring solutions. Although we cannot guarantee the collected data is perfectly clean; in practice, our evaluation in § 5.8 demonstrates that Sigl is robust against potential data contamination.
Adversarial Robustness. We evaluated two realistic adversarial scenarios in § 5.9, considering systems constraints that are absent in existing ML literature. We show that Sigl is robust against practical adversarial attacks, which is consistent with recent studies [17, 88] showing that effectively attacking graph structured data is hard. Granted, our evaluation is by no means complete given increasing interests in ML to advance graph-based adversarial attacks. For example, Chang et al. [12] recently proposed a graph signal-processing-based approach to attack the graph filter of given models, nullifying the need for any model information. Dai et al. [17] proposed a genetic-algorithm-based attack in PBA (although it requires additional information, e.g., a normality threshold). However, these approaches are evaluated on the same citation network datasets, which are structurally different from provenance graphs (§ 5.9). Further technical discussion and evaluation of adversarial ML is beyond the scope of this paper.
8 Related Work
Traditional approaches to securing software installations emphasize authentication [6] (e.g., code signing [70] and secure content distribution [59]), policy-guided sandboxing [84], and information flow control (IFC) [74]. Recent incidents [24, 77] show that attackers can compromise legitimate software distribution channels, bypassing cryptographic authentication protection. Meanwhile, in an enterprise environment, sandboxing becomes impractical and is routinely bypassed through social engineering and advanced exploit techniques [34]; sophisticated policy-driven IFC is still too complex to be widely adopted [82]. Sigl leverages audit data easily collectable from enterprise workstations. Its core design lies at the intersection of graph-based malware detection and provenance-based intrusion detection. We place Sigl in the context of prior work in these areas.
Graph-Based Malware Detection. Panorama [86] uses taint graphs to detect privacy-breaching malware. It analyzes information access and processing behavior of software to identify violations of policies that indicate suspicious behavior traits. Panorama generalizes signature-based malware detection to a behavior problem like Sigl does, but ultimately requires a “behavior-signature” that limits its detection scope.
Polonium [13] and Marmite [73] detect malware through large-scale graph mining on a machine-file graph. They compute file reputation scores and identify malware as files with low reputation. Mastino [67] improves upon Polonium and introduces additional URL nodes to graph analysis, training classifiers for URLs and files. These approaches require network- and system-level data from machines across the Internet, which is unattainable in a typical enterprise. They consider relationships between users (e.g., machines) and files only, assuming that malicious files appear on few machines and on machines with low reputation. Such assumptions however, are no longer valid as recent supply chain attacks leverage legitimate channels to distribute malware to a large number of victim machines. Kwon et al. [46] proposed a downloader-graph abstraction that describes relationships between downloaders and payloads on 5 million end-point workstations. Using hand-crafted graph features as strong indicators of malicious activity, the authors constructed a random forest model for malware detection. The approach however, requires a large amount of data (e.g., features from about 24 million distinct files) to achieve high accuracy and any changes in malware delivery mechanisms that affect those cherry-picked features are likely to invalidate the model.
Many other graph-based malware detection approaches exist, with the majority focusing on characterizing malware delivery networks [72, 36]. We omit discussions of those approaches since Sigl targets local end-point protection without knowledge of global malware networks. Sigl does not rely on extracting indicators that signify typical cybercriminal operations, but learns to generalize expected behavior of a particular enterprise given easily-accessible audit information. Nevertheless, a security-aware enterprise should leverage both global and local information, complementing Sigl with existing global malware network analytic tools.
Provenance-Based Intrusion Detection. Frappuccino [28] analyzes system-level provenance graphs to model the behavior of Platform-as-a-Service applications. It uses a dynamic sliding window algorithm to continuously monitor and check if application instances conform to the learned model. StreamSpot [49] uses a similar analytic framework. Both systems featurize provenance graphs using a bag-of-subtrees approach and apply clustering algorithms to identify outlier graphs. Compared to Sigl’s graph LSTM architecture, learning graphs using bag-of-subtrees is insufficient to capture the semantics of system evolution represented in provenance graphs, due to its insensitivity to the event order. This limitation (i.e., order-insensitivity) is well-understood in NLP [75] and equally applicable in our domain. Clustering bag-of-subtrees is a reasonable step to perform outlier detection, but it burdens cyberanalysts with labor-intensive investigation, because even a single outlier often entails investigating a large provenance (sub)graph. Sigl lessens such a burden by triaging abnormal process nodes within the graph.
Recently, Han et al. [27] designed a realtime anomaly detection system that analyzes streaming provenance graphs generated from system activity. It learns a dynamic execution model as the host system evolves, thus capturing behavioral changes in the model. This learning approach makes it suitable for detecting long-running persistent threats. Gao et al. [22] designed a domain-specific query language, SAQL, to analyze large-scale provenance data and use various anomaly models to detect intrusions. To our best knowledge, Sigl is the first provenance-based anomaly detection system that secures software installations without prior attack knowledge.
9 Conclusion
We present Sigl, a malware detection system that secures software installation by analyzing the behavior of end-point systems through software installation graphs. Sigl uses a novel deep graph learning architecture to understand installation behavior and assist attack attribution. Our evaluation results show that Sigl achieves high detection performance using only a small amount of training data, while accurately guiding human analysts to identify the cause of alarms. Sigl is therefore a practical tool that can be deployed in any enterprise for effective and labor-saving malware detection.
Acknowledgments
We thank the anonymous reviewers and our shepherd Konrad Rieck who helped improve the paper. This research was supported in part by the US National Science Foundation under grant NSF 14-50277. We acknowledge the support of the Natural Sciences and Engineering Research Council of Canada (NSERC). Cette recherche a été financée par le Conseil de recherches en sciences naturelles et en génie du Canada (CRSNG). The views, opinions, and/or findings contained in this paper are those of the authors and should not be interpreted as representing the official views or policies, either expressed or implied, of the sponsors.
References
- [1] Deep graph library. https://www.dgl.ai.
- [2] Internet security threat report, 2019. https://www.symantec.com/security-center/threat-report?om_ext_cid=biz_vnty_istr-24_multi_v10195.
- [3] An, J., and Cho, S. Variational autoencoder based anomaly detection using reconstruction probability. Special Lecture on IE (2015).
- [4] Arntz, P. Threat spotlight: Crysis, aka dharma ransomware, causing a crisis for businesses, 2019. https://blog.malwarebytes.com/threat-analysis/2019/05/threat-spotlight-crysis-aka-dharma-ransomware-causing-a-crisis-for-businesses/.
- [5] Axelsson, S. The base-rate fallacy and its implications for the difficulty of intrusion detection. In Conference on Computer and Communications Security (1999), ACM.
- [6] Bellissimo, A., Burgess, J., and Fu, K. Secure software updates: Disappointments and new challenges. In HotSec (2006).
- [7] Berg, A., Ahlberg, J., and Felsberg, M. Unsupervised learning of anomaly detection from contaminated image data using simultaneous encoder training. arXiv preprint arXiv:1905.11034 (2019).
- [8] Caballero, J., Grier, C., Kreibich, C., and Paxson, V. Measuring pay-per-install: the commoditization of malware distribution. In Security Symposium (2011), USENIX.
- [9] Caragea, C., Wu, J., Ciobanu, A., Williams, K., Fernández-Ramírez, J., Chen, H.-H., Wu, Z., and Giles, L. Citeseer x: A scholarly big dataset. In European Conference on Information Retrieval (2014), Springer, pp. 311–322.
- [10] Carata, L., Akoush, S., Balakrishnan, N., Bytheway, T., Sohan, R., Seltzer, M., and Hopper, A. A primer on provenance. ACM Queue (2014).
- [11] Chandola, V., Banerjee, A., and Kumar, V. Anomaly detection: A survey. ACM computing surveys 41, 3 (2009), 15.
- [12] Chang, H., Rong, Y., Xu, T., Huang, W., Zhang, H., Cui, P., Zhu, W., and Huang, J. A restricted black-box adversarial framework towards attacking graph embedding models. In Conference on Artificial Intelligence (2020), AAAI.
- [13] Chau, D. H. P., Nachenberg, C., Wilhelm, J., Wright, A., and Faloutsos, C. Polonium: Tera-scale graph mining and inference for malware detection. In International Conference on Data Mining (2011), SIAM.
- [14] Check Point Research. Naikon apt: Cyber espionage reloaded, 2020. https://research.checkpoint.com/2020/naikon-apt-cyber-espionage-reloaded/.
- [15] Claburn, T. Dear planet earth: Patch webmin now – zero-day exploit emerges for potential hijack hole in server control panel, 2019. https://www.theregister.co.uk/2019/08/19/webmin_project_zero_day_patch/.
- [16] Crofford, C., and McKee, D. Ransomware families use nsis installers to avoid detection, analysis, 2017. https://securingtomorrow.mcafee.com/other-blogs/mcafee-labs/ransomware-families-use-nsis-installers-to-avoid-detection-analysis/.
- [17] Dai, Q., Li, Q., Tang, J., and Wang, D. Adversarial network embedding. In Conference on Artificial Intelligence (2018), AAAI.
- [18] Dong, Y., Chawla, N. V., and Swami, A. metapath2vec: Scalable representation learning for heterogeneous networks. In International Conference on Knowledge Discovery and Data Mining (2017), ACM.
- [19] Du, M., Li, F., Zheng, G., and Srikumar, V. Deeplog: Anomaly detection and diagnosis from system logs through deep learning. In Conference on Computer and Communications Security (2017), ACM.
- [20] FileHippo. Popular software, n.d. https://filehippo.com/popular/.
- [21] FireEye. The numbers game: How many alerts is too many to handle?, 2015. https://www2.fireeye.com/StopTheNoise-IDC-Numbers-Game-Special-Report.html.
- [22] Gao, P., Xiao, X., Li, D., Li, Z., Jee, K., Wu, Z., Kim, C. H., Kulkarni, S. R., and Mittal, P. Saql: A stream-based query system for real-time abnormal system behavior detection. In Security Symposium (2018), USENIX.
- [23] Gehani, A., and Tariq, D. Spade: support for provenance auditing in distributed environments. In Middleware Conference (2012), ACM/IFIP/USENIX.
- [24] GReAT, A. Operation shadowhammer, 2019. https://securelist.com/operation-shadowhammer/89992/.
- [25] Grover, A., and Leskovec, J. node2vec: Scalable feature learning for networks. In International Conference on Knowledge Discovery and Data Mining (2016), ACM.
- [26] Guthrie, D., Allison, B., Liu, W., Guthrie, L., and Wilks, Y. A closer look at skip-gram modelling. In LREC (2006), pp. 1222–1225.
- [27] Han, X., Pasquier, T., Bates, A., Mickens, J., and Seltzer, M. Unicorn: Runtime provenance-based detector for advanced persistent threats. In NDSS (2020).
- [28] Han, X., Pasquier, T., Ranjan, T., Goldstein, M., and Seltzer, M. Frappuccino: fault-detection through runtime analysis of provenance. In Workshop on Hot Topics in Cloud Computing (2017), USENIX.
- [29] Han, X., Pasquier, T., and Seltzer, M. Provenance-based intrusion detection: Opportunities and challenges. In Workshop on the Theory and Practice of Provenance (2018), USENIX.
- [30] Harris, Z. S. Distributional structure. Word 10, 2-3 (1954), 146–162.
- [31] Hasan, R., Sion, R., and Winslett, M. Preventing history forgery with secure provenance. Transactions on Storage 5, 4 (2009), 12.
- [32] Hassan, W. U., Guo, S., Li, D., Chen, Z., Jee, K., Li, Z., and Bates, A. Nodoze: Combatting threat alert fatigue with automated provenance triage. In NDSS (2019).
- [33] Hochreiter, S., and Schmidhuber, J. Long short-term memory. Neural Computation (1997).
- [34] Hossain, M. N., Milajerdi, S. M., Wang, J., Eshete, B., Gjomemo, R., Sekar, R., Stoller, S. D., and Venkatakrishnan, V. Sleuth: Real-time attack scenario reconstruction from cots audit data. In Security Symposium (2017), USENIX, pp. 487–504.
- [35] Hu, Z., Chen, T., Chang, K.-W., and Sun, Y. Few-shot representation learning for out-of-vocabulary words. arXiv preprint arXiv:1907.00505 (2019).
- [36] Invernizzi, L., Miskovic, S., Torres, R., Kruegel, C., Saha, S., Vigna, G., Lee, S.-J., and Mellia, M. Nazca: Detecting malware distribution in large-scale networks. In NDSS (2014).
- [37] Jenks, G. F. The data model concept in statistical mapping. International Yearbook of Cartography (1967).
- [38] Jiang, B. Head/tail breaks: A new classification scheme for data with a heavy-tailed distribution. The Professional Geographer 65, 3 (2013), 482–494.
- [39] Kapravelos, A., Shoshitaishvili, Y., Cova, M., Kruegel, C., and Vigna, G. Revolver: An automated approach to the detection of evasive web-based malware. In Security Symposium (2013), USENIX.
- [40] Khandelwal, S. Ccleaner attack timeline – here’s how hackers infected 2.3 million pcs, 2018. https://thehackernews.com/2018/04/ccleaner-malware-attack.html/.
- [41] Khasaia, L. Unpacking shade ransomware, 2017. https://secrary.com/ReversingMalware/UnpackingShade/.
- [42] Khodak, M., Saunshi, N., Liang, Y., Ma, T., Stewart, B., and Arora, S. A la carte embedding: Cheap but effective induction of semantic feature vectors. In Annual Meeting of the Association for Computational Linguistics (2018), pp. 12–22.
- [43] Khoshnevisan, F., and Fan, Z. Rsm-gan: A convolutional recurrent gan for anomaly detection in contaminated seasonal multivariate time series. arXiv preprint arXiv:1911.07104 (2019).
- [44] King, S. T., and Chen, P. M. Backtracking intrusions. ACM SIGOPS Operating Systems Review (2003).
- [45] King, S. T., Mao, Z. M., Lucchetti, D. G., and Chen, P. M. Enriching intrusion alerts through multi-host causality. In NDSS (2005).
- [46] Kwon, B. J., Mondal, J., Jang, J., Bilge, L., and Dumitraş, T. The dropper effect: Insights into malware distribution with downloader graph analytics. In Conference on Computer and Communications Security (2015), ACM.
- [47] Lee, K. H., Zhang, X., and Xu, D. High accuracy attack provenance via binary-based execution partition. In NDSS (2013).
- [48] Mandiant. M-trends 2015: A view from the front lines threat report, 2015. http://www2.fireeye.com/rs/fireye/images/rpt-m-trends-2015.pdf.
- [49] Manzoor, E., Milajerdi, S. M., and Akoglu, L. Fast memory-efficient anomaly detection in streaming heterogeneous graphs. In International Conference on Knowledge Discovery and Data Mining (2016), ACM.
- [50] Manzoor, E., Milajerdi, S. M., and Akoglu, L. Streamspot datasets, 2016. https://github.com/sbustreamspot/sbustreamspot-data.
- [51] McCallum, A. Cora dataset.
- [52] Mekky, H., Torres, R., Zhang, Z.-L., Saha, S., and Nucci, A. Detecting malicious http redirections using trees of user browsing activity. In Conference on Computer Communications (2014), IEEE.
- [53] Micro, T. Dharma ransomware uses av tool to distract from malicious activities, 2019. https://blog.trendmicro.com/trendlabs-security-intelligence/dharma-ransomware-uses-av-tool-to-distract- from-malicious-activities/.
- [54] Microsoft. Ransomware operators are hiding malware deeper in installer packages, 2017. https://www.microsoft.com/security/blog/2017/03/15/ ransomware-operators-are-hiding-malware-deeper-in-installer-packages/.
- [55] Microsoft. Ransom:win32/wadhrama.a!rsm, 2017. http://www.microsoft.com/en-us/wdsi/threats/malware-encyclopedia-description?Name=ransom:win32/wadhrama.a!rsm&ThreatID=2147720056.
- [56] Microsoft. About event tracing, 2018. https://docs.microsoft.com/en-us/windows/win32/etw/about-event-tracing.
- [57] Mikolov, T., Sutskever, I., Chen, K., Corrado, G. S., and Dean, J. Distributed representations of words and phrases and their compositionality. In Advances in Neural Information Processing Systems (2013), pp. 3111–3119.
- [58] Milajerdi, S. M., Gjomemo, R., Eshete, B., Sekar, R., and Venkatakrishnan, V. Holmes: Real-time apt detection through correlation of suspicious information flows. In Symposium on Security and Privacy (2019), IEEE.
- [59] Misra, S., Tourani, R., and Majd, N. E. Secure content delivery in information-centric networks: Design, implementation, and analyses. In Workshop on Information-Centric Networking (2013), ACM.
- [60] Muniswamy-Reddy, K.-K., Holland, D. A., Braun, U., and Seltzer, M. I. Provenance-aware storage systems. In Annual Technical Conference (2006), USENIX, pp. 43–56.
- [61] NEC Corporation. Automated security intelligence (asi), 2018. https://www.nec.com/en/global/techrep/journal/g16/n01/160110.html.
- [62] Pasquier, T., Han, X., Goldstein, M., Moyer, T., Eyers, D., Seltzer, M., and Bacon, J. Practical whole-system provenance capture. In Symposium on Cloud Computing (2017), ACM, pp. 405–418.
- [63] Pasquier, T., Han, X., Moyer, T., Bates, A., Hermant, O., Eyers, D., Bacon, J., and Seltzer, M. Runtime analysis of whole-system provenance. In Conference on Computer and Communications Security (2018), ACM.
- [64] Peng, N., Poon, H., Quirk, C., Toutanova, K., and Yih, W.-t. Cross-sentence n-ary relation extraction with graph lstms. Transactions of the Association for Computational Linguistics 5 (2017), 101–115.
- [65] Perozzi, B., Al-Rfou, R., and Skiena, S. Deepwalk: Online learning of social representations. In International Conference on Knowledge Discovery and Data Mining (2014), ACM, pp. 701–710.
- [66] Pohly, D. J., McLaughlin, S., McDaniel, P., and Butler, K. Hi-fi: collecting high-fidelity whole-system provenance. In Computer Security Applications Conference (2012), ACM, pp. 259–268.
- [67] Rahbarinia, B., Balduzzi, M., and Perdisci, R. Real-time detection of malware downloads via large-scale url- file- machine graph mining. In Asia Conference on Computer and Communications Security (2016), ACM, pp. 783–794.
- [68] Řehůřek, R., and Sojka, P. Software framework for topic modelling with large corpora. In Workshop on New Challenges for NLP Frameworks (2010), ELRA.
- [69] Rijnetu, I. Security alert: Malware hides in script injection, bypassing av detection, 2019. https://heimdalsecurity.com/blog/security-alert-malware-script-injection/.
- [70] Samuel, J., Mathewson, N., Cappos, J., and Dingledine, R. Survivable key compromise in software update systems. In Conference on Computer and Communications Security (2010), ACM, pp. 61–72.
- [71] Shen, Y., Mariconti, E., Vervier, P. A., and Stringhini, G. Tiresias: Predicting security events through deep learning. In Conference on Computer and Communications Security (2018), ACM, pp. 592–605.
- [72] Stringhini, G., Kruegel, C., and Vigna, G. Shady paths: Leveraging surfing crowds to detect malicious web pages. In Conference on Computer and Communications Security (2013), ACM, pp. 133–144.
- [73] Stringhini, G., Shen, Y., Han, Y., and Zhang, X. Marmite: spreading malicious file reputation through download graphs. In Annual Computer Security Applications Conference (2017), ACM, pp. 91–102.
- [74] Sze, W. K., and Sekar, R. Provenance-based integrity protection for windows. In Annual Computer Security Applications Conference (2015), ACM.
- [75] Tai, K. S., Socher, R., and Manning, C. D. Improved semantic representations from tree-structured long short-term memory networks. arXiv preprint arXiv:1503.00075 (2015).
- [76] Tsai, C.-F., Hsu, Y.-F., Lin, C.-Y., and Lin, W.-Y. Intrusion detection by machine learning: A review. Expert systems with applications (2009).
- [77] Twist, J. Cyber threat report 17 sep-02 oct 2017.
- [78] van Kemenade, H. Top pypi packages, 2019. https://hugovk.github.io/top-pypi-packages/.
- [79] W3C. Prov-overview: an overview of the prov family of documents.
- [80] Wang, B., and Gong, N. Z. Attacking graph-based classification via manipulating the graph structure. In Conference on Computer and Communications Security (2019), ACM.
- [81] Wang, B., Zhang, L., and Gong, N. Z. Sybilscar: Sybil detection in online social networks via local rule based propagation. In Conference on Computer Communications (2017), IEEE, pp. 1–9.
- [82] Wang, F., Ko, R., and Mickens, J. Riverbed: Enforcing user-defined privacy constraints in distributed web services. In NSDI (2019), pp. 615–630.
- [83] Wang, G., Hao, J., Ma, J., and Huang, L. A new approach to intrusion detection using artificial neural networks and fuzzy clustering. Expert systems with applications 37, 9 (2010), 6225–6232.
- [84] Xu, K., Yao, D., Ma, Q., and Crowell, A. Detecting infection onset with behavior-based policies. In International Conference on Network and System Security (2011), IEEE, pp. 57–64.
- [85] Xu, Z., Nappa, A., Baykov, R., Yang, G., Caballero, J., and Gu, G. Autoprobe: Towards automatic active malicious server probing using dynamic binary analysis. In Conference on Computer and Communications Security (2014), ACM.
- [86] Yin, H., Song, D., Egele, M., Kruegel, C., and Kirda, E. Panorama: capturing system-wide information flow for malware detection and analysis. In Conference on Computer and Communications Security (2007), ACM, pp. 116–127.
- [87] Zaremba, W., and Sutskever, I. Learning to execute. arXiv preprint arXiv:1410.4615 (2014).
- [88] Zügner, D., Akbarnejad, A., and Günnemann, S. Adversarial attacks on neural networks for graph data. In International Conference on Knowledge Discovery and Data Mining (2018), ACM, pp. 2847–2856.
- [89] Zügner, D., and Günnemann, S. Certifiable robustness and robust training for graph convolutional networks. In International Conference on Knowledge Discovery Data Mining (2019), ACM, pp. 246–256.