Anticipated synchronization in human EEG data: unidirectional causality with negative phase-lag
Abstract
Understanding the functional connectivity of the brain has become a major goal of neuroscience. In many situations the relative phase difference, together with coherence patterns, have been employed to infer the direction of the information flow. However, it has been recently shown in local field potential data from monkeys the existence of a synchronized regime in which unidirectionally coupled areas can present both positive and negative phase differences. During the counterintuitive regime, called anticipated synchronization (AS), the phase difference does not reflect the causality. Here we investigate coherence and causality at the alpha frequency band ( Hz) between pairs of electroencephalogram (EEG) electrodes in humans during a GO/NO-GO task. We show that human EEG signals can exhibit anticipated synchronization, which is characterized by a unidirectional influence from an electrode A to an electrode B, but the electrode B leads the electrode A in time. To the best of our knowledge, this is the first verification of AS in EEG signals and in the human brain. The usual delayed synchronization (DS) regime is also present between many pairs. DS is characterized by a unidirectional influence from an electrode A to an electrode B and a positive phase difference between A and B which indicates that the electrode A leads the electrode B in time. Moreover we show that EEG signals exhibit diversity in the phase relations: the pairs of electrodes can present in-phase, anti-phase, or out-of-phase synchronization with a similar distribution of positive and negative phase differences.
Introduction
The extraordinary ability of humans to model and predict facts are one of the prerequisites for both action and cognition. These capacities emerge from the various synchronous rhythms generated by the brain Buzsaki (2006); Wang (2010), which represent a core mechanism for neuronal communication Fries (2005). In particular, phase synchronization Pikovsky et al. (2001) has been related to selective attention Doesburg et al. (2008); Maris et al. (2013), large-scale information integration Varela et al. (2001) and memory processes Fell and Axmacher (2011); Dotson et al. (2014). Despite huge evidence of zero-lag synchronization in the brain Wang (2010), there is a growing number of studies reporting non-zero phase differences between synchronized brain areas Maris et al. (2013); Dotson et al. (2014); Gregoriou et al. (2009); Tiesinga and Sejnowski (2010); Bastos et al. (2015); Livingstone (1996). It has been assumed that phase diversity plays an important role in fast cognitive processes Maris et al. (2016).
In many situations the phase, together with coherence patterns, have been employed to infer the direction of the information flow Korzeniewska et al. (2003); Marsden et al. (2001); Williams et al. (2002); Schnitzler and Gross (2005); Sauseng and Klimesch (2008); Gregoriou et al. (2009). The assumption is typically that the phase difference reflects the transmission time of neural activity. However, this assumed relationship is not theoretically justified Thatcher (2012). Particularly, during special synchronized regimes, the phase difference does not reflect the causality Brovelli et al. (2004); Salazar et al. (2012); Matias et al. (2014); Hahs and Pethel (2011); Vakorin et al. (2014).
It has been shown that a monkey performing a cognitive task can present unidirectional influence from a cortical region A to another region B with a negative phase difference between the two areas Brovelli et al. (2004); Salazar et al. (2012); Matias et al. (2014). This means that the receiver region B can lead the activity of A. For example, it has been observed that during the waiting period of a GO/NO-GO task, a macaque monkey present unidirectional causality from the somatosensory cortex to the motor cortex with a negative phase Brovelli et al. (2004); Matias et al. (2014). A similar apparent incongruence has been verified between PreFrontal Cortex (PFC) and Posterior Parietal Cortex (PPC) in monkeys performing a working memory task Salazar et al. (2012). The information flows from the PPC to the PFC but the activity of the PFC leads the activity of the PPC by to ms.
These experimental results have been compared to a model of two unidirectionally coupled neuronal populations Matias et al. (2014). The phase difference between the sender and the receiver population can be controlled by the inhibitory synaptic conductance in the receiver population Matias et al. (2014) or by the amount of external noise at the receiver Dalla Porta et al. (2019). By construction, the information flow is always from the sender to the receiver population but the receiver can lead the sender, which is characterized by a negative phase difference. In other words, the sender lags behind the receiver. Results were corroborate using the statistical permutation quantifiers in the multi-scale entropy causality plane Montani et al. (2015). This counter-intuitive regime has been explained in the light of anticipated synchronization (AS) ideas Voss (2000); Matias et al. (2014).
The anticipatory synchronization can be a stable solution of two dynamical systems coupled in a sender-receiver configuration, if the receiver is also subjected to a negative delayed self-feedback Voss (2000); Masoller and Zanette (2001); Ciszak et al. (2005); Pyragas and Pyragienè (2008); Ambika and Amritkar (2009); Mayol et al. (2012); Sausedo-Solorio and Pisarchik (2014):
| (1) | |||||
and are dynamical variables respectively representing the sender and the receiver systems. is a vector function which defines each autonomous dynamical system, is the coupling matrix and is the delay in the receiver’s negative self-feedback. In such system, is a solution of the system, which can be easily verified by direct substitution in Eq. 1. AS has been observed in excitable models driven by white noise Ciszak et al. (2003), chaotic systems Voss (2000); Pyragas and Pyragienè (2008), as well as in experimental setups with semiconductor lasers Sivaprakasam et al. (2001); Tang and Liu (2003) and electronic circuits Ciszak et al. (2009).
AS has also been observed when the self-feedback was replaced by parameter mismatches Corron et al. (2005); Srinivasan et al. (2012); Pyragienè and Pyragas (2013, 2015); Simonov et al. (2014), inhibitory dynamical loops Matias et al. (2011, 2014, 2015); Pinto et al. (2019) and noise at the receiver Dalla Porta et al. (2019). It has been suggested that AS can emerge when the receiver dynamics is faster than the senders Hayashi et al. (2016a); Dima et al. (2018); Pinto et al. (2019); Dalla Porta et al. (2019). Furthermore, unidirectionally coupled lasers reported both regimes: AS and the usual delayed synchronization (DS, in which the sender predicts the activity of the receiver), depending on the difference between the transmission time and the feedback delay time Liu et al. (2002); Tang and Liu (2003). The two regimes were observed to have the same stability of the synchronization manifold in the presence of small perturbations due to noise or parameter mismatches Tang and Liu (2003). Neuron models can also present a transition from positive to negative phase differences (from DS to AS) depending on coupling parameters Matias et al. (2011, 2014, 2015); Dalla Porta et al. (2019). Therefore, the study of anticipatory regimes in biological systems (not man-made) is receiving more attention in the last years Hayashi et al. (2016b); Stepp and Turvey (2010); Washburn et al. (2019); Roman et al. (2019).
Here we employ spectral coherence and Granger causality (GC) measures to infer the direction of influence, as well as the phase difference between electrodes of the EEG from 11 subjects. We verify, for all subjects, the existence of coherent activity in the alpha band ( Hz) between pairs of electrodes. We also show that many of these pairs exhibit a unidirectional influence from one electrode to another and a phase difference that can be positive or negative. In Sec. I and III we describe the experimental paradigm and EEG processing and analysis. In Sec. I, we report our results, showing that when we consider all the unidirectionally coupled pairs we verify that there is a diversity in the phase relation: they exhibit in-phase, anti-phase, or out-of-phase synchronization with similar distribution of positive and negative phase differences (DS and AS, respectively). Concluding remarks and brief discussion of the significance of our findings for neuroscience are presented in Sec. II.
I Results
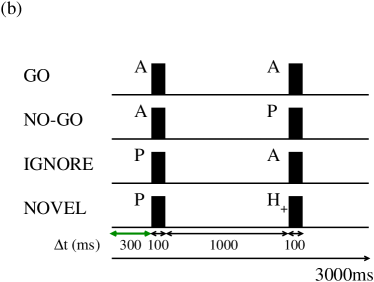
The experiment consists in 400 trials of a GO/NO-GO task. In each trial a pair of stimuli were presented after a waiting window of ms, which is the important interval for our analysis (see the green arrow in Fig. 1(b)). Depending on the combination of stimuli, participants should press a button or not. Oscillatory main frequency, synchronized activity and directional influence were estimated by the power, coherence, phase difference and Granger causality spectra as reported in Matias et al. Matias et al. (2014) (see more details in Sec. III).
(a)
(b)
Synchronization between electrodes and can be characterized by a peak in the coherence spectrum . The phase difference at the peak frequency provides the time delay between the electrodes. The direction of influence is given by the Granger causality spectrum. Whenever an electrode strongly and asymmetrically G-causes , we refer to as the sender (S) and to as the receiver (R) and the link between and is considered a unidirectional coupling from to (S R). After determining which electrode is the sender and which one is the receiver we analyze the sign of to determine the synchronized regime. Unless otherwise stated we analyze only the unidirectionally connected pairs.
Delayed synchronization (DS): unidirectional causality with positive phase-lag
Typically when a directional influence is verified from A to B, a positive time delay is expected, indicating that A’s activity temporally precedes that of B Gregoriou et al. (2009); Sharott et al. (2005). This positive time delay characterizes the intuitive regime called delayed synchronization (DS, or also retarded synchronization) in which the sender is also the leader Tang and Liu (2003). In neuronal models the time delay between A and B can reflect the characteristic time scale of the synapses between A and B but can also be modulated by local properties of the receiver region B Matias et al. (2014); Dalla Porta et al. (2019).
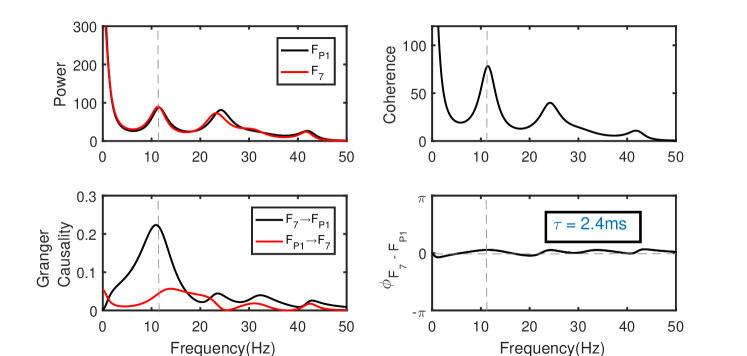
In Fig. 2 we show an example of DS between the sites F7 and FP1 for volunteer 439. Power and coherence spectra present a peak at Hz. At this frequency, the activity of F7 G-causes FP1, but not the other way around. The positive sign of the phase rad indicates that the sender electrode F7 leads the receiver electrode FP1 with a positive time delay ms.
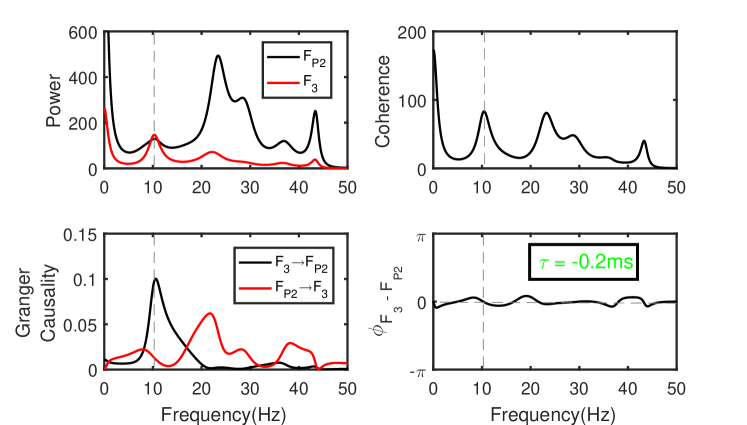
Anticipated synchronization (AS): unidirectional causality with negative phase-lag
Despite the fact that phase differences and coherence patterns, have been employed to infer the direction of the information flux Marsden et al. (2001); Williams et al. (2002); Schnitzler and Gross (2005); Sauseng and Klimesch (2008); Gregoriou et al. (2009); Korzeniewska et al. (2003), our results imply that if we consider only the coherence and phase-lag we could infer the wrong direction of influence between the involved pairs. Such counter-intuitive regime exhibiting unidirectionally causality with negative phase difference has first been reported in the brain as a mismatch between causality and the sign of the phase difference in local field potential of macaque monkeys during cognitive tasks Brovelli et al. (2004); Salazar et al. (2012). Afterwards, it has been reported that the apparent paradox could be explained in the light of anticipated synchronization ideas Matias et al. (2014). Here we show that human EEG signals can also present unidirectional influence with negative phase-lag. As far as we know, this is the first evidence of AS in human EEG data.
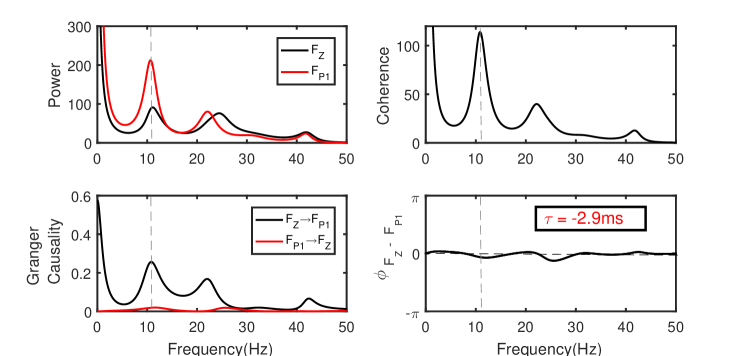
An example of anticipated synchronization between EEG electrodes is shown in Fig. 3. The sites and exhibit a peak at alpha band in the power and coherence spectra for Hz (Fig. 3) for volunteer 439. The Granger causality spectra presents a peak from to but not in the opposite direction, indicating that G-causes at Hz. However, the negative sign of the angle rad indicates that the activity of FZ lags behind the activity of FP1. The time delay associated to is ms.
It is worth mentioning that for linear phase responses, which is the case for a simple monochromatic sinusoidal function, the phase delay and the group delay (defined by the derivative of phase with respect to frequency) are identical. In this case, both phase and group delays may be interpreted as the actual time delay between the signals. For time series that are synchronized in a broad frequency band, the group delay could be useful to estimate the time difference between the signals. Indeed, a negative group delay has been associated with anticipatory dynamics Voss (2016); Voss and Stepp (2016); Voss (2018) and it is comparable to the time difference obtained by the cross-correlation function Voss (2016). Here, we verified that some AS pairs present both negative phase delay and negative group delay (as in the example shown in Fig. 3). However, this is not the case for all AS pairs in the analyzed data. We have found all possible combinations for the signs of phase and group delays for both DS and AS. A further investigation of the relation between phase delay and group delay in brain signals is out of the scope of this paper and should be done elsewhere.”
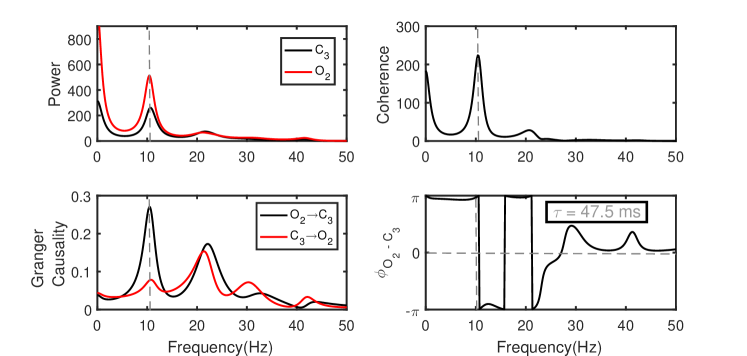
Zero-lag synchronization (ZL)
Zero-lag (ZL) synchronization has been widely documented in experimental data since its first report in the cat visual cortex Gray et al. (1989). It has been related to different cognitive functions such as perceptual integration and the execution of coordinated motor behaviours Roelfsema et al. (1997); Varela et al. (2001); Fries (2005); Uhlhaas et al. (2009). Despite many models showing that bidirectional coupling between areas promotes zero-lag synchronization Vicente et al. (2008); Gollo et al. (2014), it is also possible to have ZL between unidirectional connected populations Matias et al. (2014, 2015); Dalla Porta et al. (2019). In these systems, nonlinear properties of the receiver region can compesate characteristic synaptics delays and the two systems synchronize at zero phase.
We consider zero-lag whenever rad. In Fig. 4 we show power, coherence, Granger causality and phase spectra between electrodes and for volunteer 439. These sites are synchronized with main frequency Hz and rad which provides ms.
Anti-phase synchronization
Participants can also exhibit anti-phase synchronization between electrodes. We define anti-phase synchronization (AP) when rad. In Fig. 5 we show power, coherence, Granger causality and phase spectra between electrodes and for volunteer 439. The site G-causes and the time delay between them is ms which is almost half of a period for the Hz.
| Unidirectional | Back-to-Front | Lateral | Front-to-Back | |
|---|---|---|---|---|
| Total | 686 | 430 | 90 | 166 |
| ZL | 93 | 39 | 25 | 29 |
| DS(1) | 77 | 25 | 14 | 38 |
| AS(1) | 99 | 51 | 27 | 21 |
| AP | 174 | 135 | 11 | 28 |
| DS(2) | 108 | 83 | 4 | 21 |
| AS(2) | 135 | 97 | 9 | 29 |
Phase relation diversity across pairs and subjects
Reliable phase relation diversity is a general property of brain oscillations. It has been reported on multiple spatial scales, ranging from very small spatial scale (inter-electrode distance mm) in macaque Maris et al. (2013); Dotson et al. (2014), to a large spatial scale (using magnetoencephalography) in humans van Ede et al. (2015). However, the functional significance of phase relations in neuronal signals is not well defined. It has been hypothesized that it may support effective neuronal communication by enhancing neuronal selectivity and promoting segregation of multiple information streams Maris et al. (2016).
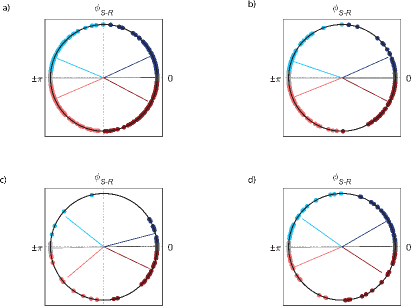
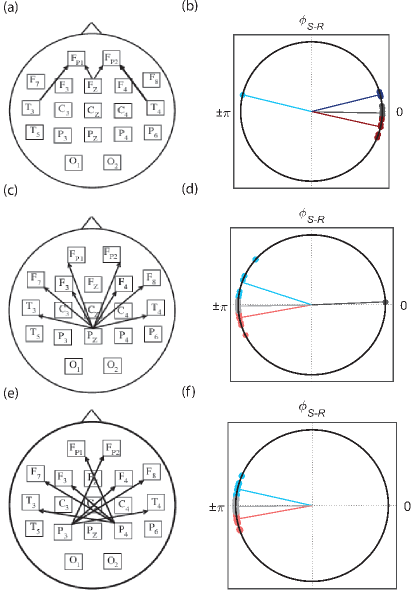
Considering the 19 electrodes per subject, the number of analyzed pairs is 171 for each volunteer which corresponds to 1881 pairs in total. Among these pairs, 1394 presented a peak in the coherence spectrum at the alpha band. Regarding the Granger causality spectra, 686 pairs presented an unidirectional influence and 358 a bidirectional influence. In Fig. 6(a) we show the phase-difference distribution of all 686 unidirectionally connected pairs for all volunteers in a circular plot. In Figs. 6(b),(c),(d) we show all the pairs separated by the direction of influence: from the back to the front (430), lateral flux (90) and from the front to the back (166), respectively. The colors represent the four different synchronized regimes mentioned before: DS (blue for positive phase: rad), AS (red for negative phase: rad), ZL (dark grey for close to zero-phase: rad) and AP (light grey for phase close to : rad). We have also separated the DS and AS regimes into two different subcategories: DS(1) for phase in the first quadrant (dark blue), DS(2) for phase in the second quadrant (light blue), AS(1) for phase in the fourth quadrant (dark red) and AS(2) for phase in the third quadrant (light red). The number of pairs in each situation are shown in Table 1 and in Fig. 7.
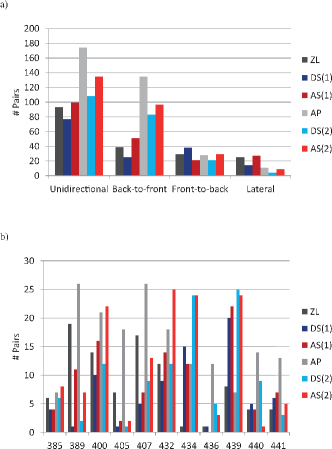
The total number of synchronized and unidirectionally connected pairs varies among volunteers, as well as the distribution of phases. All subjects present DS, AS, ZL and AP pairs (see Fig. 7(b)). However, one subject does not present AS(1). All subjects present back-to-front, lateral and front-to-back influence and more pairs with back-to-front than front-to-back direction of influence. Considering only the back-to-front pairs, there are more AP than ZL synchronized regimes. This is also true if we compare all pairs in the second and third quadrant (AP, DS(2) and AS(2)) with the ones in the first and fourth (ZL, DS(1), AS(1)).
As illustrative examples, in Fig. 8 we show the direction of influence between some pairs that have the same unidirectional back-to-front Granger for at least 4 subjects and their respective phases. Almost all pairs that have the electrodes , and as the sender present phases close to anti-phase (AP, DS(2), AS(2)), whereas almost all the pairs in which the sender is , or are synchronized close to zero-lag (ZL, DS(1), AS(1)).
Regarding back-to-front influences, no pair presented the same Granger causal relation for 9 or more subjects. Three pairs exhibited same unidirectional relation for 8 volunteers: , , ; other 3 pairs presented the same unidirectional relation for 7 subjects: , , . Ten pairs had same Granger causal relation for 6 volunteers: , , , , , , , , , . All these 16 pairs had none or only one other subject presenting the opposite direction of the Granger causality. Out of these 16 pairs, only is mostly synchronized close do ZL as shown in Figs. 6(a) and (b), all others are mostly synchronized close to AP as in Figs. 6(c)-(f).
II Conclusion
We show that human EEG can simultaneously present unidirectional causality and diverse phase relations between electrodes. Our findings suggest that the human brain can operate in a dynamical regime where the information flow and relative phase-lag have opposite signs. To the best of our knowledge this is the first evidence of unidirectional influence accompanied by negative phase differences in EEG data. This counter-intuitive phenomena have been previously reported as anticipated synchronization in monkey LFP Matias et al. (2014); Brovelli et al. (2004); Salazar et al. (2012), in neuronal models Ciszak et al. (2003); Matias et al. (2011); Pyragienè and Pyragas (2013); Sausedo-Solorio and Pisarchik (2014); Simonov et al. (2014) and in physical systems Sivaprakasam et al. (2001); Tang and Liu (2003); Corron et al. (2005); Ciszak et al. (2009); Srinivasan et al. (2012). Therefore, we propose that this is the first verification of anticipated synchronization in EEG signals and in human brains.
Studies estimating the actual brain connectivity using data from EEG signals should consider many relevant issues such as Brette and Destexhe (2012): the importance of common reference in EEG to estimate phase differences Thatcher (2012) and the effects of volume conduction for source localization Nunez et al. (1997); van den Broek et al. (1998). Our findings suggest that it is also important to take into account the possible existence of AS in connectivity studies and separately analyze causality and phase relations. It is worth mentioning that, it has been shown that for enough data points the Granger causality is able to distinguish AS and DS regimes Hahs and Pethel (2011). However, for very well behaved time series the reconstruction of the connectivity can be confused by the phase Vakorin et al. (2014).
Our results open important avenues for investigating how neural oscillations contribute to the neural implementation of cognition and behavior as well as for studying the functional significance of phase diversity Maris et al. (2013, 2016). Future works could investigate the relation between anticipated synchronzation in brain signals and anticipatory behaviors Stepp and Turvey (2010) such as anticipation in human-machine interaction Washburn et al. (2019) and during synchronized rhythmic action Roman et al. (2019). It is also possible to explore the relation between consistent phase differences and behavioral data such as learning rate, reaction time and task performance during different cognitive tasks . Neuronal models have shown that spike-timing dependent plasticity and the DS-AS transition together could determine the phase differences between cortical-like populations Matias et al. (2015). However, an experimental evidence for the relation between learning and negative phase differences is still lacking.
We also suggest that our study can be potentially interesting to future researches on the relation between inhibitory coupling, oscillations and communication between brain areas. On one hand, inhibition is considered to play an important role to establish the oscillatory alpha activity, in particular, allowing selective information processes Klimesch et al. (2007). On the other hand, according to the anticipated synchronization in neuronal populations model presented in Ref. Matias et al. (2014), a modification of the inhibitory synaptic conductance at the receiver population can modulate the phase relation between sender and receiver, eventually promoting a transition from DS to AS. Therefore, we suggest that the inhibition at the receiver region can control the phase difference between cortical areas, which has been hypothesized to control the efficiency of the information exchange between these areas, via communication through coherence Fries (2005); Bastos et al. (2015).
III Appendix: Methods
Subjects
We analyzed data from 11 volunteers (10 women, 1 man, all right-handed) who signed to indicate informed consent to participate in the experiment. The youngest was 32 years old and the oldest 55 years old (average 45.7 and standard deviation 7.8). All subjects were evaluated by both psychiatrist and psychologist. Exclusion criteria were: perinatal problems, cranial injuries with loss of consciousness and neurological deficit, history of seizures, medication or other drugs 24 hours before the recording, presence of psychotic symptoms in 6 months prior the study and the presence of systemic and neurological diseases. The experiment was not specifically designed to investigate the phenomena of anticipated synchronization in humans and the data analyzed here were first analyzed in Ref. Aguilar-Domingo (2013). The entire experimental protocol was approved by the Commission of Bioethics of the University of Murcia (UMU, project: Subtipos electrofisiológicos y mediante estimulación eléctrica transcraneal del Trastorno por Déficit de Atención con o sin Hiperactividad).
EEG recording
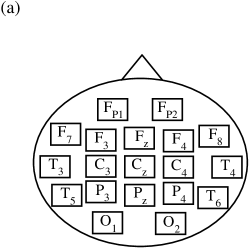
The electroencephalographic data recordings were carried out at the Spanish Foundation for Neurometrics Development (Murcia, Spain) center using a Mitsar 201M amplifier (Mitsar Ltd), a system of 19 channels with auricular reference. Data were digitized at a frequency of 250 Hz. The electrodes were positioned according to the international 10-20 system using conductive paste (ECI ELECTRO-GEL). Electrode impedance was kept K. The montage (Fig. 1(a)) include three midline sites (FZ, CZ and PZ) and eight sites over each hemisphere (FP1/FP2,F7/F8,F3/F4,T3/T4,C3/C4,P3/P4,T5/T6 and O1/O2). The acquisition was realized by WinEEG software (Version 2.92.56). EEG epochs with excessive amplitude ( V) were automatically deleted. Finally, the EEG was analyzed by a specialist in neurophysiology to reject epochs with artifacts.
Experimental task
The EEG data were recorded while subjects performed a GO/NO-GO task (also called visual continuous performance task, VCPT). Participants sat in an ergonomic chair 1.5 meters away from a plasma screen. Psytask software (Mitsar Systems) was used to present the images. The VCPT consists of three types of stimuli: twenty images of animals (A), twenty images of plants (P), twenty images of people of different professions (H+). Whenever H+ was presented, a ms-long artificial sound tone frequency was simultaneously produced. The tone frequencies range from 500 to Hz, in intervals of Hz. All stimuli were of equal size and brightness.
In each trial a pair of stimuli were presented after a waiting window of ms, which is the important interval for our analysis (see the green arrow in Fig. 1(b)). Each stimulus remains on the screen for ms, with a ms inter-stimulus-interval. Four different kinds of pairs of stimuli were employed: AA, AP, PP and PH+. The entire experiment consists in 400 trials (the four kinds of pairs were randomly distributed and each one appeared 100 times). The continuous set occurs when A is presented as the first stimulus, so the subject needed to prepare to respond. An AA pair corresponds to a GO task and the participants are supposed to press a button as quickly as possible. An AP pair corresponds to a NO-GO task and the participants should suppress the action of pressing the button. The discontinuous set, in which P is first presented, indicates that one should not respond (independently of the second stimuli). IGNORE task occurred with PP pairs and NOVEL when PH+ pairs appeared. Participants were trained for about five minutes before beginning the experimental trials. They rested for a few minutes when they reached the halfway point of the task. The experimental session lasted min.
EEG processing and analysis
The Power, Coherence, Granger causality and phase difference spectra were calculated following the methodology reported in Matias et al. Matias et al. (2014) using the auto-regressive modeling method (MVAR) implemented in the MVGC Matlab toolbox Barnett and Seth (2014). Data were acquired while participants were performing the GO/NO-GO visual pattern discrimination described before. Our analysis focuses on points representing the waiting window of trials ending with the visual stimulus onset (green arrow in Fig. 1(b)). This means that in each trial, the 300-ms pre-stimulus interval consists of 75 points with a 250-Hz sample rate.
The preprocess of the multi-trial EEG time series consists in detrending, demeaning and normalization of each trial. Respectively, it means to subtract from the time series the best-fitting line, the ensemble mean and divide it by the temporal standard deviation. After these processes each single trial can be considered as produced from a zero-mean stochastic process. In order to determine an optimal order for the MVAR model we obtained the minimum of the Akaike Information Criterion (AIC) Akaike (1974) as a function of model order. The AIC dropped monotonically with increasing model order up to 30.
For each pair of sites we calculated the spectral matrix element Brovelli et al. (2004); Lütkepohl (1993), from which the coherence spectrum and the phase spectrum were calculated. A peak of indicates synchronized oscillatory activity at the peak frequency , with a time delay . We only consider Hz and we use the terms time delay and phase difference interchangeably. It is worth mentioning that and . Directional influence from site to site was assessed via the Granger causality spectrum Matias et al. (2014); Brovelli et al. (2004); Lütkepohl (1993). When the has a peak around the obtained from the coherence spectrum, we consider that G-causes . In order to define back-to-front, lateral or front-to-back influence we separated the electrodes in 5 lines (see Fig. 1(a)): and ; ,,, and ; ,, , and ; , , , , and ; and .
Acknowledgements.
The authors thank CNPq (grants 432429/2016-6, 425329/2018-6, 301744/2018-1), CAPES (grants 88881.120309/2016-01, 23038.003382/2018-39), FACEPE (grants APQ-0642-1.05/18, APQ-0826-1.05/15), FAPEAL, UFAL and UFPE for financial support. This paper was produced as part of the activities of Research, Innovation and Dissemination Center for Neuromathematics (grant No. 2013/07699-0, S. Paulo Research Foundation FAPESP).References
- Buzsaki (2006) G. Buzsaki, Rhythms of the Brain (Oxford University Press (New York), 2006).
- Wang (2010) X. J. Wang, Physiological Reviews 90, 1195 (2010).
- Fries (2005) P. Fries, Trends in Cognitive Sciences 9, 474 (2005).
- Pikovsky et al. (2001) A. Pikovsky, M. Rosenblum, and J. Kurths, Synchronization: A Universal Concept in Nonlinear Sciences (Cambridge University Press, Cambridge, UK, 2001).
- Doesburg et al. (2008) S. M. Doesburg, A. B. Roggeveen, K. Kitajo, and L. M. Ward, Cerebral Cortex 18, 386 (2008).
- Maris et al. (2013) E. Maris, T. Womelsdorf, R. Desimone, and P. Fries, Neuroimage 74, 99 (2013).
- Varela et al. (2001) F. Varela, J. P. Lachaux, E. Rodriguez, and J. Martinerie, Nature Reviews Neuroscience 2, 229 (2001).
- Fell and Axmacher (2011) J. Fell and N. Axmacher, Nature Reviews Neuroscience 12, 105 (2011).
- Dotson et al. (2014) N. M. Dotson, R. F. Salazar, and C. M. Gray, The Journal of Neuroscience 34, 13600 (2014).
- Gregoriou et al. (2009) G. G. Gregoriou, S. J. Gotts, H. Zhou, and D. R., Science 324, 1207 (2009).
- Tiesinga and Sejnowski (2010) P. H. Tiesinga and T. J. Sejnowski, Frontiers in human neuroscience 4, 196 (2010).
- Bastos et al. (2015) A. M. Bastos, J. Vezoli, and P. Fries, Current opinion in neurobiology 31, 173 (2015).
- Livingstone (1996) M. S. Livingstone, Journal of Neurophysiology 75, 2467 (1996).
- Maris et al. (2016) E. Maris, P. Fries, and F. van Ede, Trends in neurosciences 39, 86 (2016).
- Korzeniewska et al. (2003) A. Korzeniewska, M. Mańczak, M. Kamiński, K. J. Blinowska, and S. Kasicki, Journal of neuroscience methods 125, 195 (2003).
- Marsden et al. (2001) J. F. Marsden, P. Limousin-Dowsey, P. Ashby, P. Pollak, and P. Brown, Brain 124, 378 (2001).
- Williams et al. (2002) D. Williams, M. Tijssen, G. van Bruggen, A. Bosch, A. Insola, V. D. Lazzaro, P. Mazzone, A. Oliviero, A. Quartarone, H. Speelman, et al., Brain 125, 1558 (2002).
- Schnitzler and Gross (2005) A. Schnitzler and J. Gross, Nature Reviews Neuroscience 6, 285 (2005).
- Sauseng and Klimesch (2008) P. Sauseng and W. Klimesch, Neuroscience & Biobehavioral Reviews 32, 1001 (2008).
- Thatcher (2012) R. W. Thatcher, Developmental neuropsychology 37, 476 (2012).
- Brovelli et al. (2004) A. Brovelli, M. Ding, A. Ledberg, Y. Chen, R. Nakamura, and S. L. Bressler, Proc. Natl. Acad. Sci. USA 101, 9849 (2004).
- Salazar et al. (2012) R. F. Salazar, N. M. Dotson, S. L. Bressler, and C. M. Gray, Science 338, 1097 (2012).
- Matias et al. (2014) F. S. Matias, L. L. Gollo, P. V. Carelli, S. L. Bressler, M. Copelli, and C. R. Mirasso, NeuroImage 99, 411 (2014).
- Hahs and Pethel (2011) D. W. Hahs and S. D. Pethel, Phys. Rev. Lett. 107, 128701 (2011).
- Vakorin et al. (2014) V. A. Vakorin, O. Krakovska, and A. R. McIntosh, in Directed Information Measures in Neuroscience (Springer, 2014), pp. 137–158.
- Dalla Porta et al. (2019) L. Dalla Porta, F. S. Matias, A. J. dos Santos, A. Alonso, , C. M. Carelli, Pedro V., and C. Mirasso, Frontiers in systems neuroscience 13, 41 (2019).
- Montani et al. (2015) F. Montani, O. A. Rosso, F. S. Matias, S. L. Bressler, and C. R. Mirasso, Phil. Trans. R. Soc. A 373, 20150110 (2015).
- Voss (2000) H. U. Voss, Phys. Rev. E 61, 5115 (2000).
- Masoller and Zanette (2001) C. Masoller and D. H. Zanette, Physica A 300, 359 (2001).
- Ciszak et al. (2005) M. Ciszak, J. M. Gutiérrez, A. S. Cofiño, C. R. Mirasso, R. Toral, L. Pesquera, and S. Ortín, Phys. Rev. E 72, 046218 (2005).
- Pyragas and Pyragienè (2008) K. Pyragas and T. Pyragienè, Phys. Rev. E 78, 046217 (2008).
- Ambika and Amritkar (2009) G. Ambika and R. E. Amritkar, Phys. Rev. E 79, 056206 (2009).
- Mayol et al. (2012) C. Mayol, C. R. Mirasso, and R. Toral, Phys. Rev. E 85, 056216 (2012).
- Sausedo-Solorio and Pisarchik (2014) J. Sausedo-Solorio and A. Pisarchik, Physics Letters A 378, 2108 (2014).
- Ciszak et al. (2003) M. Ciszak, O. Calvo, C. Masoller, C. R. Mirasso, and R. Toral, Phys. Rev. Lett. 90, 204102 (2003).
- Sivaprakasam et al. (2001) S. Sivaprakasam, E. M. Shahverdiev, P. S. Spencer, and K. A. Shore, Phys. Rev. Lett. 87, 154101 (2001).
- Tang and Liu (2003) S. Tang and J. M. Liu, Phys. Rev. Lett. 90, 194101 (2003).
- Ciszak et al. (2009) M. Ciszak, C. R. Mirasso, R. Toral, and O. Calvo, Phys. Rev. E 79, 046203 (2009).
- Corron et al. (2005) N. J. Corron, J. N. Blakely, and S. D. Pethel, Chaos 15, 023110 (2005).
- Srinivasan et al. (2012) K. Srinivasan, D. V. Senthilkumar, R. Mohamed, K. Murali, M. Lakshmanan, and J. Kurths, Chaos 22, 023124 (2012).
- Pyragienè and Pyragas (2013) T. Pyragienè and K. Pyragas, Nonlinear Dynamics 74, 297 (2013).
- Pyragienè and Pyragas (2015) T. Pyragienè and K. Pyragas, Nonlinear Dynamics 79, 1901 (2015).
- Simonov et al. (2014) A. Y. Simonov, S. Y. Gordleeva, A. Pisarchik, and V. Kazantsev, JETP letters 98, 632 (2014).
- Matias et al. (2011) F. S. Matias, P. V. Carelli, C. R. Mirasso, and M. Copelli, Phys. Rev. E 84, 021922 (2011).
- Matias et al. (2015) F. S. Matias, P. V. Carelli, C. R. Mirasso, and M. Copelli, PloS one 10, e0140504 (2015).
- Pinto et al. (2019) M. A. Pinto, O. A. Rosso, and F. S. Matias, Physical Review E 99, 062411 (2019).
- Hayashi et al. (2016a) Y. Hayashi, S. J. Nasuto, and H. Eberle, Physical Review E 93, 052229 (2016a).
- Dima et al. (2018) G. C. Dima, M. Copelli, and G. B. Mindlin, International Journal of Bifurcation and Chaos 28, 1830025 (2018).
- Liu et al. (2002) Y. Liu, Y. Takiguchi, P. Davis, T. Aida, S. Saito, and L. J. .M., Appl. Phys. Lett. 80, 4306 (2002).
- Hayashi et al. (2016b) Y. Hayashi, J. Blake, and S. J. Nasuto, pp. 275–282 (2016b).
- Stepp and Turvey (2010) N. Stepp and M. T. Turvey, Cognitive Systems Research 11, 148 (2010).
- Washburn et al. (2019) A. Washburn, R. W. Kallen, M. Lamb, N. Stepp, K. Shockley, and M. J. Richardson, PloS one 14 (2019).
- Roman et al. (2019) I. R. Roman, A. Washburn, E. W. Large, C. Chafe, and T. Fujioka, PLoS computational biology 15 (2019).
- Sharott et al. (2005) A. Sharott, P. J. Magill, J. P. Bolam, and P. Brown, The Journal of Physiology 562, 951 (2005).
- Voss (2016) H. U. Voss, Physical Review E 93, 030201 (2016).
- Voss and Stepp (2016) H. U. Voss and N. Stepp, Journal of computational neuroscience 41, 295 (2016).
- Voss (2018) H. U. Voss, Chaos: An Interdisciplinary Journal of Nonlinear Science 28, 113113 (2018).
- Gray et al. (1989) C. M. Gray, P. König, A. K. Engel, and W. Singer, Nature 338, 334 (1989).
- Roelfsema et al. (1997) P. R. Roelfsema, A. K. Engel, P. König, and W. Singer, Nature 385, 157 (1997).
- Uhlhaas et al. (2009) P. J. Uhlhaas, G. Pipa, B. Lima, L. Melloni, S. Neuenschwander, D. Nikolić, and W. Singer, Front. Integr. Neurosci. 3, 17 (2009).
- Vicente et al. (2008) R. Vicente, L. L. Gollo, C. R. Mirasso, I. Fischer, and G. Pipa, Proc. Natl. Acad. Sci. USA 105, 17157 (2008).
- Gollo et al. (2014) L. L. Gollo, C. Mirasso, O. Sporns, and M. Breakspear, PLoS Computational Biology 10, e1003548 (2014).
- van Ede et al. (2015) F. van Ede, S. Van Pelt, P. Fries, and E. Maris, Journal of neurophysiology 113, 1556 (2015).
- Brette and Destexhe (2012) R. Brette and A. Destexhe, Handbook of neural activity measurement (Cambridge University Press, 2012).
- Nunez et al. (1997) P. L. Nunez, R. Srinivasan, A. F. Westdorp, R. S. Wijesinghe, D. M. Tucker, R. B. Silberstein, and P. J. Cadusch, Electroencephalography and clinical neurophysiology 103, 499 (1997).
- van den Broek et al. (1998) S. P. van den Broek, F. Reinders, M. Donderwinkel, and M. Peters, Electroencephalography and clinical neurophysiology 106, 522 (1998).
- Klimesch et al. (2007) W. Klimesch, P. Sauseng, and S. Hanslmayr, Brain research reviews 53, 63 (2007).
- Aguilar-Domingo (2013) M. Aguilar-Domingo, Ph.D. thesis, University of Murcia (2013), (in Spanish).
- Barnett and Seth (2014) L. Barnett and A. K. Seth, Journal of neuroscience methods 223, 50 (2014).
- Akaike (1974) H. Akaike, Automatic Control, IEEE Transactions on 19, 716 (1974).
- Lütkepohl (1993) H. Lütkepohl, Introduction to Multiple Time Series Analysis (Springer, Berlin, 1993).