Revisiting the spectral and timing properties of 4U 1909+07 with NuSTAR and Astrosat
Abstract
We present the results obtained from the analysis of high mass X-ray binary pulsar 4U 1909+07 using NuSTAR and Astrosat observations in 2015 and 2017 July, respectively. X-ray pulsations at 604 s are clearly detected in our study. Based on the long term spin-frequency evolution, the source is found to spun up in the last 17 years. We observed a strongly energy-dependent pulse profile that evolved from a complex broad structure in soft X-rays into a profile with a narrow emission peak followed by a plateau in energy ranges above 20 keV. This behaviour ensured a positive correlation between the energy and pulse fraction. The pulse profile morphology and its energy-evolution are almost similar during both the observations, suggesting a persistent emission geometry of the pulsar over time. The broadband energy spectrum of the pulsar is approximated by an absorbed high energy exponential cutoff power law model with iron emission lines. In contrast to the previous report, we found no statistical evidence for the presence of cyclotron absorption features in the X-ray spectra. We performed phase-resolved spectroscopy by using data from the NuSTAR observation. Our results showed a clear signature of absorbing material at certain pulse-phases of the pulsar. These findings are discussed in terms of stellar wind distribution and its effect on the beam geometry of this wind-fed accreting neutron star. We also reviewed the subsonic quasi-spherical accretion theory and its implication on the magnetic field of 4U 1909+07 depending on the global spin-up rate.
keywords:
stars: neutron – pulsars: individual: 4U 1909+07 – X-rays: stars.1 INTRODUCTION
High mass X-ray binaries (HMXBs) are known to consist of a compact object (mostly a neutron star) and a massive (10 ) OB optical companion in a close binary (see, e.g., Lewin et al. 1997; Tauris & van den Heuvel 2006). The material from the companion primarily gets accreted onto the neutron star by falling into its deep gravitation potential. This process releases an enormous amount of energy, mostly in the X-ray range of the electromagnetic spectrum. Depending on the nature of the optical companion, the mass transfer can take place differently between two sub-classes of HMXBs viz. super-giant X-ray binaries and Be/X-ray binaries. The compact object in super-giant X-ray binaries (SGXBs) captures sporadically a small fraction of the stellar wind from its super-giant companion which loses mass at a rate of 10-5 – 10-7 yr-1 (Martínez-Núñez et al., 2017). The luminosity of the compact object reaches as high as 1035 erg s-1 in most of SGXBs. Luminosity with one to three orders of magnitude higher has also been observed from a couple of SGXB systems such as Cen X-3, SMC X-1, and LMC X-4 where a disk-fed accretion via the Roche-lobe overflow occurs (see, e.g., Reig 2011; Walter et al. 2015).
Be/X-ray binary (BeXB) systems represent a majority of the HMXB population. It consists of a neutron star and a non-supergiant donor of OB spectral class that shows hydrogen and helium emission lines at a certain point of its evolution (Reig 2011 for a review). These emission lines are known to originate from an equatorial circumstellar disk formed around the Be star (Porter & Rivinius, 2003). The neutron star in these systems usually revolves in a wide, eccentric orbit and is known to accrete matter from the circumstellar disk. The abrupt mass accretion by the neutron star, at the closest approach (periastron), leads to the occurrence of intense X-ray outbursts with luminosity in the range of 1036–1038 erg s-1 (Naik et al., 2013; Reig & Nespoli, 2013; Wilson-Hodge et al., 2018; Jaisawal et al., 2019).
Strong magnetic field of the neutron stars, with a field strength of B1012 G in HMXBs, guides the accreted matter beyond the magnetospheric radius (Revnivtsev & Mereghetti, 2015). The field lines funnel the plasma onto a confined region at the magnetic poles forming hot spots and accretion columns on the neutron star surface (Basko & Sunyaev, 1975; Nagase, 1989). X-ray pulsations from the neutron star are observed when the hot spot rotates around the spin axis of the system. Pulse profiles of these pulsating neutron stars (pulsars) provide information on emission geometry and also on the distribution of matter in its close proximity. A typical energy spectrum of a pulsar is shaped by thermal and bulk Comptonization processes in the accretion column (Becker & Wolff, 2007; Farinelli et al., 2012) that can be described by an empirical power law model modified with a high energy cutoff (see, e.g., White et al. 1983; Paul & Naik 2011; Caballero & Wilms 2012).
4U 1909+07 (X 1908+075) is a Galactic X-ray source that was discovered by Uhuru in the early seventies (Giacconi et al., 1974; Forman et al., 1978; Wen et al., 2000). The compact object in this system accretes from an OB supergiant companion in a 4.4 days orbit (Wen et al., 2000; Levine et al., 2004; Morel & Grosdidier, 2005). 605 s pulsations detected from the RXTE observations, established the source as an accreting X-ray pulsar (Levine et al., 2004). Using the Doppler delay curves, the orbital parameters of the system such as the inclination (38°–72°), orbital separation (60–80 lt-s), epoch for mean longitude of 90 degrees (52631.383 MJD) along with the mass of the companion (9–31 ) and radius (22 ) were derived by Levine et al. (2004). The optical companion was first thought to be a Wolf-Rayet star based on the X-ray analysis (Levine et al., 2004). Near-infrared observations of the field within the error box of HEAO-1/A3 discovered a late O-type supergiant star (Morel & Grosdidier, 2005). Recently, Martínez-Núñez et al. (2015) studied the H- and K-band infrared spectra of the optical companion using a non-LTE stellar atmosphere code and found the donor properties are mainly consistent with an early B-type (B0–B3) star. These authors also estimated the following donor parameters such as the stellar mass 156 , radius 16 , the effective temperature T∗ = 23.0 K, luminosity log(L/) = 4.810.25, and the terminal wind velocity = 500100 km s-1. The source distance is known to be 4.850.5 kpc depending on the extinction curve (Martínez-Núñez et al., 2015).
Long term timing studies showed that the spin period of the pulsar changes erratically on years time scale. It is only possible when mass accretion through the capture of stellar wind occurs in the system (Fürst et al., 2011, 2012). A similar conclusion was drawn based on the detection of the Compton shoulder in the iron fluorescence line. Such a line feature appears when the Compton thick medium surrounds the accreting object (Torrejón et al., 2010). The pulse profile of the pulsar is known to be strongly energy dependent. It evolves from a broad structure in soft X-rays to a narrow peak at higher energies (Fürst et al., 2011, 2012; Jaisawal et al., 2013). Broad-band energy spectrum of the pulsar is consistent with an absorbed high energy cutoff power law model along with a blackbody component (Fürst et al., 2011, 2012; Jaisawal et al., 2013). Based on a possible/tentative detection of cyclotron absorption line at 44 keV (Jaisawal et al., 2013), the magnetic field of the neutron star is estimated to be 3.81012 G. Superorbital modulation at a period of 15.2 days is also known from the system (Corbet & Krimm, 2013).
In the present paper, we study the pulse profile and spectral evolution of 4U 1909+07 using NuSTAR and Astrosat observations in 2015 and 2017 July, respectively. We examine the distribution of stellar wind during these monitorings. The spin period evolution of the pulsar is also studied based on the long term measurements. The details of the observations, results, discussion, and conclusion are summarized in Section 2, 3, and 4, respectively.
| Observatory/ | ObsID | Start Date | Expo. |
|---|---|---|---|
| Instrument | (MJD) | (ks) | |
| NuSTAR | 30101050002 | 57204.65 | 41.3 |
| Swift/XRT | 00081661001 | 57205.38 | 1.7 |
| Astrosat | A03_114T01_9000001390 | 57951.27 | 30.3 |
.
2 Observations and Data Analysis
2.1 NuSTAR and Swift
NuSTAR is a first hard X-ray focusing observatory that was launched by NASA in 2012 June (Harrison et al., 2013). It is sensitive in 3–79 keV energy range and reflects the photons at grazing angle incidence. NuSTAR consists of two multi-layer coated focal plane mirror modules, named as FPMA and FPMB. 4U 1909+07 was observed with NuSTAR on 2015 July 01 for exposure of 41.3 ks (Table 1). Standard procedures were followed to analyze the raw data with the help of NuSTARDAS 1.6.0 software in HEASoft version 6.24. We reprocessed unfiltered events from the FPMA and FPMB by using nupipeline routine and updated CALDB of version 20191219. We then extracted source products by selecting a circular region of 150 arcsec radius with the source co-ordinates as the center, in the DS9 image of cleaned events, using the nuproducts task. The background light curves and spectra were accumulated in a similar manner by selecting a source-free circular region of 150 arcsec radius. 4U 1909+07 was also monitored by Swift/XRT on 2015 July 02 for an effective exposure of 1.7 ks in photon counting mode. We considered Swift observation for contemporary spectral analysis with NuSTAR. The XRT data are processed by using the online standard tools provided by the UK Swift Science Data Centre111http://www.swift.ac.uk/user_objects/ (Evans et al., 2009). For timing analysis, the light curves from FPMA and FPMB units of NuSTAR were combined in our study.
2.2 Astrosat
Astrosat is the first Indian astronomical mission launched by ISRO in September 2015 (Agrawal, 2006). It is capable of observing stellar sources in multi-wavelength bands by using five sets of instruments such as Soft X-ray Telescope (SXT; Singh et al. 2017), Large Area X-ray Proportional Counters (LAXPCs; Agrawal et al. 2017; Antia et al. 2017), Cadmium Zinc Telluride Imager (CZTI; Rao et al. 2017), a Scanning Sky Monitor (SSM; Ramadevi et al. 2018), and Ultraviolet Imaging Telescope (UVIT; Tandon et al. 2017). Astrosat observed 4U 1909+07 on 2017 July 17 for an effective exposure of 30.3 ks. In the present study, we used data from the SXT and LAXPC instruments as the source was very faint for the CZTI. The UVIT was not operational during the observation. The SXT is a soft X-ray focusing telescope consisting of a CCD detector sensitive in a 0.3-8 keV energy range. We reprocessed the SXT data by using standard pipeline and merging tool sxtevtmergertool provided by Astrosat Science Support Cell (ASSC222http://astrosat-ssc.iucaa.in/). The source spectrum was extracted thereafter using XSELECT package by considering a circular region of 4 arcmin radius with source coordinates as centre, on the SXT CCD chip. The background spectrum was obtained from a blank sky observation. The LAXPC is the primary X-ray instrument onboard Astrosat which is sensitive to photons in a 3-80 keV energy range. It consists of three identical units providing a total effective area of 6000 cm2 at 15 keV. In our study, the raw event analysis mode data are reprocessed through the standard routines available in LAXPCsoftware. We used this package to create source light curves and spectral products. The same observation was considered for the LAXPC background during the Earth occultation period. For timing studies, we have combined the light curves from LAXPC10 & 20 in our analysis. The data from LAXPC30 are not used due to drastic change in the instrument gain.
3 Results
3.1 Timing analysis
Using the orbital ephemeris of the binary system as reported by Levine et al. (2004), we found that the pulsar was observed in 0.215–0.437 and 0.87–0.05 phase ranges of the 4.4 days binary orbit with NuSTAR and Astrosat observatories, respectively. Background subtracted light curves obtained from these observations are shown in Figure 1. Flare-like features can be seen in the soft and hard X-ray light curves (top two panels in each side of the figure) as generally seen in the light curves of other SGXBs due to inhomogeneous mass accretion from the stellar wind of the companion star (see, e.g., Naik et al. 2011; Odaka et al. 2013). Bottom panel in each side of the figure represents the hardness ratio (HR) which is defined as the ratio between the hard X-ray (10-79 keV range for NuSTAR data and 10-80 keV range for Astrosat/LAXPC data) and soft X-ray (3-10 keV range) light curves. Though we observe several flare-like features in the soft and hard X-ray light curves, the HRs remain almost constant throughout these monitoring. This suggests that the spectral shape of the pulsar was unchanged during the NuSTAR and Astrosat observations.
We searched for pulsation in the X-ray light curves by using the -maximization technique (Leahy, 1987). The barycentric corrected pulse period of the neutron star was estimated to be 604.10.15 s and 603.60.1 s from the NuSTAR and Astrosat light curves binned at a time resolution of 0.1 s, respectively. The errors in the pulse period are estimated for a 1 confidence interval.
Pulsation periods and the associated uncertainties were also calculated by fitting the pulse times of arrival (TOA) with a timing model. We followed the methodology described by Ray et al. (2011), that has been applied to other HMXB pulsars (Ray et al., 2019b; Vasilopoulos et al., 2019, 2020). We subdivided the data into 10-20 intervals and generated TOAs by comparing the pulse profile of each interval with a template profile. We fitted the TOAs to a timing model with constant period. The best pulse period is consistent with the main peak found with the epoch folding method, while uncertainties were found to be of the order of 0.06-0.1 s. Nevertheless, the solution has some timing residuals likely caused by changes of the pulse profile within each observation.
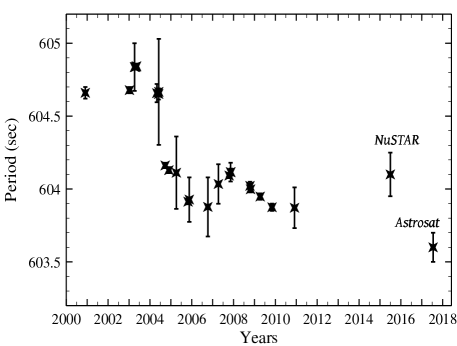
Long term spin period evolution of 4U 1909+07 is given in Figure 2. The spin periods of the pulsar at earlier epochs were taken from Levine et al. (2004), Fürst et al. (2011), Fürst et al. (2012), and Jaisawal et al. (2013) using RXTE, INTEGRAL, and Suzaku data. We also included our pulse period measurements in the figure that clearly signifies a global spin-up trend of the pulsar since its discovery, though a sharp drop in the period has been observed during 2004–2005. The pulse period is effectively changed from 604.7 s to 603.6 s between 2001–2017 resulting an average spin-up rate of 1.7110-9 s s-1.
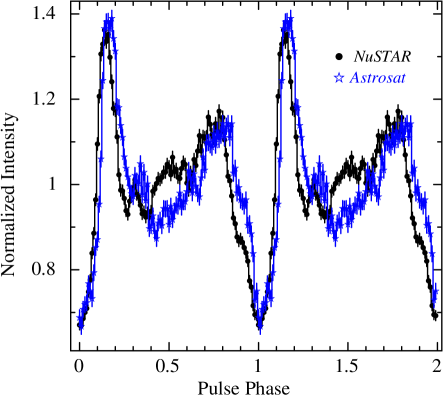
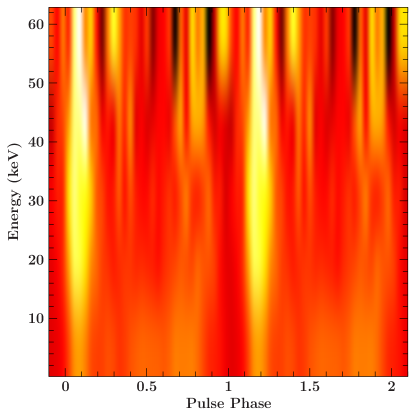
Following the estimation of spin period of 4U 1909+07, the light curves from NuSTAR (FPMA+FPMB) and added light curves of LAXPC10 and LAXPC20 of Astrosat are folded with respective periods to obtain corresponding pulse profiles. The pulse profiles of the pulsar with 100 phase bins per period, obtained from both the data sets are shown in Figure 3. The observed pulse morphology shows a narrow emission peak at around 0.1 phase, followed by a broad structure at other pulse phases. The emission geometry appears to be similar during the 2015 and 2017 observations, though marginal differences can be spotted at certain pulse phases, especially at 0.5 phase, see Figure 3. To understand the energy evolution of the emission geometry, the energy resolved pulse profiles are generated and shown in Figure 4. Using NuSTAR data, we observed a broad profile below 7 keV that evolves into a narrow emission peak, followed by a plateau like structure at higher energies (left side of Figure 4). The color-coded pulse profile map shows this variation clearly (Figure 5). This map is generated by using ISISscripts333http://www.sternwarte.uni-erlangen.de/isis/. The color in the map represents the normalized intensity of the pulse profiles ranging from red (low) to white (high). A similar kind of pulse profile evolution is also detected during the Astrosat observation with a clear difference above 30 keV (right side of Figure 4). This difference in the hard X-ray pulse profiles possibly arises due to the faintness of the source at hard X-rays, combined with the presence of a systematic uncertainty in the LAXPC background measurement beyond 30 keV (refer to Antia et al. 2017; Misra et al. 2017 for information on the LAXPC background).
We define the pulse fraction (PF) of the pulsar in the following manner -
| (1) |
where Fmax and Fmin correspond to maximum and minimum intensities observed in the profile, respectively. During both the observations, the average values of the PF are found to be 32%. To evaluate the changes in PF with energy, we investigated the energy resolved profiles and estimated corresponding pulse fraction which are shown in Figure 6. It can be seen that the PF values increase with energy as seen in several other accretion powered X-ray pulsars (Lutovinov & Tsygankov, 2009; Jaisawal et al., 2018). The PF of the pulsar 4U 1909+07, estimated from the NuSTAR and Astrosat observations are comparable up to 30 keV, beyond which the PF values from Astrosat observation decreased significantly (Figure 6). This is possibly due to the presence of systematics in the LAXPC background measurements at high energies (as mentioned earlier).

3.2 Pulse-phase-averaged spectroscopy
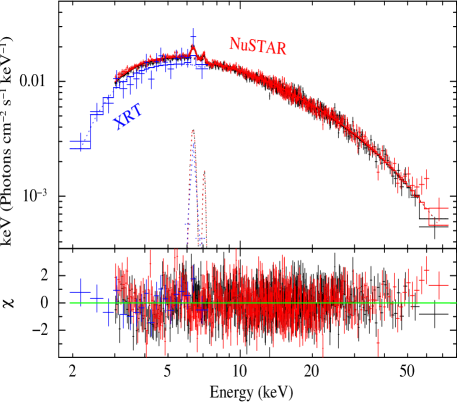
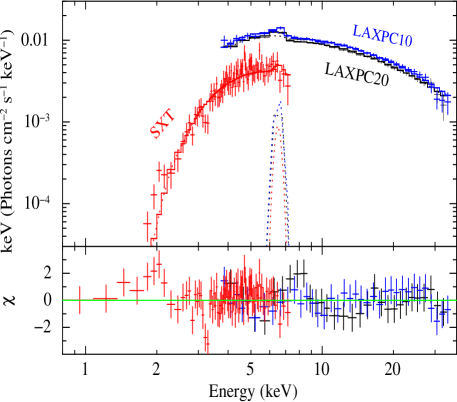
The energy spectrum of 4U 1909+07 is investigated to understand its emission characteristics during the NuSTAR, Swift, and Astrosat observations. Standard empirical models were chosen to fit the broadband spectrum of the pulsar in XSPEC package (Arnaud, 1996). The 1-79 keV spectrum of the pulsar from Swift/XRT and NuSTAR is considered in our analysis. We also fitted the 1-35 keV energy continuum by using the data from SXT and LAXPC10 & 20 instruments on-board Astrosat. We found that an absorbed high energy cutoff power law model444https://heasarc.gsfc.nasa.gov/xanadu/xspec/manual/Models.html describes these spectra well with the goodness of fit per degree of freedom = 1 in each case (Figures 7 & 8). In the fitting, the contribution for local and interstellar medium absorption observed along the source direction is expressed by TBabs component (Wilms et al., 2000). We also detected iron fluorescence lines at 6.4 and 7.1 keV in the NuSTAR spectrum of the source. Any signature of cyclotron absorption line is not found in these observations. Best fitting spectral parameters are given in Table LABEL:table2. Except for the absorption column density, other components like photon index, folding and cutoff energies are consistent (within the errors) between the 2015 and 2017 data. 4U 1909+07 is found to be strongly obscured owing to a larger column density , in addition to the interstellar absorption of 1.211022 cm-2 along the source direction (HI4PI Collaboration et al., 2016). We estimated the total flux using convolution model in this paper. For a source distance of 4.85 kpc, the 1-80 keV luminosity of the pulsar is measured to be 1.67 and 1.241036 erg s-1 during 2015 and 2017 observations, respectively.
| Parameters | NuSTAR +Swift | Astrosat |
|---|---|---|
| HECut | HECut | |
| NHa | 10.10.5 | 183 |
| Photon index | 1.520.04 | 1.50.3 |
| Ecut (keV) | 8.00.3 | 73 |
| Efold (keV) | 261 | 238 |
| Emission lines | ||
| Line energy (keV) | 6.360.03 | 6.5 |
| Eq. width (eV) | 9014 | 15466 |
| Line energy (keV) | 7.10.1 | – |
| Eq. width (eV) | 2710 | – |
| Source fluxb | ||
| Flux (1-30 keV) | 4.930.05 | 3.70.2 |
| Flux (1-80 keV) | 5.920.06 | 4.40.3 |
| () | 1.12 (1001) | 0.91 (143) |

3.3 Pulse-phase-resolved spectroscopy
To investigate the changes in local accreting environment of the pulsar and its effect on the emission geometry, phase-resolved spectroscopy is performed by using the NuSTAR data. We extracted pulse-phase resolved spectra in a total of 10 phase bins. Considering appropriate backgrounds, response matrices, and effective areas, the 3-79 keV spectra obtained from FPMA and FPMB detectors are fitted with an absorbed HECut model. In the fitting, we fixed the width of iron lines at the corresponding values obtained from phase-averaged spectroscopy (Table LABEL:table2). We found that the above model can describe each spectrum well with the value of close to 1.
Figure 9 shows the pulse-phase evolution of spectral parameters such as absorption column density, photon index, folding energy, high energy cutoff, and the source flux. The varies between 5 and 151022 cm-2 and is observed to be significantly larger than the expected interstellar absorption (1.211022 cm-2) along the line of sight. This high value of column density is detected across all pulse-phases of the pulsar, except at 0.1–0.2 phase that coincides with the narrow emission peak in the profile. Corresponding to the changes in the photon index, the spectrum gets softer in the plateau region of the pulse profile. A harder spectrum with a photon index of 1 is detected at 0.1–0.2 pulse-phase of the pulsar. Besides a higher value of the folding energy at a single phase bin (Figure 9), the parameters such as cutoff and folding energies are almost constant (within the error bars) with the pulsar rotation. The change in 3-79 keV source flux with pulse-phase ranges is found to be consistent with the shape of the pulse profile in the same energy range.
4 Discussion and Conclusions
We have presented the long term spin period evolution of 4U 1909+07 using the measurements provided by Fürst et al. (2011, 2012), and Jaisawal et al. (2013) along with the recent NuSTAR and Astrosat observations in this decade. The pulse period of the pulsar has been found to be in globally decline since its discovery (Figure 2). The long term evolution also consists of local fluctuation that is considered as a random walk like behavior (Fürst et al., 2011). In the case of wind accreting sources like Vela X-1 (Deeter et al., 1989), such behaviour signifies the absence of a persistent accretion disk. However in case of 4U 1909+07, the observed net changes in the pulsar period from 604.7 s to 603.6 s during 2001–2017 (Figure 2), the presence of transient accretion disk can not be entirely ruled out.
4.1 Magnetic field strength of the neutron star
The strength of magnetic field of a neutron star (pulsar) can be directly estimated through the detection of cyclotron resonance scattering features in the broadband spectrum. However, there are only about 35 X-ray pulsars in the spectra of which such features are detected (Jaisawal & Naik, 2017; Staubert et al., 2019). In the absence of cyclotron features, however, there are alternative methods such as based on the evolution of the spin period or by determining the propeller regime through which the strength of the pulsar magnetic field has been estimated (Ghosh & Lamb 1979; Tsygankov et al. 2016). We can calculate the magnetic field of a pulsar based on the magnetospheric plasma interaction and the spin period evolution. The accreted material carries angular momentum that exerts a torque on the neutron star magnetosphere when the coupling happens at the boundary (Ghosh & Lamb, 1979). The neutron star gets spin-up or spin-down depending on the nature of the net torque applied to the magnetosphere. The accretion in the binary system usually takes place through the formation of an accretion disk under Roche-Lobe overflow or through the capture of stellar wind from the companion star. In case of disk accretion, the specific angular momentum of matter exceeds the Keplerian specific angular momentum close to Alfvén or magnetospheric radius. For stellar wind accretion, the specific angular momentum of the captured material is considered to be significantly low, thus leading the material to fall straight on the neutron star magnetosphere without any disk-formation (Ho et al., 1989; Frank et al., 2002).
Two types of quasi-spherical wind accretion onto the neutron stars are expected (Shakura et al., 2012, 2018). The supersonic quasi-spherical accretion, also known as the Bondi-Hoyle-Littleton accretion, occurs when the accreting shocked plasma rapidly cools down and falls supersonically towards the magnetosphere. The subsonic quasi-spherical accretion is possible in slow rotating magnetized neutron star with X-ray luminosity 41036 erg s-1where the accreted plasma remains hot at the magnetospheric boundary, (Shakura et al., 2012). In the latter case, the material forms a hot quasi-static shell around the rotating neutron star magnetosphere in process of setting subsonically. This shell mediates the angular momentum transfer to- or from the neutron star by large-scale convective turbulent structures. The spin-up or spin-down of the neutron stars are expected to observe depending on the sign of angular velocity difference between the magnetosphere and the accreting material. The model can successfully explain the secular spin variation of the pulsar along with any irregular short-term frequency fluctuations.
.
We apply the quasi-spherical settling accretion theory estimating the magnetic field of 4U 1909+07 from the applied torque. According to the theory (Shakura et al. 2012; Equation 4 of Postnov et al. 2015), the spin-up rate is
| (2) |
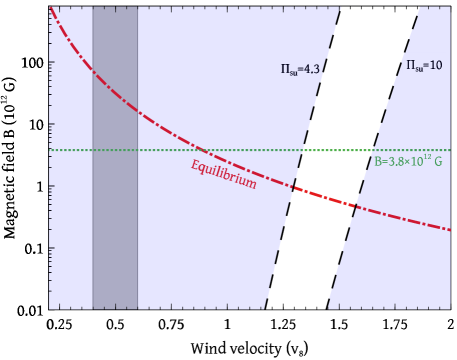
here the spin rate is measured to be 2.5610-9[Hz d-1] for 4U 1909+07. is a system independent dimensionless parameter of the theory ranging between 4.3 and 10 (Shakura et al., 2012; Postnov et al., 2015; Shakura et al., 2018). The dipole magnetic moment of the neutron star is =/1030[G cm3] and is related to the magnetic field (B) by expression =BR3/2 (the neutron star radius R is assumed to be 10 km). The parameter v8 is the stellar wind velocity in the unit of 108[cm s-1]. The mass accretion rate =/1016[g s-1] is estimated to be =0.69 for the source luminosity of 1.241036 erg s-1at 20% accretion efficiency. The orbital period Pb of the system is 4.4 d. In this regime, the magnetic field strongly depends on the wind velocity that has been estimated to be 500100 km s-1for 4U 1909+07 (Martínez-Núñez et al., 2015). We found that the settling model requires approximately three times higher wind velocity for 4U 1909+07 between 1300–1500 km s-1to get a magnetic field in a range of 1012–1014 G (white region in Figure 10) for a given value of . We can not adequately determine the magnetic field using Equation 2 of the settling accretion theory.
We notice that the observed source luminosity is stable at 1036 erg s-1during each X-ray observations so far. Despite the variation in spin period, considering an extreme case, we may assume the pulsar is accreting close to its equilibrium spin period that is :
| (3) |
The above equation is adopted from Shakura et al. (2012) & Postnov et al. (2015). Considering the wind velocity between 400–600 km s-1and the observed mass accretion rate, the spin equilibrium magnetic field can be estimated to be 1013 G (red curve in Figure 10). The inferred value is within a factor of five times higher than the polar magnetic field (7.61012 G – twice the equatorial field) inferred from the tentative detection of cyclotron line by Jaisawal et al. (2013) which has not yet been re-confirmed. The measurement appears to be reasonable, given many theoretical uncertainties, as well as the fact that the pulsar is not strictly at equilibrium due to changes in the spin frequency.
4.2 Pulse profile and spectroscopy
We examine the emission geometry of the pulsar using the NuSTAR and Astrosat observations in 2015 July and 2017 July, respectively. This is done by studying the pulse profiles that strongly depend on the energy. We observed a complex, broad profile in soft X-rays that evolves into a narrow emission peak followed by plateau like structure in hard X-rays. Almost similar energy evolution and pulse morphology were detected in the earlier studies (Fürst et al., 2011, 2012; Jaisawal et al., 2013). The existence of anomalous pulse profiles at several epochs advocates the persistent emission geometry of the pulsar. Even so, the marginal difference in the profile morphology exists that possibly led by the local variation in column density and distribution of the stellar wind across the binary orbit.
The emission from one or both the poles of the neutron star produces a relatively complex pulse profile depending on the geometrical and gravitation effects (Kraus et al., 1995; Bulik et al., 2003; Lutovinov & Tsygankov, 2009; Sasaki et al., 2012). The absorption of soft X-ray photons emitted from the accretion column by the accreting material complicates the profile further. Sometimes this material influences the direct pulsar emission so much that multiple absorption dips are observed at definite pulse phases of the pulsar. Such dips have been frequently seen in the pulse profiles of Be/X-ray binary pulsars during X-ray outbursts (see e.g., Maitra et al. 2012; Naik et al. 2013; Jaisawal et al. 2016; Ferrigno et al. 2016; Epili et al. 2017; Gupta et al. 2018). In the present study, the accretion columns at both the poles of the pulsar contribute as the pulse profiles below 10 keV are seen to be double-peaked. We observed a narrow emission peak in a 0.1–0.2 phase range of the pulse profile at higher energies. The detection of high pulse fraction (about 50%) above 20 keV is expected from a narrow emission region (Figure 3).
The energy spectrum of pulsars originates from thermal and bulk Comptonization physical processes in the accretion column (Becker & Wolff, 2007). The emission from 4U 1909+07 can be described by an absorbed HECut model as seen during the 2015 and 2017 observations. The spectral parameters are consistent during these observations, except the value of the column density. is detected to be high 181022 cm-2 during the Astrosat observation, covering 0.87–0.05 orbital phase range. We also observed a relatively lower value of column density 101022 cm-2 using NuSTAR and XRT data obtained in 0.215–0.437 orbital phase range. These variations are in agreement with the findings by Levine et al. (2004). The authors also found a strong increase in below 0.12 orbital phase. The orbital changes in the column density can be explained by considering the movement of the neutron star through the inhomogeneously distributed stellar wind. To probe the wind distribution further, we performed phase-resolved spectroscopy using NuSTAR data in 2015. We detected a phase variation in the which likely affects the X-ray emission from the accretion column. The is found to be three times higher in the plateau region of the pulse profile as opposed to the value observed at 0.1–0.2 pulse phase. A narrow emission peak is clearly present 0.1–0.2 pulse phase range when the column density is low.
The cyclotron absorption line is understood to originate from the resonant scattering of photons with the electrons in the quantized Landau levels (Meszaros, 1992). These features are observed in the 10–100 keV energy range of pulsar spectrum corresponding to a magnetic field of 1012–1013 Gauss, based on the 12-B-12 rule (Jaisawal & Naik, 2017; Staubert et al., 2019). A cyclotron line was tentatively observed at 44 keV in 4U 1909+07 using the Suzaku data (Jaisawal et al., 2013). However, in the present study, any signature of a cyclotron absorption line in phase-averaged and phase-resolved spectroscopy of the pulsar spectrum is not detected. The spin-equilibrium magnetic field can match the polar B-strength provided by cyclotron line within a factor of 5, possibly due to the theoretical uncertainties in the calculation. Future longer exposure observations with instruments like NuSTAR, Astrosat, and the proposed STROBE-X mission (Ray et al., 2019a) could confirm the detection/ non-detection of a cyclotron absorption feature in 4U 1909+07.
ACKNOWLEDGMENTS
We thank the anonymous referee for constructive suggestions on the paper. This research has made use of data obtained through HEASARC Online Service, provided by the NASA/GSFC, in support of NASA High Energy Astrophysics Programs. This work used the NuSTAR Data Analysis Software (NuSTARDAS) jointly developed by the ASI Science Data Center (ASDC, Italy) and the California Institute of Technology (USA). This publication uses the data from the Astrosat mission of the Indian Space Research Organisation (ISRO), archived at the Indian Space Science Data Centre (ISSDC). We thank members of SXT, LAXPC, and CZTI instrument teams for their contribution to the development of the instruments and analysis software. We also acknowledge the contributions of the Astrosat project team at ISAC and IUCAA. S.N. and N.K. acknowledge the supports from Physical Research Laboratory which is funded by the Department of Space, Government of India. This research has made use of ISIS functions (ISISscripts) provided by ECAP/Remeis observatory and MIT (http://www.sternwarte.uni-erlangen.de/isis/)
DATA AVAILABILITY
We used archival data of NuSTAR, Swift, and Astrosat observatories for this work.
References
- Agrawal (2006) Agrawal P. C., 2006, Advances in Space Research, 38, 2989
- Agrawal et al. (2017) Agrawal P. C., et al., 2017, Journal of Astrophysics and Astronomy, 38, 30
- Antia et al. (2017) Antia H. M., et al., 2017, ApJS, 231, 10
- Arnaud (1996) Arnaud K. A., 1996, in Jacoby G. H., Barnes J., eds, Astronomical Society of the Pacific Conference Series Vol. 101, Astronomical Data Analysis Software and Systems V. p. 17
- Basko & Sunyaev (1975) Basko M. M., Sunyaev R. A., 1975, Astronomy and Astrophysics, 42, 311
- Becker & Wolff (2007) Becker P. A., Wolff M. T., 2007, ApJ, 654, 435
- Bulik et al. (2003) Bulik T., Gondek-Rosińska D., Santangelo A., Mihara T., Finger M., Cemeljic M., 2003, A&A, 404, 1023
- Caballero & Wilms (2012) Caballero I., Wilms J., 2012, Memorie della Societa Astronomica Italiana, 83, 230
- Corbet & Krimm (2013) Corbet R. H. D., Krimm H. A., 2013, ApJ, 778, 45
- Deeter et al. (1989) Deeter J. E., Boynton P. E., Lamb F. K., Zylstra G., 1989, ApJ, 336, 376
- Epili et al. (2017) Epili P., Naik S., Jaisawal G. K., Gupta S., 2017, MNRAS, 472, 3455
- Evans et al. (2009) Evans P. A., et al., 2009, MNRAS, 397, 1177
- Farinelli et al. (2012) Farinelli R., Ceccobello C., Romano P., Titarchuk L., 2012, A&A, 538, A67
- Ferrigno et al. (2016) Ferrigno C., Pjanka P., Bozzo E., Klochkov D., Ducci L., Zdziarski A. A., 2016, A&A, 593, A105
- Forman et al. (1978) Forman W., Jones C., Cominsky L., Julien P., Murray S., Peters G., Tananbaum H., Giacconi R., 1978, The Astrophysical Journal Supplement Series, 38, 357
- Frank et al. (2002) Frank J., King A., Raine D. J., 2002, Accretion Power in Astrophysics: Third Edition
- Fürst et al. (2011) Fürst F., Kreykenbohm I., Suchy S., Barragán L., Wilms J., Rothschild R. E., Pottschmidt K., 2011, A&A, 525, A73
- Fürst et al. (2012) Fürst F., Pottschmidt K., Kreykenbohm I., Müller S., Kühnel M., Wilms J., Rothschild R. E., 2012, A&A, 547, A2
- Ghosh & Lamb (1979) Ghosh P., Lamb F. K., 1979, ApJ, 234, 296
- Giacconi et al. (1974) Giacconi R., Murray S., Gursky H., Kellogg E., Schreier E., Matilsky T., Koch D., Tananbaum H., 1974, The Astrophysical Journal Supplement Series, 27, 37
- Gupta et al. (2018) Gupta S., Naik S., Jaisawal G. K., Epili P. R., 2018, MNRAS, 479, 5612
- HI4PI Collaboration et al. (2016) HI4PI Collaboration et al., 2016, A&A, 594, A116
- Harrison et al. (2013) Harrison F. A., et al., 2013, ApJ, 770, 103
- Ho et al. (1989) Ho C., Taam R. E., Fryxell B. A., Matsuda T., Koide H., 1989, MNRAS, 238, 1447
- Jaisawal & Naik (2017) Jaisawal G. K., Naik S., 2017, in Serino M., Shidatsu M., Iwakiri W., Mihara T., eds, 7 years of MAXI: monitoring X-ray Transients, held 5-7 December 2016 at RIKEN. p. 153 (arXiv:1705.05536)
- Jaisawal et al. (2013) Jaisawal G. K., Naik S., Paul B., 2013, ApJ, 779, 54
- Jaisawal et al. (2016) Jaisawal G. K., Naik S., Epili P., 2016, MNRAS, 457, 2749
- Jaisawal et al. (2018) Jaisawal G. K., Naik S., Chenevez J., 2018, MNRAS, 474, 4432
- Jaisawal et al. (2019) Jaisawal G. K., et al., 2019, ApJ, 885, 18
- Kraus et al. (1995) Kraus U., Nollert H. P., Ruder H., Riffert H., 1995, ApJ, 450, 763
- Leahy (1987) Leahy D. A., 1987, A&A, 180, 275
- Levine et al. (2004) Levine A. M., Rappaport S., Remillard R., Savcheva A., 2004, The Astrophysical Journal, 617, 1284
- Lewin et al. (1997) Lewin W. H. G., van Paradijs J., van den Heuvel E. P. J., 1997, X-ray Binaries
- Lutovinov & Tsygankov (2009) Lutovinov A. A., Tsygankov S. S., 2009, Astronomy Letters, 35, 433
- Maitra et al. (2012) Maitra C., Paul B., Naik S., 2012, MNRAS, 420, 2307
- Martínez-Núñez et al. (2015) Martínez-Núñez S., Sander A., Gímenez-García A., Gónzalez-Galán A., Torrejón J. M., Gónzalez-Fernández C., Hamann W. R., 2015, A&A, 578, A107
- Martínez-Núñez et al. (2017) Martínez-Núñez S., et al., 2017, Space Sci. Rev., 212, 59
- Meszaros (1992) Meszaros P., 1992, High-energy radiation from magnetized neutron stars
- Misra et al. (2017) Misra R., et al., 2017, ApJ, 835, 195
- Morel & Grosdidier (2005) Morel T., Grosdidier Y., 2005, MNRAS, 356, 665
- Nagase (1989) Nagase F., 1989, PASJ, 41, 1
- Naik et al. (2011) Naik S., Paul B., Ali Z., 2011, ApJ, 737, 79
- Naik et al. (2013) Naik S., Maitra C., Jaisawal G. K., Paul B., 2013, ApJ, 764, 158
- Odaka et al. (2013) Odaka H., Khangulyan D., Tanaka Y. T., Watanabe S., Takahashi T., Makishima K., 2013, ApJ, 767, 70
- Paul & Naik (2011) Paul B., Naik S., 2011, Bulletin of the Astronomical Society of India, 39, 429
- Porter & Rivinius (2003) Porter J. M., Rivinius T., 2003, PASP, 115, 1153
- Postnov et al. (2015) Postnov K. A., Mironov A. I., Lutovinov A. A., Shakura N. I., Kochetkova A. Y., Tsygankov S. S., 2015, MNRAS, 446, 1013
- Ramadevi et al. (2018) Ramadevi M. C., et al., 2018, Journal of Astrophysics and Astronomy, 39, 11
- Rao et al. (2017) Rao A. R., Bhattacharya D., Bhalerao V. B., Vadawale S. V., Sreekumar S., 2017, Current Science, 113, 595
- Ray et al. (2011) Ray P. S., et al., 2011, ApJS, 194, 17
- Ray et al. (2019a) Ray P. S., et al., 2019a, arXiv e-prints, p. arXiv:1903.03035
- Ray et al. (2019b) Ray P. S., et al., 2019b, ApJ, 879, 130
- Reig (2011) Reig P., 2011, Ap&SS, 332, 1
- Reig & Nespoli (2013) Reig P., Nespoli E., 2013, A&A, 551, A1
- Revnivtsev & Mereghetti (2015) Revnivtsev M., Mereghetti S., 2015, Space Sci. Rev., 191, 293
- Sasaki et al. (2012) Sasaki M., Müller D., Kraus U., Ferrigno C., Santangelo A., 2012, A&A, 540, A35
- Shakura et al. (2012) Shakura N., Postnov K., Kochetkova A., Hjalmarsdotter L., 2012, MNRAS, 420, 216
- Shakura et al. (2018) Shakura N., Postnov K., Kochetkova A. r., Hjalmarsdotter L., 2018, Quasi-Spherical Subsonic Accretion onto Magnetized Neutron Stars. p. 331, doi:10.1007/978-3-319-93009-1_7
- Singh et al. (2017) Singh K. P., et al., 2017, Journal of Astrophysics and Astronomy, 38, 29
- Staubert et al. (2019) Staubert R., et al., 2019, A&A, 622, A61
- Tandon et al. (2017) Tandon S. N., et al., 2017, AJ, 154, 128
- Tauris & van den Heuvel (2006) Tauris T. M., van den Heuvel E. P. J., 2006, Formation and evolution of compact stellar X-ray sources. pp 623–665
- Torrejón et al. (2010) Torrejón J. M., Schulz N. S., Nowak M. A., Kallman T. R., 2010, ApJ, 715, 947
- Tsygankov et al. (2016) Tsygankov S. S., Lutovinov A. A., Doroshenko V., Mushtukov A. A., Suleimanov V., Poutanen J., 2016, A&A, 593, A16
- Vasilopoulos et al. (2019) Vasilopoulos G., Petropoulou M., Koliopanos F., Ray P. S., Bailyn C. B., Haberl F., Gendreau K., 2019, MNRAS, 488, 5225
- Vasilopoulos et al. (2020) Vasilopoulos G., et al., 2020, MNRAS, 494, 5350
- Walter et al. (2015) Walter R., Lutovinov A. A., Bozzo E., Tsygankov S. S., 2015, Astronomy and Astrophysics Review, 23, 2
- Wen et al. (2000) Wen L., Remillard R. A., Bradt H. V., 2000, The Astrophysical Journal, 532, 1119
- White et al. (1983) White N. E., Swank J. H., Holt S. S., 1983, ApJ, 270, 711
- Wilms et al. (2000) Wilms J., Allen A., McCray R., 2000, ApJ, 542, 914
- Wilson-Hodge et al. (2018) Wilson-Hodge C. A., et al., 2018, ApJ, 863, 9