Study of the contribution of long-wave bending vibrations to the destruction of ultrathin films by the method of molecular dynamics
Abstract
The molecular dynamics method is used to study the process of development of dynamic instability of a thin film, leading to its destruction. The calculations are performed for a thin (5 atomic layers) aluminum film using the interatomic interaction potential tested by comparing the numerical results with the analytical ones obtained in the framework of elasticity theory. For this purpose, an original approach is developed, which allows one to calculate the dispersion law of long-wave phonons in ultrathin films using the molecular dynamics method. The temperatures () at which the system remains stable over a time interval of are found. This makes it possible to analyze the low-frequency part of the spectrum down to the minimum frequency (at ), and to determine the vibration frequency of the longest, for this problem geometry, bending wave which decreases with increasing temperature, hence, its period grows. Once the vibration period of this mode becomes comparable with the time of simulation, there occurs, during calculation, a continuous increase in the amplitude of this mode which will be referred to as “retarded mode”. It is shown that the film destruction begins with the attainment of a certain critical value of the bending wave amplitude.
Keywords: Molecular dynamics method; metastable state; Fourier transform; dispersion law of thin-film vibrations; “retarded mode”.
1 Introduction
Recently, much attention has been paid to the study of metastable nanofilms with unique properties that are finding ever new industrial applications. One of the main tasks facing the researchers is to increase their stability, since numerous experiments on the synthesis of ultrathin (of several atomic layers) films show that such films in the free state are unstable: they curl up, bend or even collapse [1, 2, 3, 4]. To solve this problem, it is necessary to understand which changes in the system are indicative of a loss of stability, and to discover the factors responsible for this process.
When describing structural transitions in bulk crystals, as a rule, the concept of dynamic stability is used, according to which the dynamic matrix of a stable phase should be positively definite [5]. When moving to the phase boundary, at some point of the Brillouin zone, there arises a phonon mode whose frequency tends to zero in approaching the interface, and the dynamic matrix ceases to be positive definite. Atomic displacements in this phonon mode describe the process of phase transition at the microscopic level in real space [6, 7]. This approach is confirmed by experimental data obtained by the methods of neutron scattering [8] and Raman spectroscopy [9]. The lifetime of thin crystalline films in the free state is too short for such experiments. One could suppose that for small times it is promising to use the method of molecular dynamics (MMD) which makes it possible to consider a detailed microscopic picture of the movement of large atomic systems on small time intervals. However, the MMD calculations must first be tested by comparing them with the known physical characteristics of the modeled objects, in order to make sure of the description validity. When simulating the thermodynamic properties of bulk systems, the calculated and experimentally determined density of phonon states are usually compared. We think that in the absence of experimental data, testing can be carried out by a comparison with the results obtained in other widely-accepted approaches. In this work, a method is suggested that allows testing the results of MD calculations of the thin film dynamics by comparing them with the analytical results obtained in the framework of the elasticity theory. Since in the elasticity theory the dynamics of a crystalline system is described only in the long-wavelength limit, this approach does not require calculating the density of phonon states, but it calls for a more thorough analysis of the low-frequency portion of the vibrational spectrum of individual atoms of the system. The paper presents an original technique for calculating the long-wavelength region of the phonon dispersion law in thin films by the MD method, which is based on a preliminary analysis of the vibration symmetry of the film atoms.
The performed symmetry analysis makes it possible to unambiguously establish to which branch of the phonon spectrum belong the considered vibrations of frequency , and to find the wavelength of the corresponding phonon, which allows the dispersion law to be determined. The dispersion law obtained in this way for long-wavelength phonons of a thin aluminum film containing only five atomic monolayers coincides with the analytical result from the theory of elasticity. This suggests that the MD method, statement of the problem, and the chosen interatomic potential can adequately describe the dynamics of ultrathin aluminum films. Unfortunately, the MD method is limited by the computation time, the size of the calculated cell, and the imposed boundary conditions. Under periodic boundary conditions in two directions necessary for calculating the dynamic properties of the film, it is impossible to obtain real destruction of the film: rupture or curling up. Therefore, by destruction we will mean such changes in the system that lead to a program halt, assuming that the same changes occur in the real case at the initial stage of the destruction process. In this paper, the reasons for the development of dynamic instability of a thin film leading to its destruction are determined, which made it possible to suggest a reasonable scenario of this process at the atomic level.
2 Calculational methods
To describe the interatomic interaction in aluminum, a many-particle potential [10] constructed in the “embedded atom model”[11] was chosen. The authors of [10] showed that this potential makes it possible to obtain, to a high degree of accuracy, the parameters of aluminum: cohesive energy, elastic constants, melting temperature, and other physical characteristics of bulk aluminum. Earlier, in Refs. [12, 13], this potential was used to obtain the vibrational densities of states at different temperatures, elastic moduli, temperature dependence of heat capacity, thermal expansion, etc. for -Al, both in the bulk state and nanofilms. A comparison of the calculated characteristics with the experiment on inelastic neutron scattering for Al shows that the potential chosen allows one to describe the experimentally observed features of the aluminum phonon spectrum, including its “softening” with increasing temperature.
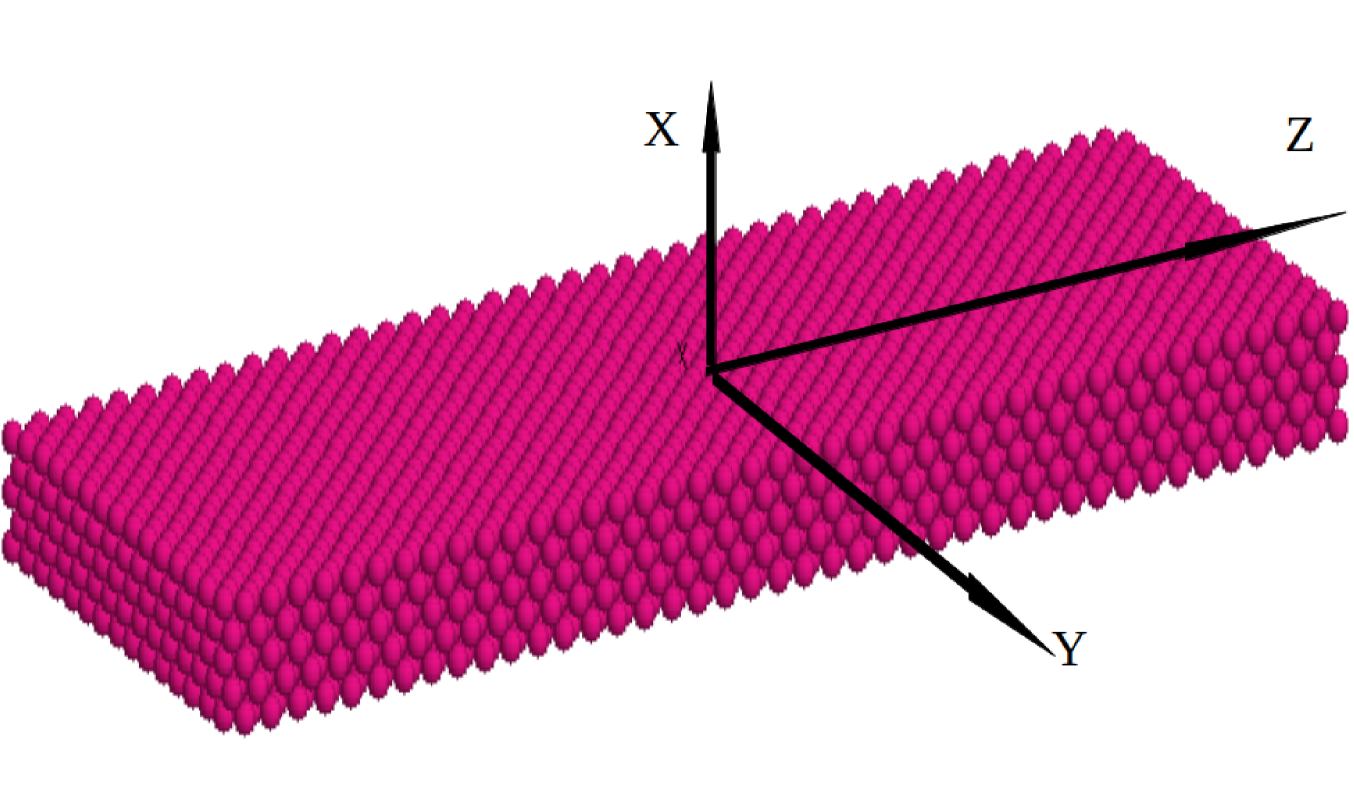
Simulation was carried out using the XMD package [14]. In all cases, the calculation began with the initiation of a crystallite with an ideal structure, relaxation for under conditions of NPT-ensemble, minimization of the energy at a given temperature and zero pressure, and the cell parameters determination. The calculations were performed on a crystallite with dimensions: monoatomic layers. For a lattice parameter of Al Å , the crystallite sizes and are, respectively, . This crystallite, shown in Fig.1, can be represented as 150 atomic chains of 42 atoms each, along the axis, a total of 6300 atoms. An odd number of layers in the direction makes it easy to go to symmetrized coordinates. The time step was . Periodic boundary conditions were set along the and axes, and free ones along the axis. The speed scaling regime was used to set a constant temperature, and the Berendsen barostat to maintain a constant pressure.
3 Determination of the thin film lifetime
Before conducting a Fourier analysis of the frequency spectrum of the system under study, it is necessary to determine the time interval () during which the system remains stable at all considered temperatures. should be large enough, since the minimum Fourier transform frequency is related to the observation time by the expression . An optimal time interval was selected, which allows one to analyze the vibrational spectrum with a minimum frequency . Figure 2 shows the functions of radial distribution of the film atoms at various temperatures. The double vertical lines indicate the atom positions corresponding to the ideal structure. It can be seen from the figure that in the temperature range , the lattice retains its initial structure, and the base crystallite sizes remain practically unchanged.
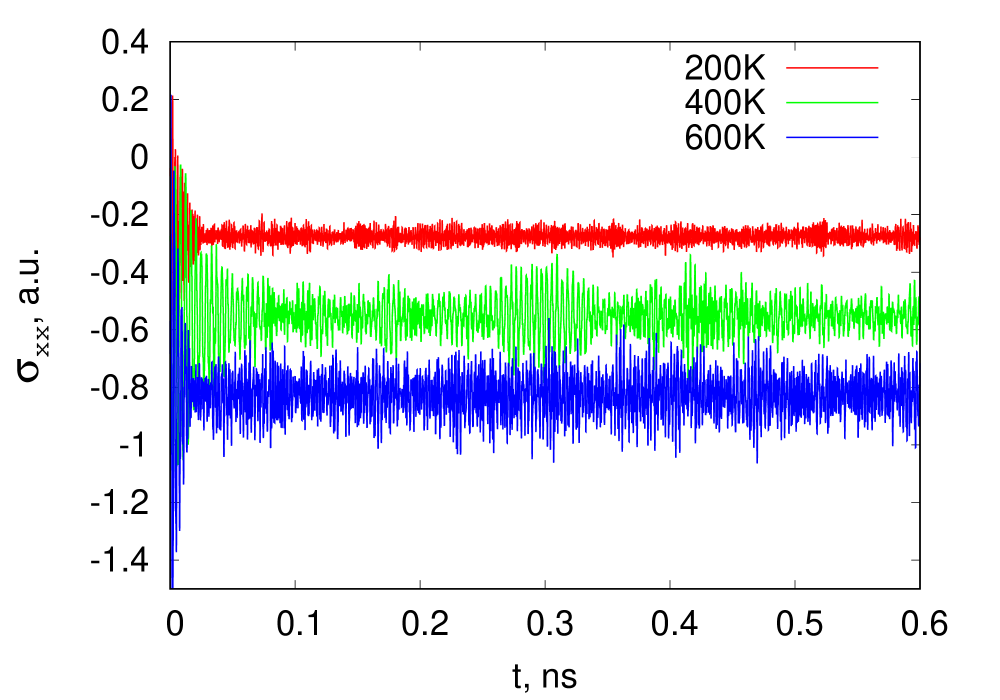
In addition to the radial distribution function, changes in the tensor of internal stress were monitored. When calculating the elements of this tensor, the virial contribution was not considered, and only terms due to the interatomic interaction forces were taken into account. The diagonal elements of the tensor are the ratio between the sum of the force projections onto the normal and the area of the considered crystallite face. In this temperature range, the diagonal elements of the internal stress tensor, and are equal to zero and practically do not change with temperature, while the element , responsible for the maintenance of the film shape, is negative, and its modulus increases with temperature, as shown in Fig.3.

Thus, the temperature ( - ) and time () intervals of the system stability were determined, which made it possible to perform a Fourier analysis of the vibrations for frequencies .
4 The method of calculating the low-frequency dispersion spectrum
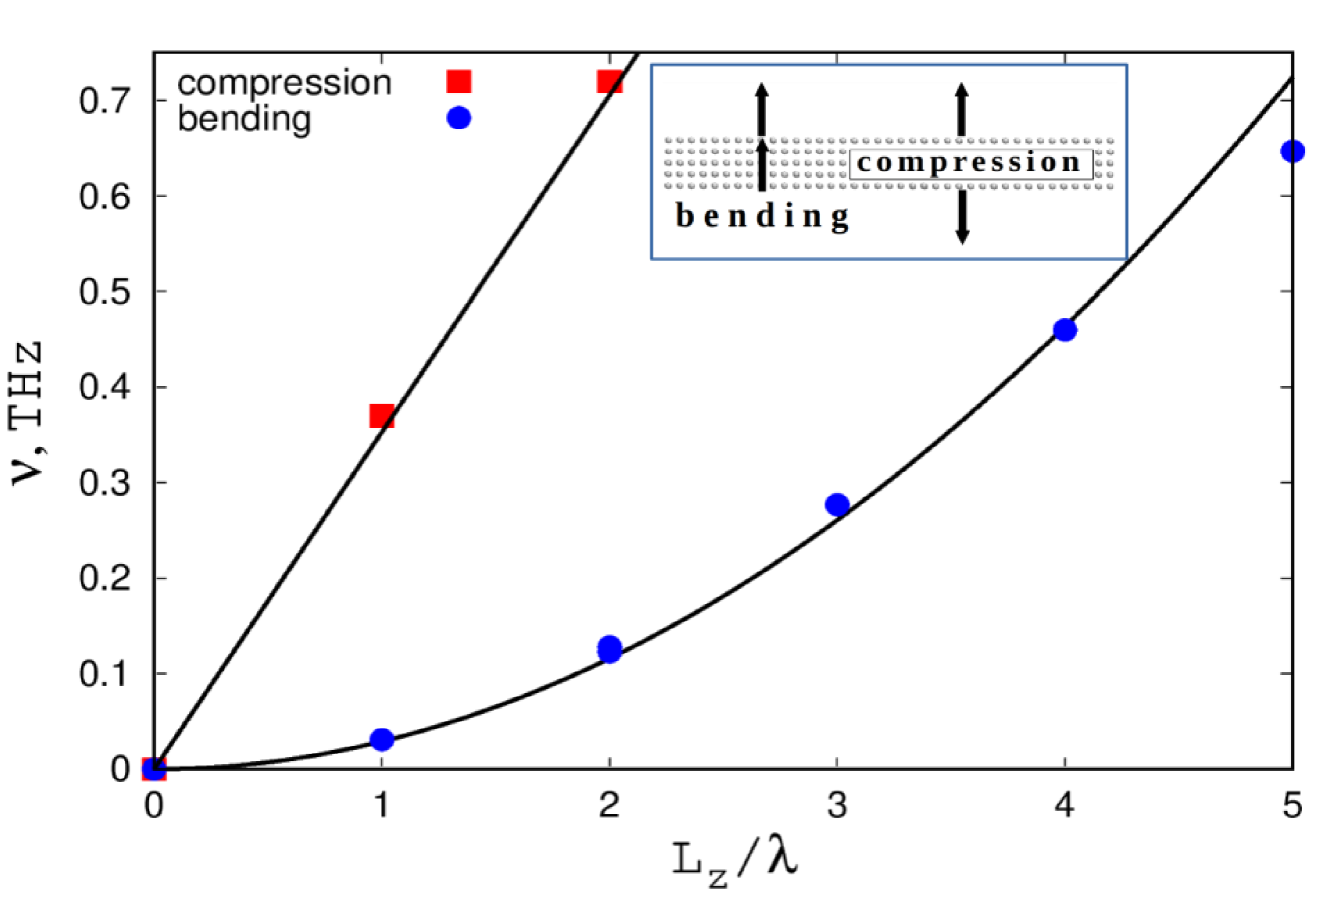
As already mentioned in Introduction, there are no experimental data on the dynamic properties of free ultrathin films. The results of numerical calculations of the dispersion law can only be compared with the analytical ones obtained in the elasticity theory which describes well the behavior of a discrete crystalline lattice in the long-wavelength limit. From the theory of elasticity it follows that the presence of a plane of symmetry parallel to the surface and passing through the middle of the film thickness, allows one to represent the displacements of all atoms as the sum of the symmetric () and antisymmetric () contributions (see the inset in Fig 4). The dispersion laws for these types of vibrations are fundamentally different and can be calculated by the formulae from Ref. [15] with the Al elastic parameters[16]:
| (1) |
| (2) |
where is a wave vector, is the velocity of the transverse sound wave in the bulk material, is the Poisson’s ratio, is the film thickness. The results of these calculations are shown by solid lines in Fig.4
When constructing the dispersion curves for these types of vibrations, we can restrict ourselves to considering the vibration projections onto the axis of two chains of surface atoms with the same value of the coordinate. The odd number of layers in the direction makes it easy to go from the real coordinates of the displacements to the symmetrized ones:
| (3) |
where the index n = 1, …, 42 denotes the atom number in the chain, and indicates the chain on the upper or lower surface layer of the film. The way of finding the values designated by symbols on these curves will be discussed below.
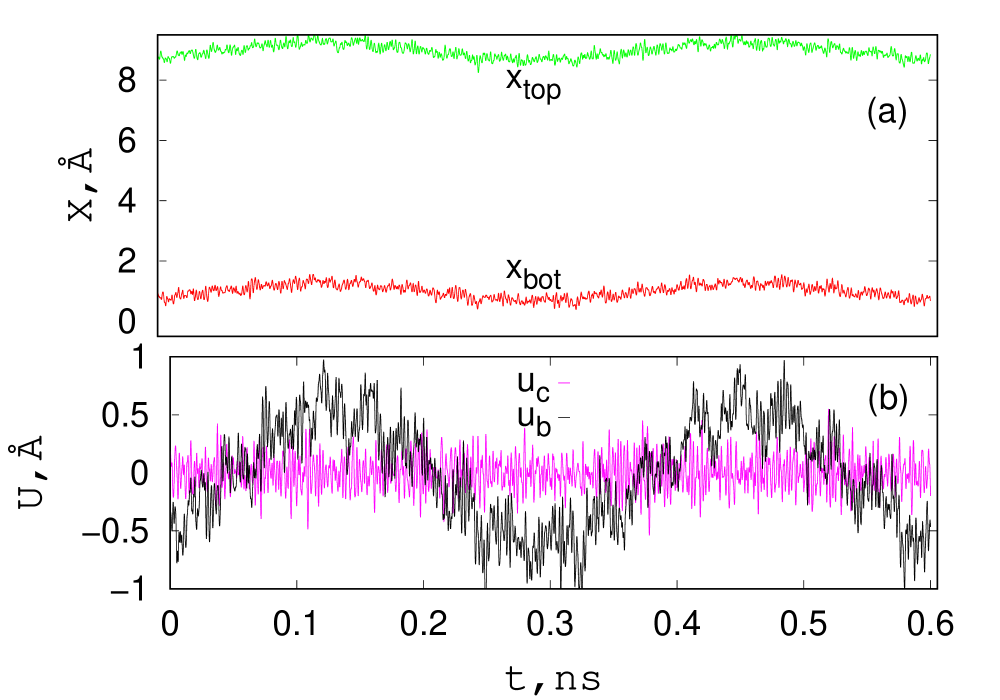
Figure 5(a) presents the time dependence of the coordinate of a pair of atoms from the upper and lower surface atomic chains having the same coordinate Å and the number along the axis at a system temperature . Figure 5(b) shows the corresponding changes in the symmetrized displacements and . It follows from the figure that the atomic displacements perpendicular to the film surface are mainly determined by the bending vibrations .
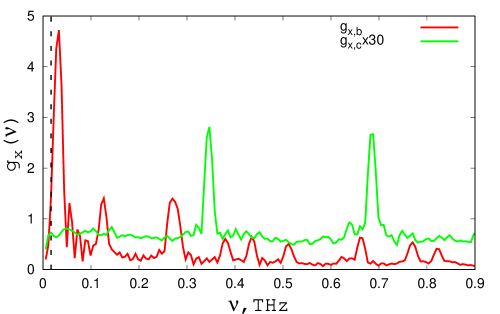
The Fourier transform ( of the - type displacement trajectories was performed for each value of in the chains selected. In this case, the frequency spectra (i.e., the Fourier transform modulus of the bending () and compression () atomic vibrations) are the sum of the spectra of individual pairs of atoms from the upper and lower chains with the same y coordinate. The low-frequency portion of these spectra is depicted in Fig.6, where resonance peaks are clearly visible. The spectrum of bending vibrations is shown by the red line, and that of compression vibrations (increased by times) by the green one. The dashed vertical line shows the minimum frequency .
Each resonance peak of the spectrum is related to a vibrational mode. To factorize it, one should consider the contributions from each pair of atoms to the given resonance peak. This is illustrated in Fig.7(a) that shows the contributions of some pairs ( is the pair number along the direction) to the spectrum (modulus of ) near the resonance with a frequency related to bending vibrations. The frequency spectrum is a positively definite quantity, and the imaginary part of the Fourier transform () saves information about the vibration phase (see Fig.7(b)).

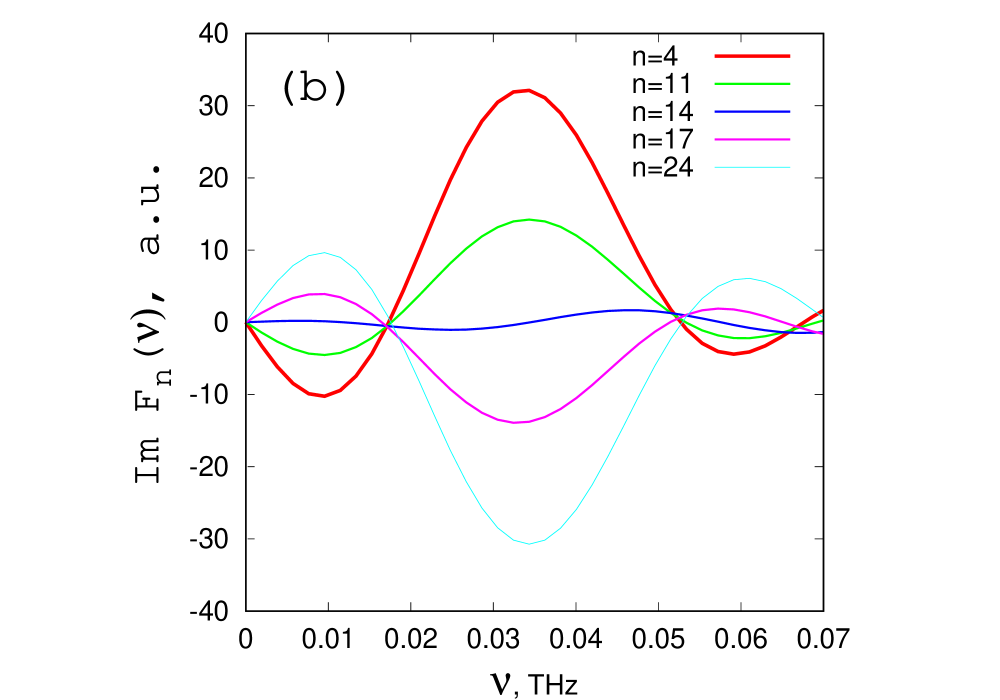
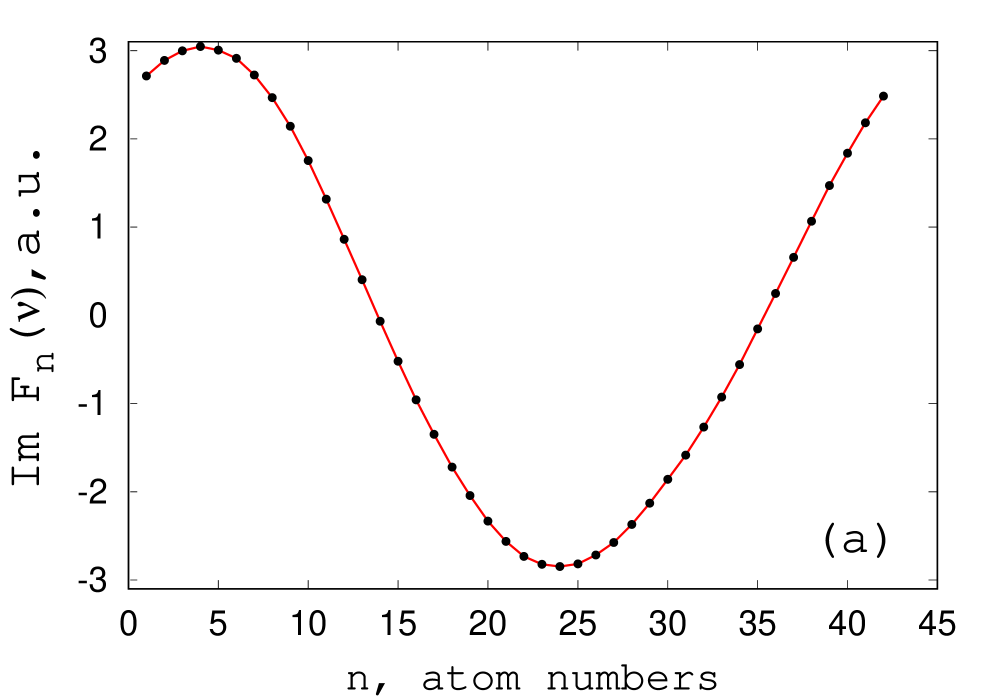
Fig.8 demonstrates the imaginary values of the Fourier transform at the resonance frequency for the entire atomic chain, indicated by the points. Their envelope is a bending wave in real space, propagating along the direction; the wavelength equals the size of the calculated cell in the direction, being maximum for the given problem geometry.
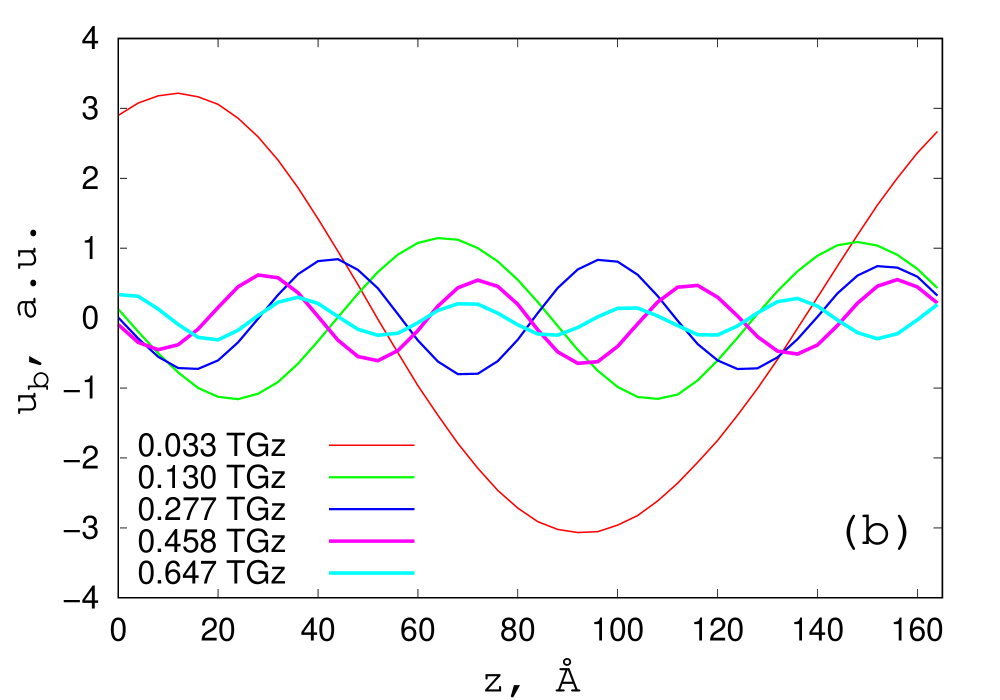
Applying the same procedure for higher-frequency resonance peaks in the spectrum of bending vibrations (see Fig.6), the relationship between the wavelength and frequency was found, i.e., the dispersion law for bending vibrations was calculated. Figure 8(b) shows the bending vibrations corresponding to different resonance frequencies; for each of these a wavelength can be determined. Similarly, relationship between the resonance frequencies and wavelengths can be found for compression vibrations. The values obtained in this way correspond to the symbols in Fig.4. Good agreement between the calculated results and the analytical ones obtained in the elasticity theory points to the validity of the approach in studying the low-frequency portion of the film vibrational spectrum, which shows that this approach can be used to describe the beginning of the film destruction.
5 FILM DESTRUCTION
This section presents the results of investigation of the film dynamic instability development, leading to its destruction at high temperatures. As was already mentioned in Introduction, the peculiarities of the MD method associated with the computation time, arbitrary choice of the size of the calculated cell, and the imposed boundary conditions do not make it possible to obtain a real film destruction: its rupture or curling up. Therefore, by “destruction” we mean such changes in the system that lead to a program halt, assuming that the same changes occur, at the initial stage of destruction, in real situation. As the temperature approaches , the time of life (equilibrium state) of the film becomes less than . This manifests itself most clearly by a rapid exponential decrease in the size of the base crystallite along the direction, , at times greater than a certain critical value . Note that the time is not only a function of temperature, it also depends on how the system is brought to a given temperature. All calculated time dependences of the crystallite size shown in Fig.9 started after the system was kept for at , which allows one to assume that the conditions of reaching high temperatures () are almost the same for all curves. Nevertheless, it is seen from Fig.9 that the expected decrease in the parameter with increasing temperature does not occur monotonically.

The time dependences of the elements of the internal stress tensor of the system also undergo a qualitative change at times close to . All the curves obtained are well approximated by the same expression:
| (4) |
The parameters for each characteristic () at different temperatures were found by fitting with the use of the nonlinear least squares algorithm(NLLS)[17].
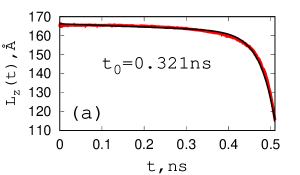
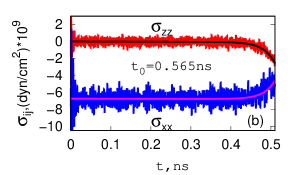
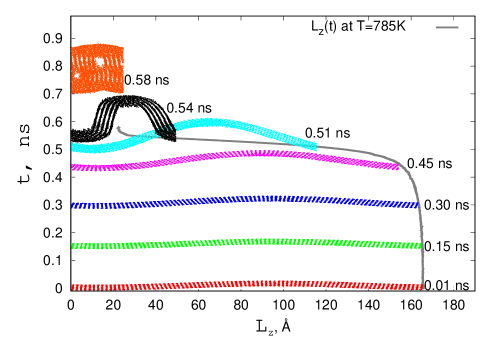
Since the time characteristics calculated for the considered temperatures are similar, we dwell more closely on the results obtained for a temperature of . Figure 10 demonstrates the time dependences of the film size (a), and of the diagonal elements of the stress tensor and (b) at . Here, the bold line shows their approximations by formula (4). Only the parameter determining the moment of qualitative change of the corresponding characteristics is indicated in the figures: for , and for . A comparison of these plots shows that, at a given temperature, the system instability is evidenced first on the curve , and only later on . Figure 11 shows the instantaneous projections of all the atoms of the calculated cell onto the plane for at different time moments. The values of these time moments are shown to the right of the corresponding curves. The figure demonstrates how the film shape varies with time, as the instability is approached. Note that the instantaneous shape of the film coincides with the geometry of the longest low-frequency bending wave, whose amplitude increases with time, which ensures a linear decrease of at times . At , the process accelerates, there occurs a rapid increase in the bending wave amplitude, the film bends (the wavelength sharply decreases), and the simulation stops.
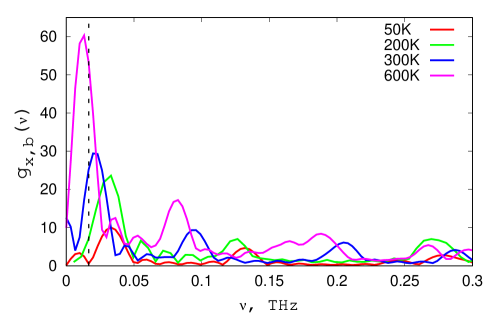
Let us analyze the changes in the most low-frequency portion of the system spectrum as the temperature increases up to . Figure 12 presents the results of calculation of the frequency spectrum of bending vibrations for the temperatures: and . The observed spectrum softening with temperature is quite understandable: it is associated with a decrease in the velocity of the transverse sound wave in a bulk sample (see Formula (1)). Already at the vibration period of this mode equals the computation time () and, obviously, continues to increase with temperature. Frequencies less than cannot be determined from the Fourier analysis. The vibrational mode with a period larger than the computation time may be called “retarded mode”. Indeed, from the beginning of the calculation the amplitude of this wave continuously grows, the wavelength thereby decreases, which results in an increase of the film curvature (see Fig.11). If at a moment the wavelength reaches a certain critical value (), the fluctuation attractive interaction between atoms located on the opposite slopes of the wave crest becomes possible, as evidenced by the appearance of negative values of (see Fig.10b). Once this process has started, it develops exponentially, and the film “collapses”. The program stops calculating when becomes less than three radii of the potential cutoff.
The appearance of a “retarded mode” associated with a long bending wave is a necessary condition for the development of film destruction process in the model under study. Indeed, in the other direction (along the axis) with periodic boundary conditions, the time dependence has a peculiarity only at those times when the destruction process in the direction has already developed, as shown by the dashed line in Fig.9. The geometry of the problem under consideration is such that the maximum wavelength in the direction is times less than along the axis. The period of the corresponding vibrations, proportional to (see Formula (1)), is eight times less than that of a similar wave propagating along the direction, so it cannot become “retarded” at any of the temperatures considered.
Thus, three stages can be distinguished in the MD simulation of the thin-film destruction process.
1. With increasing temperature, the there forms a “retarded” bending mode, the vibration period of which is greater than the time of the steady state existence ().
2. A constant in time increase of the amplitude of this mode and, correspondingly, of the film curvature to a critical value, when fluctuation attractive interaction between atoms located on the opposite slopes of the wave crest becomes possible.
3. This process develops exponentially, leading to the film destruction.
6 Conclusion
The molecular dynamics method is used to study the lattice stability and vibrational properties of a thin (5 atomic layers) aluminum film. The problem of testing the MMD calculation results in the absence of experimental data for thin films is solved by comparing the calculated dispersion law with the analytical results obtained in the elasticity theory, which requires a special attention to be paid to the low-frequency portion of the vibrational spectrum of the system. An original approach is proposed, which allows one to calculate the dispersion law of long-wave phonons in thin films using the molecular dynamics method. The approach is based on a preliminary symmetry analysis of the vibrations of the film atoms, which enables one to calculate independently the vibrational spectrum for the symmetrized coordinates corresponding to the bending and compression vibrations of a the film. This makes it possible to unambiguously establish to which branch of the phonon spectrum the considered vibrations with a given frequency belong, and to find the wavelength of the corresponding phonon. The obtained values of the low-frequency dispersion spectrum are in good agreement with the analytical results from the theory of elasticity. The temperature range () , in which the film remains stable for a time of is determined, and a frequency analysis of the vibrational spectrum, starting from the minimum frequency is performed. The obtained temperature dependences of the low-frequency spectrum, the changes in the film size along the axis, and in the film shape make it possible to propose a scenario for the development of the system instability.
It is shown that at the initial stage of film destruction, the main role is played by low-frequency bending vibrations. A linear decrease in the size of the base crystallite is due to the increasing bending wave amplitude, which is maximum for the chosen problem geometry. With increasing amplitude of this wave, the film curvature grows to a critical value, at which the element of the internal stress tensor becomes negative, which points to the appearance of fluctuation attractive interaction along the axis between atoms from the opposite slopes of the wave crest, following which the process develops exponentially, leading to the film destruction.
7 Acknowledgments
The work was carried out within the framework of the research topic of the Udmurt Federal Research Center of Ural Branch of the Russian Academy of Sciences “Theoretical studies of electronic, magnetic, lattice and transport properties of layered and nanostructured systems” AAAA17-117022250041-7.
References
- [1] J.W. Evans, P.A. Thiel, M.C. Bartelt, Morphological evolution during epitaxial thin film growth: Formation of 2D islands and 3D mounds, Surface Science Reports 61 (2006) 1-128.
- [2] J.A. Venables, J.L. Seguin, J. Suzanne, M. Bienfait, Crystallograghy and growth modes of thick physisorbed films on graphite, Surface Science 145(2-3) (1984) 345-363.
- [3] J.A. Venables, G.D.T. Spiller, M. Hanbucken, Nucleation and growth of thin films, Reports on Progress in Physics 47(4) (1984) 399-459.
- [4] J.A. Venables, Atomic processes in crystal growth, Surface Science 299-300(1) (1994) 798-817.
- [5] G. Leibfried, W. Ludwig, Theory of Anharmonic Effects in Crystals, Solid State Physics 12 (1961) 275-444.
- [6] S.A. Ostanin, E.I. Salamatov, V.Y. Trubitsin, Anharmonic model of instability evolution near the phase transition in Zr, Phys. Rev. B 57 (1998) 5002.
- [7] S.A. Ostanin, E.I. Salamatov, V.Y. Trubitsin, Pressure effect on the transverse Gamma-point optical phonon in Zr, Phys. Rev. B 58 (1998) 15962.
- [8] C. Stassis, J. Zarestky, N. Wakabayashi, Lattice dynamics of zirconium, Phys. Rev. Lett. 41 (1998) 1726.
- [9] H. Olijnyk, A.P. Jephcoat, Effect of pressure on Raman phonons in zirconium metal, Phys. Rev. B 56 (1997) 10751.
- [10] R.R. Zope, Y. Mishin, Interatomic potentials for atomistic simulations of the Ti-Al system, Phys. Rev. B 68 (2003) 024102.
- [11] M.S. Daw, M.I. Baskes, Embedded-atom method: Derivation and application to impurities and other defects in metals, Phys. Rev. B 29 (1984) 6443.
- [12] E.B. Dolgusheva, V.Y. Trubitsin, Lattice Heat Capacity of Nanostructured Materials Based on Titanium/Zirconium and Aluminum, Physics of the Solid State 60(5) (2018) 837-846.
- [13] E.B. Dolgusheva, Thermal properties of fcc titanium and aluminum thin films, Com. Mat. Sci. 155 (2018) 55-62.
- [14] J. Rifkin, XMD Molecular Dynamics Program (Univ. Of Connecticut,Center for Materials Simulation, Storrs, CT, 2002) <http://xmd.SourceForge.net/>
- [15] M. C. Cross, Ron Lifshits, Elastic wave transmission at an abrupt junction in a thin plate with application to heat transport and vibrations in mesoscopic systems, Phys. Rev. B 64 (2001) 085324.
- [16] Ch. Kittel, Introduction to Solid State Physics, 7th edn. (Wiley, New York 1995) p.458.
- [17] D. Marquardt, An Algorithm for Least-Squares Estimation of Nonlinear Parameters, SIAM Journal on Applied Mathematics 11(2) (1963), 431-441.