The Lockdown Effect:
Implications of the COVID-19 Pandemic on Internet Traffic
Abstract.
Due to the COVID-19 pandemic, many governments imposed lockdowns that forced hundreds of millions of citizens to stay at home. The implementation of confinement measures increased Internet traffic demands of residential users, in particular, for remote working, entertainment, commerce, and education, which, as a result, caused traffic shifts in the Internet core.
In this paper, using data from a diverse set of vantage points (one ISP, three IXPs, and one metropolitan educational network), we examine the effect of these lockdowns on traffic shifts. We find that the traffic volume increased by 15-20% almost within a week—while overall still modest, this constitutes a large increase within this short time period. However, despite this surge, we observe that the Internet infrastructure is able to handle the new volume, as most traffic shifts occur outside of traditional peak hours. When looking directly at the traffic sources, it turns out that, while hypergiants still contribute a significant fraction of traffic, we see (1) a higher increase in traffic of non-hypergiants, and (2) traffic increases in applications that people use when at home, such as Web conferencing, VPN, and gaming. While many networks see increased traffic demands, in particular, those providing services to residential users, academic networks experience major overall decreases. Yet, in these networks, we can observe substantial increases when considering applications associated to remote working and lecturing.
5pt {textblock}0.8(0.1,0.02) If you cite this paper, please use the IMC reference: Anja Feldmann, Oliver Gasser, Franziska Lichtblau, Enric Pujol, Ingmar Poese, Christoph Dietzel, Daniel Wagner, Matthias Wichtlhuber, Juan Tapiador, Narseo Vallina-Rodriguez, Oliver Hohlfeld, and Georgios Smaragdakis. 2020. The Lockdown Effect: Implications of the COVID-19 Pandemic on Internet Traffic. In Internet Measurement Conference (IMC ’20), October 27–29, 2020, Virtual Event, USA. ACM, New York, NY, USA, 18 pages. https://doi.org/10.1145/3419394.3423658
1. Introduction
The profile of a typical residential user—in terms of bandwidth usage and traffic destinations—is one of the most critical parameters that network operators use to drive their network operations and inform investments (Trevisan et al., 2018; Maier et al., 2009; Garcia-Dorado et al., 2012). In the last twenty years, user profiles have changed significantly. We observed user profile shifts from peer-to-peer applications in the early 2000s (Otto et al., 2011; Dischinger et al., 2010; Xie et al., 2008), to content delivery and streaming applications in 2010s (Labovitz et al., 2010; Dobrian et al., 2011; Krishnan and Sitaraman, 2012; Pujol et al., 2019; C. Labovitz, 2019), and more recently to mobile applications (Xu et al., 2011; Huang et al., 2013). Although changes in user profiles are a moving target, they typically have time scales of years. Thus, staying up to date, e.g., via measurements, was feasible.
The COVID-19 pandemic is most likely a once in a generation global phenomenon that drastically changed the habits of millions of Internet users around the globe. As a result of the government mandated lockdowns, a large fraction of the population had to depend on their residential Internet connectivity for work, education, social activities, and entertainment. Unexpectedly, the Internet held up to this unforeseen demand (Timberg, 2020) with no reports of large scale outages or failures in more developed countries. This unique phenomenon allows us to observe changes that may be expected within months or years in a matter of days.
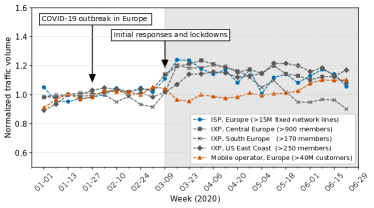
COVID-19-induced weekly growth. We observe a significant traffic evolution in 2020 at multiple Internet vantage points in Figure 1. The COVID-19 outbreak reached Europe in late January (week 4) and first lockdowns were imposed in mid March (starting on week 11). Thus, we normalize weekly traffic volumes by the median traffic volume of the first ten weeks of 2020 (pre-lockdown period). We can clearly identify drastic changes in the data collected at multiple and diverse vantage points (see Section 2 for details): Traffic demands for broadband connectivity, as observed at an ISP in Central Europe as well as at a major IXP in Central Europe and an IXP in Southern Europe increased slowly at the beginning of the outbreak and then more rapidly by more than 20% after the lockdowns started. The traffic increase at the IXP at the US East Coast trails the other data sources since the lockdown occurred several weeks later. While we observe this phenomenon at the ISP and IXP vantage points, one difference between them is that the relative traffic increase at the IXP seems to persist longer while traffic demand at the ISP decreases quickly towards May. This correlates with the first partial opening of the economy, including shop reopenings in this region in mid-April and further relaxations including school openings in a second wave in May. Our findings are aligned with the insights offered by mobility reports published by Google (Google, 2020a) and the increased digital demand as reported by Akamai (McKeay, 2020a, b), Comcast (Comcast, 2020), Google (Google, 2020b), Nokia Deepfield (Labovitz, 2020), and TeleGeography (Telegeography, 2020).
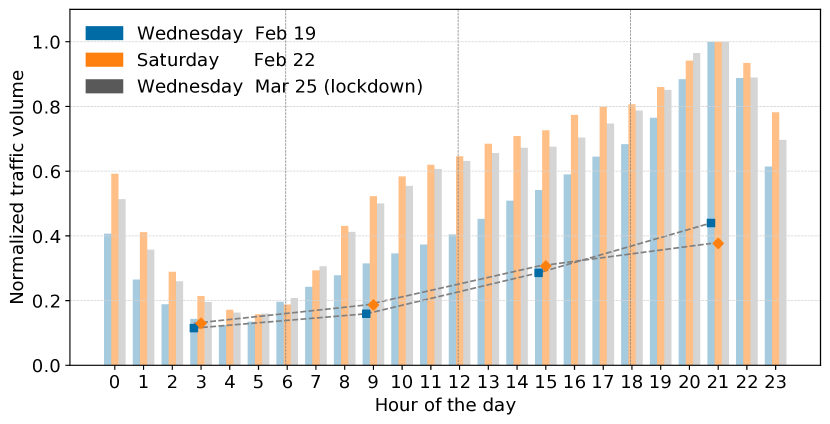
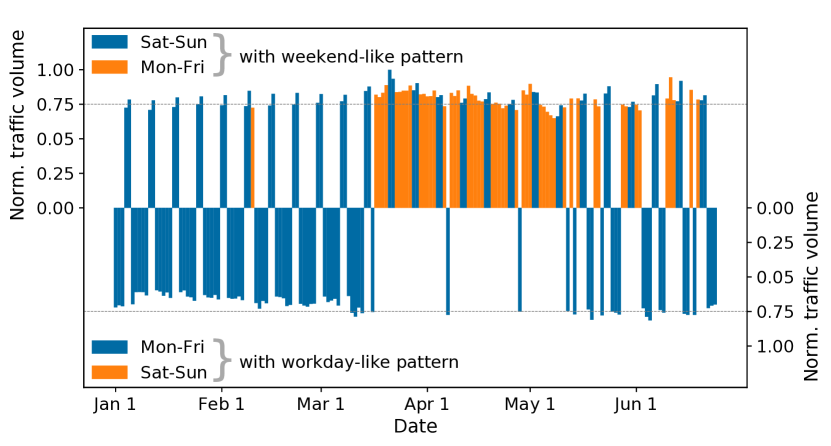
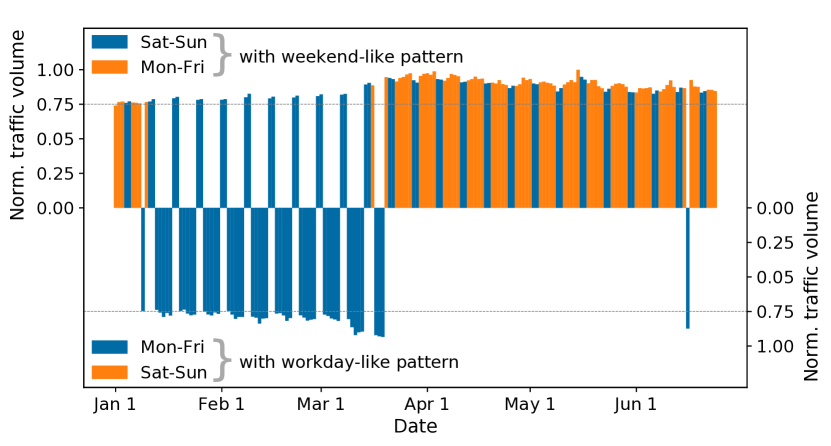
Drastic shift in usage patterns. In light of the global COVID-19 pandemic a total growth of traffic is somewhat expected. More relevant for the operations of networks is how exactly usage patterns are shifting, e.g., , during the day or on different days of a week. To this end, we show the daily traffic patterns at two of the above mentioned vantage points in Figure 2. The Internet’s regular workday traffic patterns are significantly different from weekend patterns (Lakhina et al., 2004; in the Dark, 2005; Shafiq et al., 2011). On workdays, traffic peaks are concentrated in the evenings, see Figure 2(a). For instance, Wed., February 19 vs. Sat., February 22, 2020: With the pandemic lockdown in March, this workday traffic pattern shifts towards a continuous weekend-like pattern, as can be seen in the daily pattern for Mar. 25, 2020 in Figure 2(a). More specifically, we call a traffic pattern a workday pattern if the traffic spikes in the evening hours and a weekend pattern if its main activity gains significant momentum from approximately 9:00 to 10:00 am. For our classification, we use labeled data from late 2019 and use an aggregation level of 6 hours. Then, we apply this classification to all available days in 2020. Figures 2(b) and 2(c) show the normalized traffic for days classified as weekend-like on the top and for workday-like on the bottom. If the classification is in line with the actual day (workday or weekend) the bars are colored blue, otherwise they are colored in orange. We find that up to mid-March, most weekend days are classified as weekend-like days and most workdays as workday-like days. The only exception is the holiday period at the beginning of the year in Figure 2(c). This pattern changes drastically once the confinement measures are implemented: Almost all days are classified as weekend-like. This change persists in Figure 2(c) until the end of June due to the vacation period, which is consistent with the behavior observed in 2019 (not shown). In contrast, Figure 2(b) shows that the shift towards a weekend-like pattern becomes less dominant as countermeasures were relaxed in mid-May.
These observations raise the question of the cause for this significant traffic growth and shift in patterns, given that many people are staying at home for all purposes, e.g., working from home, remote education, performing online social activities, or consuming entertainment content. The increased demand in entertainment, e.g., video streaming or gaming, may imply an increase in hypergiant traffic. This is in accordance with a statement by a commissioner of the European Union which stated that major streaming companies reduced their video resolution to the standard definition from March 19, 2020 onward (Netflix, 2020; Commission, 2020). According to mainstream media, some started to upgrade their services back to high definition or 4K around May 12, 2020 (Forbes, 2020). Furthermore, the need for remote working may imply an increased demand for VPN services, usage of video conference systems, email, and cloud services.
In this paper, we study the effect that government-mandated lockdowns had on the Internet by analyzing network data from a major Central European ISP (ISP-CE), three IXPs located in Central Europe, Southern Europe, and the US East Coast, and an Spanish educational network (EDU). This enables us to holistically study the effects of the COVID-19 pandemic both from the network edge (ISP-CE/EDU) and the Internet core (IXPs). We find that:
-
•
Relative traffic volume changes follow user changing habits—causing “moderate” increases of 15-20% at the height of the lockdown for the ISP/IXPs, but decreases up to 55% at the EDU network. Even after the lockdown is scaled back, some of these trends remain: 20% at the IXP-CE but only 6% at the ISP-CE.
-
•
Most traffic increases happen during non-traditional peak hours. Daily traffic patterns are moving to weekend-like patterns.
-
•
Online entertainment demands account for hypergiant traffic surge. Yet, the need for remote working increases the relative traffic share of many “essential” applications like VPN and conferencing tools by more than 200%. At the same time, the traffic share for other traffic classes decreases substantially, e.g., traffic related to education, social media, and—for some periods—CDNs.
-
•
At the IXP-level, we observe that port utilization increases. This phenomenon is mostly explained by a higher traffic demand from residential users.
-
•
Traffic changes are diverse, increasing in some network ports while decreasing in others. One example of the latter is the EDU network, where we observe a significant drop in traffic volume on workdays after the lockdown measures loosened, with a maximum decrease of up to 55%. Yet, remote working and lecturing cause a surge in incoming traffic, e.g., for email and VPN connections. The EDU traffic shift is antagonistic, yet complementary, to the observations made in other vantage points.
2. Datasets
This section describes the network traffic datasets that we used for our analysis. We utilize vantage points at the core of the Internet (IXPs), at the backbone and peering points of a major Internet Service Provider, and at the edge (a metropolitan university network), all which we will describe below.
ISP-CE: Network flows from a large Central European ISP that provides service to more than 15 million fixed line subscribers and also operates a transit network (Tier-1). The ISP does not host content delivery servers inside its network, but it has established a large number of peering agreements with all major content delivery and cloud networks at multiple locations. This ISP uses NetFlow (Cisco, 2012b) at all border routers to support its internal operations. We rely on two different sets of NetFlow records for this paper. First, we use NetFlow data collected at ISP’s Border Network Gateways (Cisco, 2012a) to understand the impact of changing demands of the ISPs’ subscribers. Second, we use NetFlow records collected at the ISP’s border routers to gain a better understanding about how companies running their own ASNs are affected by these changes.
IXPs: Network flows from the public peering platform of three major Internet Exchange Points (IXPs). The first one has more than 900 members, is located in Central Europe (IXP-CE) and has peak traffic of more than 8 Tbps. The IXP-CE is located in the same country as the ISP-CE. The second one has more than 170 members, is located in Southern Europe (IXP-SE) and has a peak traffic of roughly 500 Gbps. It covers the region of the EDU network. The third one has 250 members, is located at the US East Coast (IXP-US) and has a peak traffic of more than 600 Gbps. At the IXPs we use IPFIX data (Claise et al., 2013).
EDU: Network flows from the REDImadrid (REDImadrid, 2020) academic network interconnecting 16 independent universities and research centers in the region of Madrid. It serves nearly 290,000 users including students, faculty, researchers, student halls, WiFi networks (including Eduroam), and administrative and support staff. The network operator provided us with anonymized NetFlow data captured at their border routers (captured at all ingress interfaces) during 72 days in the period of Feb 28 to May 8, 2020. The final dataset contains 5.2B flows entering or leaving the educational network.
We augment our analysis with NetFlow records from a large mobile operator that operates in Central Europe, with more than 40 million customers.
Normalization: Since all data sources exhibit vastly differing traffic characteristics and volumes, we normalize the data to make it easier to compare. For plots where we show selected weeks only, we normalize the traffic by the minimum traffic volume. For plots spanning a larger timeframe, we normalize the traffic by the median traffic volume of the first ten weeks of 2020, depending on the availability of data.
Time frame: We use two methods to reflect the developments since the beginning of the COVID pandemic: (a) for general trends over time we use continuous data from Jan 1, 2020—Jun 24, 2020, (b) to highlight detailed developments we compare 7-day periods as shown in Table 1 from before, during, after and well after the lockdown in 2020.111Due to data availability, the ISP-CE is using Apr 09–15 which covers the Easter holiday period. As partial lockdowns and travel restrictions were still in place, the introduced bias may be very small.
| ISP-CE | IXP-CE | IXP-SE | IXP-US | EDU | |
|---|---|---|---|---|---|
| base | Feb 20–26 | Feb 20–26 | Feb 20–26 | Feb 20–26 | Feb 20–26 |
| March | Mar 19–25 | Mar 19–25 | Mar 12–18 | Mar 19–25 | Mar 12–18 |
| April | Apr 09–15 | Apr 23–29 | Apr 23–29 | Apr 23–29 | Apr 23–29 |
| June | Jun 18–24 | Jun 18–24 | Jun 18–24 | Jun 18–24 | n/a |
2.1. Ethical Considerations
Both NetFlow and IPFIX data provide only flow summaries based on the packet header and do not reveal any payload information. To preserve users privacy, all data analyses are done on servers located at the premises of the ISP, IXPs, and the academic network. IP addresses are hashed to prevent information leaks and raw data being transferred. The output of the analyses are the aggregated statistics as presented in the paper. The data at the ISP and IXPs is collected as a part of their routine network analysis. For obtaining and analyzing the academic network data (EDU), we obtained IRB approval from the respective institutions.
3. Aggregated Traffic Shifts
To understand traffic changes during the lockdown we first look for overall traffic shifts before, during, and after the strictest lockdown periods. Moreover, we take a look at hypergiant ASes vs. other ASes, shifts in link utilization, and ASes relevant for remote working.
3.1. Macroscopic Analysis
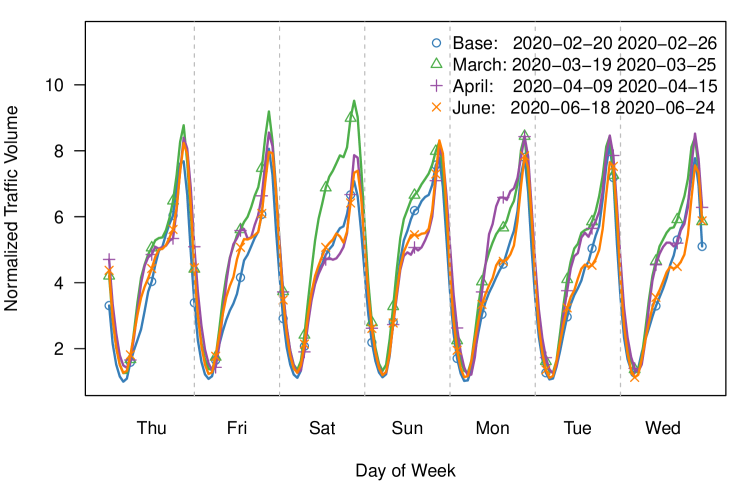
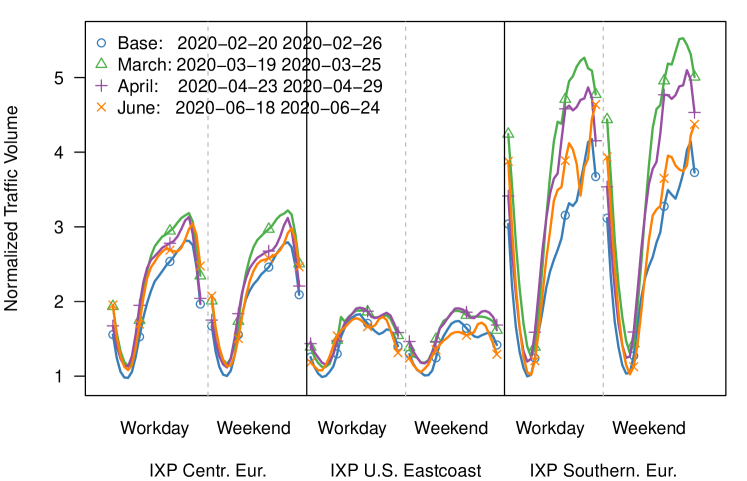
Figure 3 plots the aggregated normalized traffic volume in bytes at the granularity of one hour for the ISP-CE, IXP-CE, IXP-US, and IXP-SE in four selected weeks (see Table 1). For the ISP-CE, Figure 3(a) shows the time series using normalized one-hour bins. For the IXPs, Figure 3(b) reports the hourly average for workdays and weekends.
First of all, we see that the overall traffic after the lockdown increased by more than 20% for the ISP-CE and 30%/12%/2% for the IXP-SE/IXP-CE/IXP-US, respectively. Once the lockdown measures were relaxed, the growth started declining for the ISP-CE but persisted for the IXP-CE and the IXP-SE. These differences are most likely attributed to the fact that the ISP-CE traffic pattern is dominated by end-user and small enterprise traffic—recall, we are not analyzing any transit traffic—while the IXP-CE has a wider customer base. Traffic persistently increased for the IXP-US where the lockdown was put into place later.
As previously noted, the ISP-CE time series shows the same workday to weekend traffic patterns shifts starting with the lockdown in mid-March. In accordance with that observation, traffic increases much earlier in the day with a small dip at lunchtime. However after lunch hours, traffic grows to roughly the same volume during the evening time, spiking late in the evening. This change persists throughout the lockdown. Once this was relaxed, the pattern became less pronounced and the shift to a weekend like pattern became less dominant. Additionally, it is important to note 1) the Easter vacations in the April week, and 2) the seasonal effects in the weekend of the June week (an increase of outdoor activities).
For all IXPs, see Figure 3(b), not only do we see an increase in peak traffic but also in the minimum traffic levels. This correlates with link capacity upgrades of many IXP members leading to overall increases of 3% at IXP-CE, 12% at IXP in Southern Europe and 20% at IXP at the US East Coast. In addition, we see the increase in traffic during daytime, which is very pronounced at the IXP-CE. However, the differences between weekends and workdays are not as apparent as at the ISP. Interestingly, as lockdown measures were mandated, the daytime traffic again decreases but stays well above the pre-lockdown level. In contrast, traffic at the IXP-US barely changes in March and increases only in April, otherwise showing similar effects as the other IXPs. The delayed increase in volume is likely due to the later lockdown in the US. Overall, the effects of the time of day at this IXP are less pronounced compared to the two others because it (a) serves customers from many different time zones, and (b) members are diverse and include eyeball as well as content/service providers. In contrast, the IXP-SE interconnects more regional networks, and as such the traffic patterns are closer to the ones of the IXP-CE.
3.2. Hypergiants
To understand the composition of residential traffic, we investigate who is responsible for the traffic increase at the ISP-CE. The first step is to look at the top 15 hypergiants (Labovitz et al., 2010; Böttger et al., 2018; Böttger et al., 2017) (full list in Appendix A.1). Hypergiants are networks with high outbound traffic ratios that deliver content to approximately millions of users in the locations at which we have vantage points. The 15 hypergiants we consider in this study are responsible for about 75% of the traffic delivered to the end-users of the ISP in Central Europe which is consistent with recent reports in the literature (C. Labovitz, 2019; Pujol et al., 2019; Trevisan et al., 2018). We note that the fraction of hypergiant traffic vs. traffic from other ASes does not change drastically for the ISP-CE as well as all IXPs.
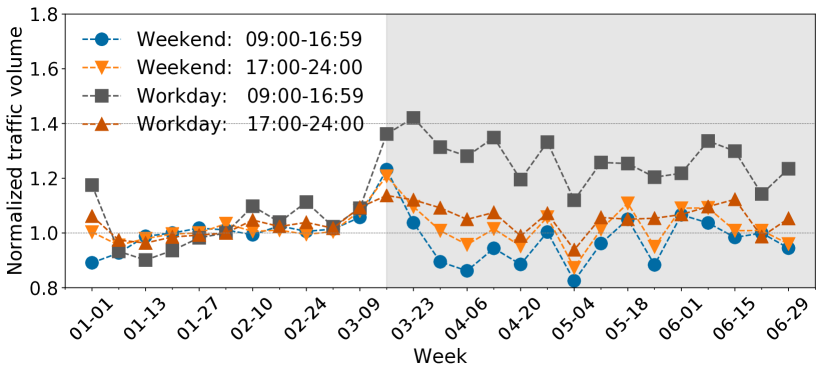
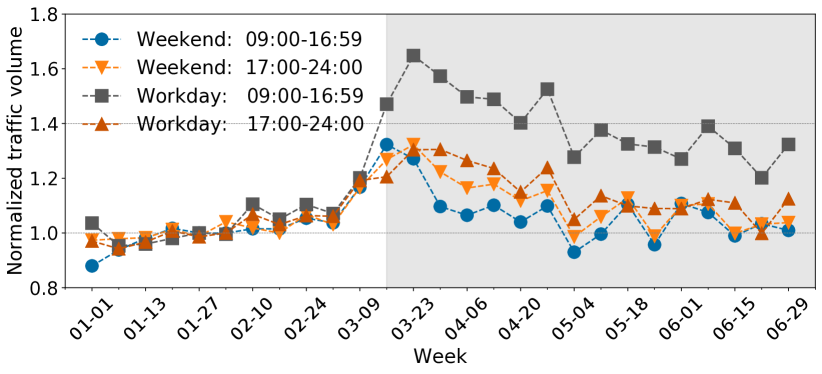
Given that the overall traffic has increased, we next report the relative increase of the two AS groups compared to the median traffic volume during the pre-lockdown period, see Figure 4. In detail, we focus on different times of day and days within the week. We find that the relative traffic increase is significantly larger for other ASes than for hypergiants.
Both sets of time series are more or less on top of each other until the lockdown. This observation also holds for data from 2019 (not shown). However, after the lockdown, the time series for the other ASes present higher deviations from the reference value than those of the hypergiants. The most visually striking difference occurs during working hours of work-days: Hypergiants experience a 40% increase whereas the remaining ASes grow by more than 60%. While this difference is significantly reduced around mid-May, the relative increase for both sets of ASes is still substantial. In fact, except for the working hours during work-days, the traffic surge seems to normalize around mid-May, especially for other ASes. Notice the fluctuations during weekends mornings starting around the end of April—they can be also observed in 2019 (not shown).
A plausible explanation for the increase of daily traffic volumes in this vantage point are family members being forced to continue their professional and educational activities from home. Yet, the demand for entertainment content—mainly video streaming—explains the increase in traffic volume associated with hypergiants, many of which offer such services. The increase in traffic by the other ASes has more facets and it requires a more thorough analysis that incorporates traffic classification methods. Before doing that, the next subsections investigate the impact that these ASes have on parts of the infrastructure of some of our vantage points.
3.3. Link Utilization Shifts
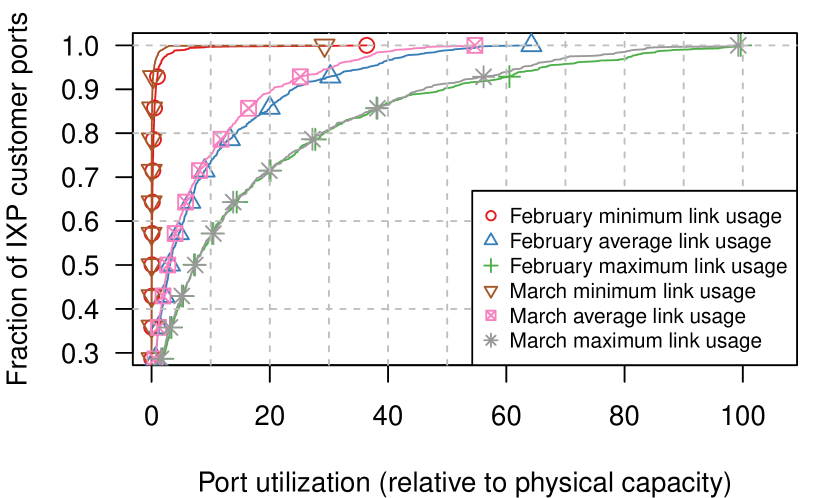
We analyze to which extent the observed changes are reflected in our link utilization dataset to assess how many networks suffer changes in their traffic characteristics. For this, we look at changes in relative link utilization between the base week in February and the selected week in March. We choose IXP-CE as reference vantage point as it houses the greatest variety of connected ASes, thus allowing a more complete and meaningful analysis. Our dataset reflects link capacity upgrades as well as customers switching to PNIs. We plot the minimum, average and maximum link utilization for all members at IXP-CE in Figure 5. Appendix B provides additional figures comparing link utilization in other months.
Figure 5 shows a slight shift to the left during lockdown. This denotes a tendency towards decreased link usage across many IXP members which could be caused by link capacity upgrades or members switching to PNIs in response to increased traffic demand (Labovitz, 2020). It is important to note that increased link usage of a network can be concealed by another network upgrading its port. However, the main takeaway is that many of the non-hypergiant ASes show changes in their link usage due to the lockdown-induced shifts in Internet usage. To gain a better understanding of this phenomenon, we reconsider the non-hypergiant ASes and their role in the Internet for further analysis.
3.4. Remote-work Relevant ASes
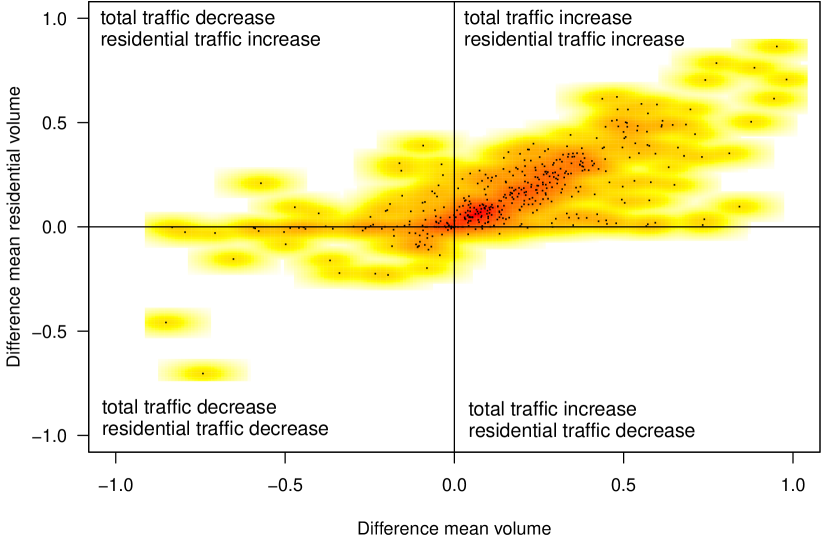
Having observed that the relative increase in traffic during working hours is more pronounced for non-hypergiants ASes, we study temporal patterns to identify which ASes are relevant for remote work, e.g., large companies with their own AS or ASes offering cloud-based products to be used by their employees. To this end, we use the ISP in Central Europe dataset, including its transit traffic, to compute the received and transmitted traffic per ASN.222We are aware of limitations of this vantage point, e.g., companies may have additional upstream providers. In addition, we compute the traffic that each one of them sends and receives to/from manually selected eyeball ASes, i.e., the large broadband providers in the region. Using this data, we define three distinct groups of ASes: those whose traffic ratio of workday/weekend traffic is dominated by workdays, those who are balanced, and those in which weekend traffic patterns dominate.
We focus on the first group, as we expect companies and enterprise subscribers deploying remote working solutions for their employees to fall into this class. We crosscheck their AS numbers with the WHOIS database. We find that a small number of content-heavy ASes also fall in this category. In Figure 6 we show the difference in normalized traffic volumes between a base week in February and one in March after the lockdown began (x-axis) vs. the normalized difference in traffic from/to eyeball ASes. We observe that some ASes experience major traffic shifts, but with almost no residential traffic (scattered along the x-axis, and close to 0 in the y-axis). However, for a majority of the ASes, there is a correlation between the increase in traffic involving eyeball networks and the total increase. This suggests that most of the traffic change is due to eyeball networks. Interestingly, some ASes suffer a decrease in total traffic, yet residential traffic grows (top-left quadrant). These are likely companies that either offer online services that became less popular and relevant during the lockdown or that do not generate traffic to the Internet “internally”. When looking at the other AS groups (not shown), the correlation still exists but is weaker.
These observations help us to put the implications of the lockdown measures in perspective: Some ASes need to provision a significant amount of extra capacity to support new traffic demands in an unforeseen fashion. In the following sections, we will explore which specific traffic categories have experienced most dramatic changes.
4. Transport-Layer Analysis
Based on the overall traffic pattern shifts identified in Section 3, in this section we focus on differences in raw transport port-protocol distributions.
We analyze the shift in application traffic due to the lockdown at two vantage points, the ISP in Central Europe (ISP-CE) and the IXP in Central Europe (IXP-CE). At both networks, we aggregate traffic volume statistics from four weeks described in Table 1. For each hour of the day, we keep separate traffic volume statistics and then compare these to the respective day and hour of the previous month, which allows us to identify diurnal patterns, and more importantly, changes therein.
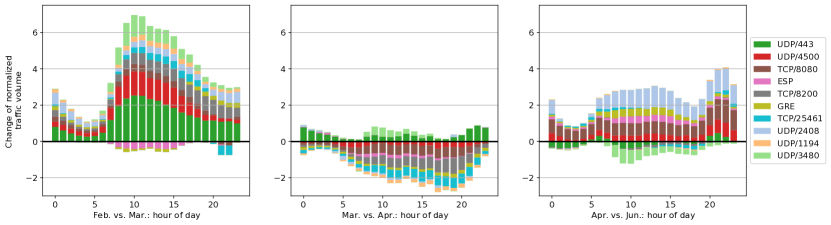
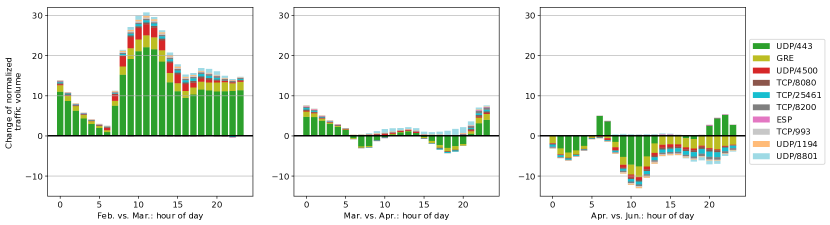
We plot the top transport ports for each vantage point. As the two most common ports TCP/443 and TCP/80 make up 80% and 60% of traffic at the ISP-CE and IXP-CE, respectively, any small changes in their traffic volume would dominate the plot. Therefore, we omit those from Figures 7 and 8 for clarity purposes. 333We also consider alternative HTTP port TCP/8080, rendered in the figures, but we do not observe any significant change in its usage. We instead focus on the top 3–12 ports. Figure 7 depicts changes in traffic volume per transport-layer port for the IXP-CE, and Figure 8 for the ISP-CE. Note that we aggregate the hours of day of all working days of a week into a single subplot. Plots for aggregated weekend days along with plots directly comparing changes to the base week of February are shown in Appendix C.
While both networks share similar top ports, their distribution, and the changes in these distributions over time, are very different. This reflects the different types of customers present at these vantage points. Recall, that the ISP-CE dataset consists of subscriber traffic, which is largely composed of end-users and small enterprises, while the IXP-CE one has a very diverse set of members across the entire Internet economy exchanging traffic over its platform. In general, we see a very strong increase at the IXP-CE as well as at the ISP-CE when comparing the changes in March (leftmost subplots), compared to the more gradual changes in the following months (middle and rightmost subplots).
Next, we analyze in-depth specific ports to more accurately attribute overall changes in diurnal patterns:
- QUIC::
-
Running on port UDP/443, QUIC is mainly used for streaming purposes by e.g., Google and Akamai (Rüth et al., 2018). QUIC traffic increases 30%–80% at the ISP-CE and about 50% at the IXP-CE when comparing traffic volumes in March with the base week of February. Once the lockdown starts, we see the largest increase at the ISP-CE in the morning hours. Moreover, at the IXP-CE the increase is more gradually distributed over the day. This likely reflects the behavior of entire families staying at home. In the months of April and June the traffic volumes of QUIC remain relatively stable, with some hours gaining traffic while other losing some.
- NAT traversal / IPsec / OpenVPN::
-
Port UDP/4500 is registered at IANA for IPsec NAT traversal and is commonly used by VPN solutions, Port UDP/1194 is OpenVPN’s default port. As more people are working from home and using VPNs to access their company or university network, we see an increase of both ports during working hours at the two vantage points in March. In the following weeks in April and June the traffic volumes for UDP/4500 stay above the traffic volume of the February base week, whereas OpenVPN’s volume recedes. Interestingly, GRE and ESP, which transport the actual IPsec VPN content, decrease at the IXP-CE in March during the lockdown, while GRE traffic sees a slight increase at the ISP-CE. To summarize, more people are using VPNs from their homes resulting in an increased need of NAT traversal, but VPN connections between companies which are the primary source of GRE and ESP traffic decrease over time. For an in-depth analysis of VPN traffic shifts, see Section 6.
- TV streaming::
-
On port TCP/8200 at the IXP-CE we see, similar to QUIC, how changes in user behavior affect the traffic profile. This port is used by an online streaming service for Russian TV channels. In March, we notice traffic volumes increasing throughout the day, shifting away from an evening centric traffic profile. We mainly observe this at the IXP-CE as it serves a broader and more international customer base. Additionally, the strong increase in March is not persisting over the following months.
- Cloudflare::
-
Port UDP/2408 is used by the CDN Cloudflare for their load balancer service (Cloudflare, 2020). We verify that the traffic indeed originates from Cloudflare prefixes. During our observation period, we see an increase in Cloudflare load balancer traffic at the IXP-CE in March and in June.
- Video conferencing::
-
The video communication tool Skype and the online collaboration service Microsoft Teams both use port UDP/3480, most likely for STUN purposes (Microsoft, 2020b, a). We confirm this by verifying that the addresses reside in prefixes owned by Microsoft. Additionally, we find a small number of non-Microsoft addresses in our data. During the lockdown in March, we see a large increase in UDP/3480 traffic at the IXP-CE, especially during working hours on workdays. At the ISP-CE it does not show up among the top 12 transport layer ports. Zoom, another video conferencing solution, uses UDP/8801 for its on-premise connector which companies can deploy to route all meeting traffic through it (Communications, 2020). At the ISP-CE this traffic increases by an order of magnitude from February to April. Since Zoom only became popular in Europe due to the lockdown, this drastic increase reflects the adoption of a new application by companies deploying connectors in their local network. These changes once again underline the fact that people working from home do change the Internet’s traffic profile. Zoom traffic decreases again in June, which might also be related to the vacation period resulting in fewer online office meetings.
- Email::
-
At the ISP-CE, especially during working hours, we find a 60% increase in TCP/993, which is used by IMAP over TLS to retrieve emails. While the overall amount of traffic is small compared to, e.g., QUIC, it is nevertheless an additional indicator for people conducting their usual office communication from their homes.
- Unknown port::
-
We could not map TCP/25461 to any known protocol or service. The addresses using this port mostly reside in prefixes owned by hosting companies.
To summarize, we find significant changes in the traffic profile for some popular transport-layer ports at both vantage points. This highlights the impact of drastic human behavior changes on traffic distribution during these weeks. We see an increase in work-related as well as entertainment-related traffic, reflecting the lockdown where people had to work and educate from home. This rationale is supported by the significant shift in workday patterns, especially at the ISP-CE from February to March when the lockdown began. As more people stay at home, the traffic levels which are dominated by residential customers increase steeply in the morning, compared to the steady growth observed over the whole day in February.
5. Application classes
Building on the analysis of the raw ports presented in the previous section, we now provide a more in-depth analysis of traffic shifts for different application classes. This is especially relevant for traffic using protocols such as HTTP(S), where a single transport-layer port number hides many different applications and use cases.
To investigate application layer traffic shifts, we apply a traffic classification based on a combination of transport port and traffic source/sink criteria. In total, we define more than 50 combinations of transport port and AS criteria based on scientific-related work (Böttger et al., 2018; Sivanathan et al., 2018), product and service documentations (Games, 2020; Cisco, 2020b; Microsoft, 2020a, b), and public databases (NCC, 2020; PeeringDB, 2020).
We aggregate the filtered data into 8 meaningful application classes representing applications consumed by end-users on a daily basis (See Table 4): Web conferencing and telephony (Web conf) covers all major conferencing and telephony providers, Collaborative working captures online collaboration applications, Email quantifies email communication, Video on Demand (VoD) covers major video streaming services, Gaming captures traffic from major gaming providers (cloud and multiplayer), Social media captures traffic of the most relevant social networks, Educational focuses on traffic from educational networks, and Content Delivery Networks (CDN) classifies content delivery traffic. Note that social networks, e.g., Facebook, also offer video telephony and content delivery services for their own products, which may be captured by this class but not by the more specific other classes.
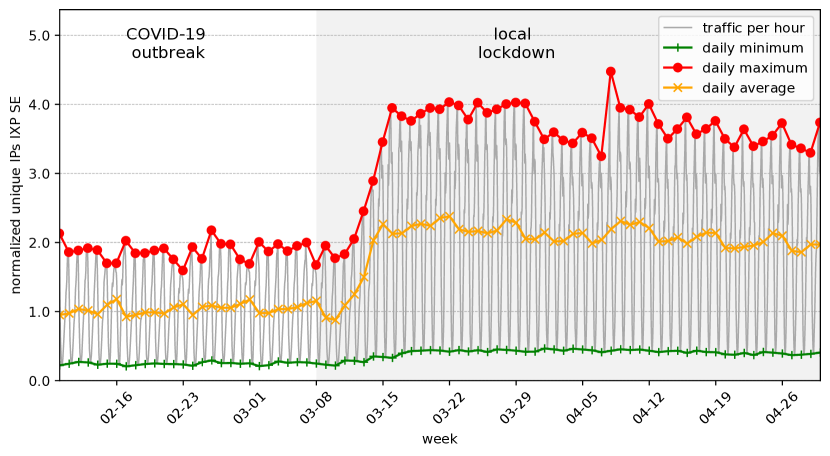
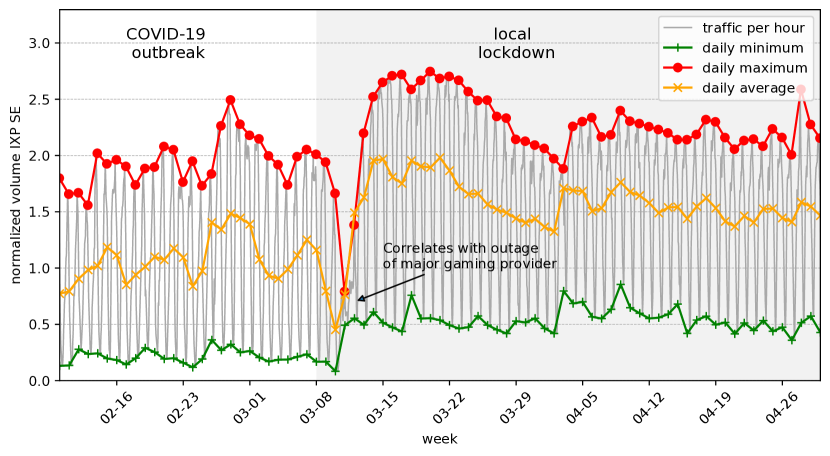
Figure 9 showcases the Gaming class at the IXP-SE vantage point. For this application class, we filter data of five gaming software/services providers and 57 typical gaming transport ports in various combinations (see Table 4). We then analyze the changes in usage behavior using two metrics: (1) the number of distinct source IP addresses, as a way to approximate the order of households, and (2) the traffic volume. Figure 9 shows clear changes when comparing multiplayer and cloud games before and during the lockdown. From week 10 on, i.e., when the local government imposed a lockdown, the number of unique IPs seen in the trace as well as the delivered volumes rose steeply with substantial gains of the daily minimum, average, and maximum. Notably, during the first lockdown week, the accounted volume plunges for two days to the lowest values observed in that time frame. We verified that this is not a measurement artifact. Instead, the drop correlates with an outage of a large gaming provider, which may be related to the sudden increase in users.
We perform the application classification for the different IXP vantage points (IXP-SE, IXP-CE, IXP-US) and for the ISP-CE.444In case of the ISP-CE we analyzed upstream as well as downstream traffic. As the differences between the weeks manifest in both directions in a very similar fashion we only show the downstream direction. To clearly present the large amount of information, we transform the data as follows.
- Week-wise comparison::
- Normalization and filtering::
-
After normalization as outlined in Section 2, we remove the early morning hours (2–7 am). The total volume of the vantage points hits its daily minimum during these hours, but does not change much during the lockdown. Removing these hours allows us to visualize more details of traffic shifts during the day in order to compare application classes of different traffic volumes as well as the relative growth between the base week and the other weeks.
- Difference to base week::
-
We visualize each week as the difference of the respective week and the base week. This enables quick visual identification of increased/decreased application class usage compared to pre-COVID times. We remove any growth above 200% and any decrease below 100%.
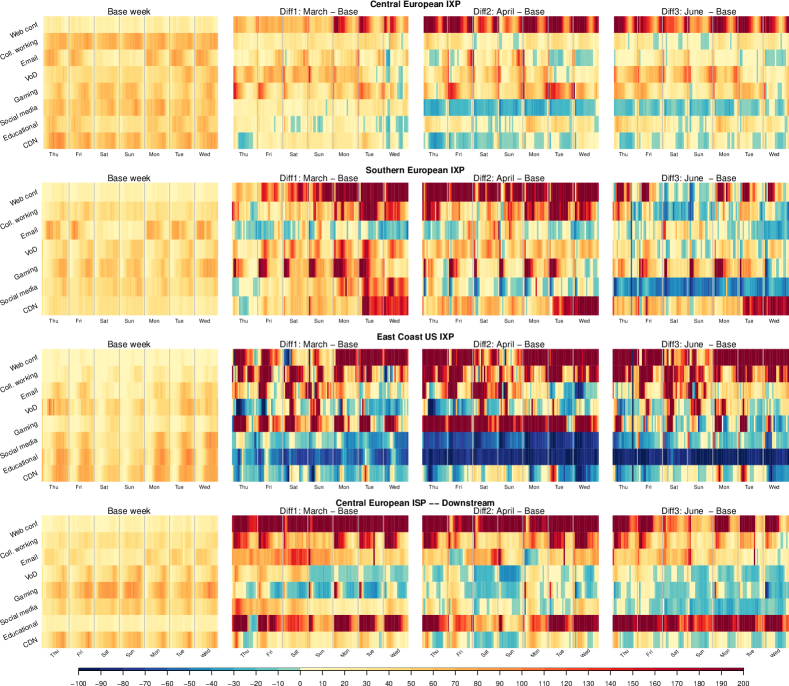
The condensed timelines of the different application classes are shown in Figure 10 for all four vantage points. We highlight our main observations next:
- Communication-related applications::
-
At all vantage points, Web conferencing applications show a dramatic increase of more than 200% during business hours, and at the ISP-CE, IXP-SE, and the IXP-US also on the weekends. In this category the ISP-CE experiences the largest growth in March right after the lockdown across all hours of the day. In June this trend is less pronounced, which corresponds with people slowly going back to their offices. Collaborative working mainly increases at the IXP-SE and the IXP-US, at the ISP-CE we see a vast increase on Thursday and Friday morning which persists until June—this might be due to coordination between work partners before the weekend. While in a lockdown situation one might expect a lot of additional Email communication, we see a different trend. At the IXP-CE and the IXP-SE Email actually declines during the lockdown and in June remains on a lower level than before the lockdown. Instead, Email rises at the ISP-CE it, but not as high as other traffic classes as Web conferencing. One possible explanation could be that many companies start connecting their remote employees via Virtual Private Networks (VPNs) and users connect to the mail systems via the VPN. We discuss VPN traffic in Section 6. For the IXP-US the trend is less pronounced, and we see phases of usage increase and decrease over time.
- Entertainment related applications::
-
VoD streaming application usage shows high growth rates at the European IXPs of up to 100%. Interestingly, ISP-CE only sees a slight growth of about 10% during the lockdown, while in June – well after the lockdown – the traffic volume drops back to the February level. Recall that the major streaming companies reduced their streaming resolution in Europe by mid-March (Netflix, 2020) for 30 days. In the case of the ISP-CE that covers the March as well as the April week.555The necessary measurements to quantify the impact of the resolution change by the VoD providers are beyond the scope of this work. In the US, the trend is the other way around. Notably, this may be a biased measurement, as at the IXP-US the measurement of the VoD class is based on only three ASes, one of which is very large. Consequently, the decrease may reflect a traffic engineering decision of the large AS, e.g., establishing a private network interconnect instead of peering. The strong growth of gaming applications is more coherent across all three IXP vantage points, especially during the day. While the ISP-CE shows a significant increase during morning hours, it generally leans towards declining. Note, that this effect is mainly caused by unusually high traffic levels in this category in February. Gaming applications, typically used in the evening or at weekends, are now used at any time. The trend starts to flatten in June—this may in relation with people going on vacation or spending more time outside. Moreover, we see an increase at the IXPs for Social media application traffic during the March week, while the effect quickly diminishes in April. In March the ISP experiences a 70% growth, which slows down in April but not as drastic as at the IXPs. The effects in this class correlate with the gradual de-escalation of the lockdown restrictions in Europe: as people are allowed to leave their homes freely again and resume social live, this traffic decreases. In June, social media usage has returned to figures slightly below the level of March across all vantage points.
- Other applications::
-
Educational networks and applications behave completely different at all vantage points. At the IXP-CE, their traffic remains relatively stable —as would be expected given students attending classes from home—, but at the ISP-CE, instead, it drastically increases by up to 200%. This growth could be attributed to some European educational networks providing video conferencing solutions, which are now being used by customers of the ISP-CE. Due to the lack of connected educational networks at the IXP-US, we omit this category at this vantage point. See Section 7 for an in-depth study of the traffic shifts in a large educational network. Likewise, CDN traffic increases in Europe, but does not grow much—even decreasing at times—in the US. Similar to VoD, there is a skewed distribution of CDNs present at the vantage point. Thus, a rerouting decision of a large player may explain the moderate loss of CDN traffic at the IXP-US.
To summarize, the use of communication-related applications increase during working hours, especially in Web conferencing. Entertainment related applications such as gaming and VoD are also consumed at any time of the day, as the become more demanded during the lockdown. Social media shows a strong initial increase which flattens over time. These observations complement and strengthen those made in Section 4. Together, they demonstrate the massive impact that the drastic change in human behavior caused by the COVID-19 pandemic had on application usage.
6. VPN Traffic Shift
As a response to the pandemic, many institutions asked their employees to work from home. A typical way to access internal company infrastructure from home is by using VPN services. As a result, we expect VPN traffic to increase after the lockdown.
Port-based classification. We apply a twofold approach to identify VPN traffic. First, we classify traffic as VPN traffic if the well-known transport ports and protocols are used exclusively by a VPN service. We only focus on major VPN protocols and identify IPsec (port 500, 4500), OpenVPN (1194), L2TP (1701), and PPTP (1723)—both on TCP and UDP.
Identifying VPN usage on TCP/443. Since there are, however, many VPN services using TCP/443 to tunnel VPN traffic, a pure port-based identification approach cannot distinguish this traffic from HTTPS. To limit the potential for misclassification, we employ a second approach using DNS data to identify IPs labeled as *vpn* but not as www. in the DNS. That is, we identify potential VPN domains by searching for *vpn* in any domain label left of the public suffix (Mozilla Foundation, 2020) (e.g., companyvpn3.example.com) in (1) 2.7B domains from TLS certificates that appeared in CT Logs during 2015–2020 and (2) 1.9B domains from Rapid7 Forward DNS queries of reverse DNS, zonefiles, TLS certificates from the end of March 2020, and (3) 8M domains found in the Cisco Umbrella toplist in 2020. We resolve all matching domains to 3M candidate IP addresses. In order to get a conservative estimate of VPN traffic over TCP/443, we then also resolve the domains from the same public suffix prepended with www (e.g., www.example.com). If the returned addresses of the *vpn* domain and the www domain match, we eliminate them from our candidates. This approach limits misclassifying Web traffic destined to the www domain as VPN traffic to the *vpn* domain, if they share the same IP address. After removing shared IP addresses, we end up with 1.7M candidate VPN IP addresses. We classify TCP/443 traffic to these VPN addresses as VPN traffic.
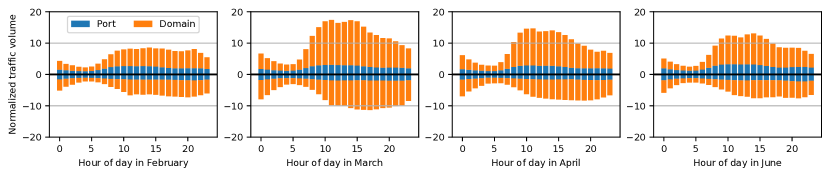
VPN traffic on the rise. In Figure 11 we report our findings using the port-based and domain-based VPN traffic identification approach. We use four weeks of flow data from the IXP in Central Europe and aggregate them into workdays and weekends. Interestingly, we see almost no change in port-based VPN traffic before and after the lockdown. When looking at the VPN traffic identified with the domain-based technique, we see a significant increase in VPN traffic. During workdays at working hours, VPN traffic increases by more than 200% in March compared to the base week in February. The increase on weekends is not as pronounced as during workdays, further indicating that these traffic shifts occur due to changes in user behavior (i.e., people working from home). When looking at the week in April, we still see a gain in VPN traffic compared to February, although not as large as in March. In June, VPN traffic decreases further compared to previous months, although its traffic volume on workdays remains well above the levels observed for the base week of February. This is likely due to the gradual lifting of lockdown restrictions in Central Europe and the beginning of the summer holiday season, resulting in fewer people working from home in June compared to March.
In conclusion, we see a clear pattern of VPN traffic increase during working hours due to lockdown restrictions. Moreover, as the visible increase of VPN traffic was limited to TCP/443 on *vpn* domains, we argue that VPN identification solely on a transport port basis vastly undercounts actual VPN traffic. To mitigate this problem, we propose to identify seemingly HTTPS flows as VPN traffic using domain data. This allows for a more accurate picture of the VPN landscape.
7. Educational Network
In this section, we study the drastic changes induced by the lockdown measures as seen by a large European educational and research network, which connects 16 independent universities and research centers in the metropolitan region of Madrid.
As a response to the pandemic, on March 9, 2020 the regional government announced the closure of the entire educational system from March 11 onward. Consequently, users of this network (e.g., students, faculty, researchers, staff) were forced to adjust and continue their teaching and research activities from home. Only staff for critical maintenance tasks and security were allowed to be on-premises. Soon after, on March 13, the National Government declared the national state of emergency, which was effective the next day. This drastic change in the activities performed at every institution caused traffic shifts that differ noticeably from those observed in any other vantage point we studied before.
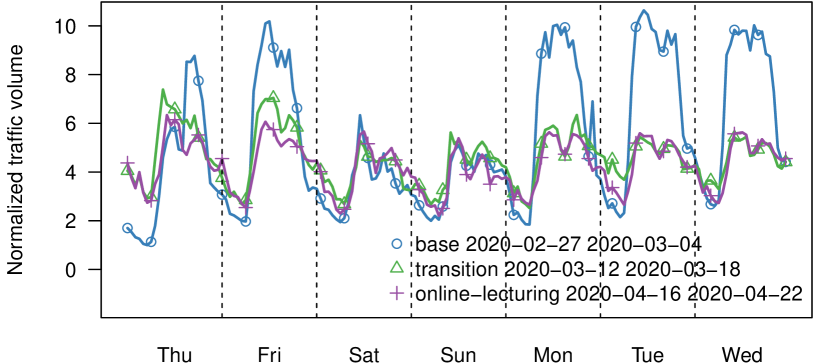
Traffic volume analysis. We study the impact of the lockdown measures on traffic volumes at the academic network by comparing three key weeks: (1) one week before announcing that the research and educational system will be closed down (February 27 to March 4), serving as baseline, (2) the week when the lockdown happened (March 12–18) to observe the transitioning effect, and (3) a week one month after lectures moved to a fully online model for most universities (April 16–22).666As opposed to the previous sections, we did not include the results of our traffic analysis of the June week. At this time, Madrid was still in an intermediary stage of the de-scalation process. Overall, EDU traffic dropped dramatically from mid-June as most lectures and academic activities ended for the semester. Unfortunately, we lack access to historical traffic captures in summer time to quantify the impact that the confinement measures had in academic traffic.
Figure 12(a) shows the normalized total traffic volume for the three weeks considered. We observe a significant drop in traffic volume on working days between the baseline week and the two other weeks, with a maximum decrease of up to 55% on Tuesday and Wednesday. Traffic on weekends, however, increased slightly: 14% and 4% on Saturday and Sunday, respectively. The traffic reduction on working days is expected since users no longer use the academic network on campuses and in research facilities. We again observe that work and weekend days are becoming more similar in terms of total traffic. This can be the result of a new weekly working pattern with less distinction between both types of days due to lockdown. Similarly, a close inspection of the hourly traffic pattern reveals a traffic increase from 11% to 24% between 9 pm and 7 am. This could be due to users working more frequently at unusual times, but also potentially caused by overseas students (mainly from Latin America and East Asia as suggested by the AS numbers from which these connections come from) who access these resources from their home countries.
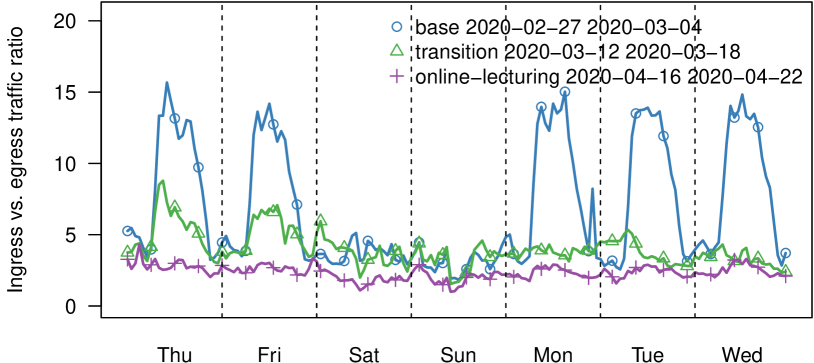
Traffic in/out ratio analysis. We depict the ingress vs. egress traffic ratio in Figure 12(b), showing that the ratio changed substantially after the lockdown. In the days before the lockdown, incoming traffic was up to 15x the volume of outgoing traffic during workdays. During the transition phase, the ratio halves, and it is the lowest during the third week (online lecturing), where weekend vs. workday pattern is no longer visible. This change of traffic asymmetry can be explained by the nature of remote work. On the one end, users connect to the network services mainly to access resources, hence the increase in outgoing traffic. On the other end, all external (i.e., Internet-based) resources requested during work are no longer accessed from the educational network but from the users’ residential network, hence the drastic reduction in incoming traffic.
Connection-level analysis. To better understand the traffic shifts, we perform a connection-level analysis, focusing on selected traffic classes. We refer the reader to Appendix A for a list of the most relevant classes considered in this section. We determine whether the connections are incoming or outgoing using the AS numbers of each end-point, interfaces, and port pairs. For instance, a connection established from a residential ISP towards an HTTPS server hosted inside the educational network is labeled as ‘‘incoming’’ connection. We cannot accurately determine the directionality for 39% of the flows observed at this academic network, many of which appear to be P2P-like applications, marginal protocols, and non-well-known port numbers.
The median number of the total daily connections after the declaration of the state of emergency grows by 24% when compared to the pre-lockdown baseline (ratio of median daily connections before and after March 11, 2020). The usual workday-weekend differences also decrease, but are still noticeable during the Easter break. If we look at the directionality of the connections, the median number of incoming connections doubles after the lockdown, while the number of outgoing connections decreases almost by half. This is a direct consequence of users having to access services hosted at the academic networks from the outside, which validates the observations made in the volumetric analysis.
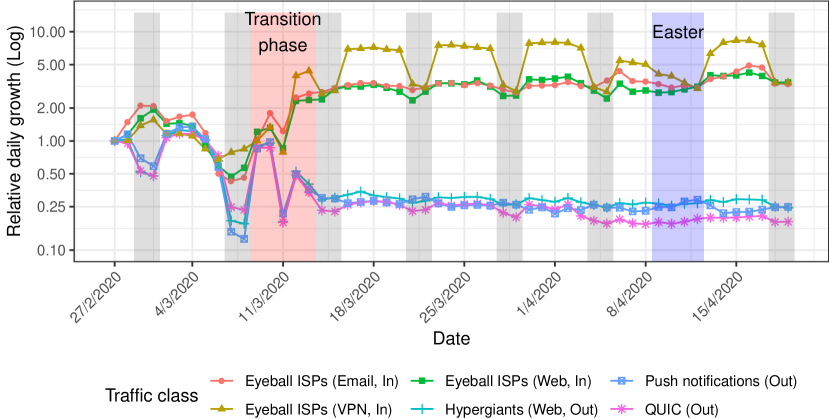
Yet, the most interesting dynamics occur for specific traffic classes. While the average number of web connections does not change substantially, there is a radical shift in the ratio of incoming and outgoing connections and temporal patterns due to working from home. Figure 13 shows the daily relative growth for selected traffic categories. After the transition phase, the daily traffic patterns for many traffic classes achieve a new status quo. The median number of daily incoming web connections increases by over 77% and the number of outgoing connections decreases by more than half. As we can see in Figure 13, this reduction is even more pronounced for outgoing web traffic towards hypergiants or QUIC. In both cases, the number of outgoing connections is much lower than in pre-COVID-19 weekends. These drops correlate with the decrease in outgoing connections to push notification services and mobile services for iOS and Android (65% decrease on average)—i.e., the number of mobile devices in the networks decreases—as well as towards streaming services like Spotify (83% decrease).
We focus on those traffic classes that are associated with remote working and lecturing. Table 3 provides the definition of the classes discussed in this section. Precisely, the median incoming connection growth for web, email, VPN, Remote Desktop, and SSH connections is 1.7x, 1.8x, 4.8x, 5.9x, and 9.1x respectively. The significant increase in incoming web traffic is caused by users accessing online teaching material and other resources hosted at some of these universities, primarily from eyeball ISPs from the same country (2.8x growth). As mentioned in the volumetric analysis, we can observe a shift in the hourly connection patterns for both incoming and outgoing web connections. Traditional working hours are still noticeable—including a drop in connections during lunch—but after the COVID-19 outbreak, a significant fraction of users access these services late in the evening as well as early in the morning. If we analyze the origin ASes for these out-of-time connections, we can observe that many connections are established from overseas eyeball ASes from Latin America (1.8x), but also from North America (3.4x). In fact, time zone differences are noticeable. National users access web resources hosted at the university from 10 am to 9 pm, with a valley from 2 to 4 pm. Latin American users start connecting at 5 pm, presenting a peak from midnight until 7 am (peak hours are 3 and 4 am). Interestingly, while the temporal patterns for VPN, web, and remote desktop are correlated, SSH traffic patterns are irregular.
Takeaway. Academic networks experience drastic traffic shifts due to COVID-19. Traffic volume, directionality ratios, and its source and destination are radically different from before COVID-19. This behavior is antagonistic, yet complementary, to the one observed in residential ISPs.
8. Related Work
Our study provides a testimonial of the impact of an unprecedented medical crisis in recent human history on the operation of the Internet. Previous studies followed a similar approach to ours, i.e., collect measurements at different vantage points, to understand the impact of other events on the Internet. Partridge et al. collected and analyzed routing and protocol data during and after 9/11 to understand the resilience of the Internet under stress (C. Partridge, P. Barford, D. D. Clark, S. Donelan, V. Paxson, J. Rexford, and M. K. Vernon, 2003). Their findings showed that, overall, the Internet operation was robust: Although unexpected outages did happen, they only had a local impact. Notice, however, that the penetration and importance of the Internet in our life has significantly increased in the last twenty years, and the global nature of the COVID-19 pandemic crisis makes this case unique. Other studies focus on physical phenomena, e.g., earthquakes (Cho et al., 2011) or severe weather conditions (Padmanabhan et al., 2019; Durumeric et al., 2013), and power outages (Bayat et al., 2020; Bogutz et al., 2019) to understand the Internet behavior and the change on Internet user activity. Beyond physical phenomena, also human-triggered events such as major update roll-outs can cause substantial traffic shifts (Blendin et al., 2018).
The study of the impact of the COVID-19 pandemic to the performance and traffic of the Internet has attracted significant attention in the form of blogs posts (McKeay, 2020a, b; Comcast, 2020; Telegeography, 2020; Google, 2020b) and more recently in presentations at network operator conferences (Labovitz, 2020). By the time of our submission, a limited number of research studies have been already published. Favale et al. report and analyze the impact of the remote learning activity by 16k students on the Politecnico di Torino campus network due to the lockdown enforcement (Favale et al., 2020). The university utilized an in-house online teaching solution. Thus, although the impact of remote learning on the campus network shares similarities with our analysis of the academic and research network in our study, there are also significant differences. Another study (Zakaria et al., 2020) analyzed Wi-Fi network data collected at university campuses in Singapore and the US during the pandemic. Their results show that the activity on campuses decreases, but mobility did not, as this would require more drastic measures by the governments. In our study, we found that the mobility patterns reduced drastically in Europe, most likely due to the stricter measures and complete lockdowns. A study of the access patterns of Wikipedia shows that during the pandemic Web visitors had an increased interest in topics such as health (Ribeiro et al., 2020). This increase was even more pronounced for countries that were in the epicenter of the pandemic. Parallel to our work, researchers evaluated (1) the impact of the pandemic on traffic of a UK mobile network operator reflecting changes in users’ mobility (Lutu et al., 2020), (2) changes in traffic demand at a major social network (Boettger et al., 2020), (3) transactions volumes at an underground market during the pandemic concluding that the observed higher transaction volumes are a market stimulus rather than an effect of the pandemic (Vu et al., 2020), and (4) the impact of the pandemic on Internet latency in various European countries, finding an increase in the variance of additional latency and packet loss (Candela et al., 2020).
9. Discussion
Internet operation during the pandemic: a success story. The COVID-19 pandemic “underscored humanity’s growing reliance on digital networks for business continuity, employment, education, commerce, banking, healthcare, and a whole host of other essential services” (ITU, 2020). At the beginning of the pandemic, changes in user demand for online services raised concerns for network operators, e.g., to keep networks running smoothly especially for life-critical organizations such as hospitals (Snijders, 2020). In fact, the pandemic increased the demand for applications supporting remote teaching and working to guarantee social distancing as shown in our analysis across all vantage points. The Internet could handle this new load due to the flexibility and elasticity that cloud services offer, and the increasing connectivity of cloud providers (Labovitz et al., 2010; C. Labovitz, 2019; Chiu et al., 2015; Schlinker et al., 2017; Yap et al., 2017). Our results confirm that most of the applications with the highest absolute and relative increases are cloud-based. Moreover, the adoption of best practices on designing, operating, and provisioning networks contributed to the smooth transition to the new normal. Due to the advances in network automation and deployment, e.g., automated configuration management and robots installing cross connects at IXPs without human involvement, it was possible to cope with the increased demand. For example, DE-CIX Dubai managed to quickly enable new ports within a week for Microsoft which was selected as the country’s remote teaching solution for high schools (DE-CIX, 2020). In summary, our study demonstrates that over-provisioning, network management, and automation are key to provide resilient networks that can sustain drastic and unexpected shifts in demand such as those experienced during the COVID-19 pandemic.
Taming the traffic increase. In this paper, we report an increase in traffic in the order of 15-20% within days after the lockdown began. This is in line with reports of ISPs and CDNs (Labovitz, 2020; Comcast, 2020; McKeay, 2020a, b) as well as IXPs (Sanghani, 2020). Typically, ISPs and CDNs are prepared for a traffic increase of 30% in a single year period (C. Labovitz, 2019; Leighton, 2020; Cisco, 2020a). While these are yearly plannings, the pandemic created substantial shifts within only a few days. As a result, ISPs either needed to benefit from over-provisioned capacity—e.g., to handle unexpected traffic spikes such as attacks or flash-crowd events—or add capacity very quickly. We observed port capacity increases in the order of 1,500 Gbps (3%) across many IXP members at the IXP-CE alone (see Section 3.1). Beyond our datasets, some networks publicly reported that traffic shifts due to the pandemic resulted in partial connectivity issues and required new interconnections (DFN, 2020; Schilz and Maunier, 2020). When we turn our attention to traffic peaks, we notice that the increase is even smaller. Traffic engineering focuses on peak traffic increase as this requires more network resources. The effect of the pandemic fills the valleys during the working hours and has a moderate increase in the peak traffic, which can be handled by well-provisioned networks that are prepared for sudden surges of peak traffic by 30% or more, due to attacks, flash-crowds, and link failures that shift traffic to other links. One concern that network operators raised in March brought awareness to network instabilities that might occur due to traffic shifts (Snijders, 2020). While on the one hand we find no evidence that the traffic shifts due to the pandemic impact network operation of our vantage points, individual links experience drastic increases in traffic—way beyond the overall 15-20%. Such increases arise unexpectedly to some network operators and may create a need for port upgrades. On the other hand, the vantage points in this paper range from extremely large to moderate sizes with sufficient resources and a lot of experience in network provisioning and resilience. In general, smaller networks with limited resources may not be able to plan with sufficient spare capacities and fast enough reaction times to compensate for such sudden changes in demand.
Substantial shift in traffic pattern. From a network operator perspective, coping with the pandemic has required some port capacity upgrades but otherwise does not appear to impact operation. The ability of network operators to quickly add capacity when needed highlights that the Internet infrastructure works well at large, despite some challenges to access data centers imposed by the lockdown. From the perspective of the traffic mix, the pandemic, however, results in substantial changes in traffic, ranging from shifted diurnal pattern to traffic composition. This represents a remarkable shift in Internet traffic that is, based on our observations, handled surprisingly well by the Internet core at large supposedly because many operators are prepared and can react quickly to new demands. While the pandemic represents a rather extreme and exceptional case, one may argue that with the growing intertwining of the Internet and our modern society such events can occur more often. In any case, the COVID-19 pandemic highlights that user behavior can change quickly and network operators need to be prepared for sudden demand changes.
10. Conclusion
The COVID-19 pandemic is a—hopefully once in a lifetime—event that drastically changed working and social habits for billions of people. Yet, life continued thanks to the increased digitization and resilience of our societies, with the Internet playing a critical support role for businesses, education, entertainment, and social interactions. In this paper, we analyzed network flow data from multiple vantage points, including a large academic network and a large ISP at the edge, and, at the core, three IXPs located in Europe and the US. Together, they allow us to gain a good understanding of the lockdown effect on Internet traffic in more developed countries.
Our study reveals the importance of using different lenses to fully understand the COVID-19 pandemic’s impact at the traffic level: Mornings and late evening hours see more traffic. Workday traffic patterns are rapidly changing and the relative difference to weekend patterns is disappearing. Applications for remote working and education, including VPN and video conferencing, see traffic increases beyond 200%. For other parts of the Internet, such as educational networks serving university campuses, we find decreasing traffic demands due to the absence of users but a drastic increase in certain applications enabling remote working and lecturing. For some networks, we observe that traffic ratios—including sources and destinations—, are radically different from a pre-COVID-19 pandemic scenario. These observations highlight the importance of approaching traffic engineering with a focus that looks beyond hypergiant traffic and popular traffic classes to consider “essential” applications for remote working.
With the evidence provided in this paper, we conclude that the Internet—from the perspective of our vantage points—did its job and coped well with unseen and rapid traffic shifts. Related work, however, reported performance degradation in less developed regions (Boettger et al., 2020). The unseen traffic shifts we observe due to the implementation of confinement measures underline the importance of the Internet’s distributed nature to react amicably to such events and enhance society’s resilience.
Acknowledgements
The authors would like to acknowledge the support offered by David Rincón and César Sánchez (IMDEA Software Institute and REDIMadrid) to access the academic network dataset. This work has been partially funded by the Federal Ministry of Education and Research of Germany (BMBF, grants “Deutsches Internet-Institut” 16DII111, 5G-INSEL 16KIS0691 and AIDOS 16KIS0975K), the Spanish Ministry of Science, Innovation and Universities (grant TIN2016-79095-C2-2-R), and by the Comunidad de Madrid (grants EdgeData-CM P2018/TCS-4499 and CYNAMON-CM P2018/TCS-4566, co-financed by European Structural Funds ESF and FEDER), and by the European Research Council (ERC) Starting Grant ResolutioNet (ERC-StG-679158). The opinions, findings, and conclusions or recommendations expressed are those of the authors and do not necessarily reflect those of any of the funders.
References
- (1)
- Bayat et al. (2020) N. Bayat, K. Mahajan, S. Denton, V. Misra, and D. Rubenstein. 2020. Down for Failure: Active Power Status Monitoring. arXiv, https://arxiv.org/abs/1912.03357.
- Blendin et al. (2018) J. Blendin, F. Bendfeldt, I. Poese, B. Koldehofe, and O. Hohlfeld. 2018. Dissecting Apple’s Meta-CDN during an iOS Update. In ACM IMC.
- Boettger et al. (2020) T. Boettger, G. Ibrahim, and B. Vallis. 2020. How the Internet reacted to Covid-19 — A perspective from Facebook’s Edge Network. In ACM IMC.
- Bogutz et al. (2019) R. Bogutz, Y. Pradkin, and J. Heidemann. 2019. Identifying Important Internet Outages. In IEEE Big Data.
- Böttger et al. (2017) T. Böttger, F. Cuadrado, G. Tyson, I. Castro, and S. Uhlig. 2017. A Hypergiant’s View of the Internet. ACM SIGCOMM CCR 47, 1 (2017).
- Böttger et al. (2018) T. Böttger, F. Cuadrado, and S. Uhlig. 2018. Looking for Hypergiants in PeeringDB. ACM CCR 48, 3 (2018).
- C. Labovitz (2019) C. Labovitz. 2019. Internet Traffic 2009-2019. APRICOT 2019.
- C. Partridge, P. Barford, D. D. Clark, S. Donelan, V. Paxson, J. Rexford, and M. K. Vernon (2003) C. Partridge, P. Barford, D. D. Clark, S. Donelan, V. Paxson, J. Rexford, and M. K. Vernon. 2003. The Internet Under Crisis Conditions: Learning from September 11. The National Academy Press.
- Candela et al. (2020) M. Candela, V. Luconi, and A. Vecchio. 2020. Impact of the COVID-19 pandemic on the Internet latency: A large-scale study. Computer Networks 182 (2020).
- Chiu et al. (2015) Y. Chiu, B. Schlinker, A. B. Radhakrishnan, E. Katz-Bassett, and R. Govindan. 2015. Are We One Hop Away from a Better Internet?. In SIGCOMM HotNets.
- Cho et al. (2011) K. Cho, C. Pelsser, R. Bush, and Y. Won. 2011. The Japan Earthquake: the impact on traffic and routing observed by a local ISP. In ACM CoNEXT SWID workshop.
- Cisco (2012a) Cisco. 2012a. https://www.cisco.com/c/en/us/td/docs/routers/asr9000/software/asr9k_r4-2/bng/configuration/guide/b_bng_cg42asr9k/b_bng_cg42asr9k_chapter_01.pdf.
- Cisco (2012b) Cisco. 2012b. Introduction to Cisco IOS NetFlow - A Technical Overview. https://www.cisco.com/c/en/us/products/collateral/ios-nx-os-software/ios-netflow/prod_white_paper0900aecd80406232.html.
- Cisco (2020a) Cisco. 2020a. Cisco Annual Internet Report. https://www.cisco.com/c/en/us/solutions/executive-perspectives/annual-internet-report/index.html.
- Cisco (2020b) Cisco. 2020b. Network Requirements for Webex Teams Services. https://help.webex.com/en-us/WBX000028782/Network-Requirements-for-Webex-Teams-Services.
- Claise et al. (2013) B. Claise, B. Trammell, and P. Aitken. 2013. RFC 7011: Specification of the IPFIX Protocol for the Exchange of Flow Information.
-
Cloudflare (2020)
Cloudflare.
2020.
General best practices for load balancing at your
origin with Cloudflare.
https://support.cloudflare.com/hc/en-us/articles/212794707-
General-best-practices-for-load-balancing-at-your-origin-with-Cloudflare. - Comcast (2020) Comcast. 2020. COVID-19 Network Update. https://corporate.comcast.com/covid-19/network.
-
Commission (2020)
European Commission.
2020.
Commission and European regulators calls on
streaming services, operators and users to prevent network congestion.
https://ec.europa.eu/digital-single-market/en/news/commission-and-european-regulators-calls-streaming-services-
operators-and-users-prevent-network. - Communications (2020) Zoom Video Communications. 2020. Configure Meeting Connector Controller Port Forwarding. https://support.zoom.us/hc/en-us/articles/204898919-Configure-Meeting-Connector-Controller-Port-Forwarding.
- DE-CIX (2020) DE-CIX. 2020. DE-CIX Virtual Get-together - Focus Middle East & Asia 22 Apr 2020. https://www.youtube.com/watch?v=DfPt10aopns
- DFN (2020) DFN. 2020. German National Research and Education Network: COVID-19 Newsticker. https://www.dfn.de/alle-meldungen-aus-dem-newsticker-zur-covid-19-pandemie/
- Dischinger et al. (2010) M. Dischinger, M. Marcon, S. Guha, K. Gummadi, R. Mahajan, and S. Saroiu. 2010. Glasnost: Enabling End Users to Detect Traffic Differentiation. In NSDI.
- Dobrian et al. (2011) F. Dobrian, A. Awan, D. Joseph, A. Ganjam, J. Zhan, V. Sekar, I. Stoica, and H. Zhang. 2011. Understanding the Impact of Video Quality on User Engagement. In ACM SIGCOMM.
- Durumeric et al. (2013) Z. Durumeric, E. Wustrow, and J. A. Halderman. 2013. ZMap: Fast Internet-Wide Scanning and its Security Applications. In USENIX Security Symposium.
- Favale et al. (2020) T. Favale, F. Soro, M. Trevisan, I. Drago, and M. Mellia. 2020. Campus Traffic and e-Learning during COVID-19 Pandemic. https://arxiv.org/abs/2004.13569.
- Forbes (2020) Forbes. 2020. Netflix Starts To Lift Its Coronavirus Streaming Restrictions. https://www.forbes.com/sites/johnarcher/2020/05/12/netflix-starts-to-lift-its-coronavirus-streaming-restrictions/#7bcba5bf4738.
- Games (2020) Riot Games. 2020. League of Legends: Troubleshooting Connection Issues. https://support-leagueoflegends.riotgames.com/hc/en-us/articles/201752664-Troubleshooting-Connection-Issues.
- Garcia-Dorado et al. (2012) J. L. Garcia-Dorado, A. Finamore, M. Mellia, M. Meo, and M. Munafo. 2012. Characterization of ISP Traffic: Trends, User Habits, and Access Technology Impact. IEEE Transactions on Network and Service Management 9 (2012). Issue 2.
- Google (2020a) Google. 2020a. COVID-19 Community Mobility Report. https://www.google.com/covid19/mobility/.
- Google (2020b) Google. 2020b. Keeping our network infrastructure strong amid COVID-19. https://www.blog.google/inside-google/infrastructure/keeping-our-network-infrastructure-strong-amid-covid-19/.
- Huang et al. (2013) J. Huang, F. Qian, Y. Guo, Y. Zhou, Q. Xu, Z. M. Mao, S. Sen, and O. Spatscheck. 2013. An In-depth Study of LTE: Effect of Network Protocol and Application Behavior on Performance. In ACM SIGCOMM.
- in the Dark (2005) BLINC: Multilevel Traffic Classification in the Dark. 2005. T. Karagiannis and D. Papagiannaki and M. Faloutsos. In ACM SIGCOMM.
- ITU (2020) ITU. 2020. Press Release: New ’State of Broadband’ report warns of stark inequalities laid bare by COVID-19 crisis. https://www.itu.int/en/mediacentre/Pages/PR20-2020-broadband-commission.aspx.
- Krishnan and Sitaraman (2012) S. S. Krishnan and R. K. Sitaraman. 2012. Video Stream Quality Impacts Viewer Behavior: Inferring Causality using Quasi-Experimental Designs. In ACM IMC.
- Labovitz (2020) C. Labovitz. 2020. Pandemic Impact on Global Internet Traffic. NANOG 79.
- Labovitz et al. (2010) C. Labovitz, S. Lekel-Johnson, D. McPherson, J. Oberheide, and F. Jahanian. 2010. Internet Inter-Domain Traffic. In ACM SIGCOMM.
- Lakhina et al. (2004) A. Lakhina, K. Papagiannaki, M. Crovella, C. Diot, E. D. Kolaczyk, and N. Taft. 2004. Structural Analysis of Network Traffic Flows. In ACM SIGMETRICS.
- Leighton (2020) T. Leighton. 2020. Can the Internet keep up with the surge in demand? https://blogs.akamai.com/2020/04/can-the-internet-keep-up-with-the-surge-in-demand.html.
- Lutu et al. (2020) A. Lutu, D. Perino, M. Bagnulo, E. Frias-Martinez, and J. Khangosstar. 2020. A Characterization of the COVID-19 Pandemic Impact on a Mobile Network Operator Traffic. In ACM IMC.
- Maier et al. (2009) G. Maier, A. Feldmann, V. Paxson, and M. Allman. 2009. On Dominant Characteristics of Residential Broadband Internet Traffic. In ACM IMC.
- McKeay (2020a) M. McKeay. 2020a. Parts of a whole: Effect of COVID-19 on US Internet Traffic. https://blogs.akamai.com/sitr/2020/04/parts-of-a-whole-effect-of-covid-19-on-us-internet-traffic.html.
- McKeay (2020b) M. McKeay. 2020b. The Building Wave of Internet Traffic. https://blogs.akamai.com/sitr/2020/04/the-building-wave-of-internet-traffic.html.
- Microsoft (2020a) Microsoft. 2020a. Prepare your organization’s network for Microsoft Teams. https://docs.microsoft.com/en-us/microsoftteams/prepare-network.
- Microsoft (2020b) Microsoft. 2020b. Which ports need to be open to use Skype on desktop? https://support.skype.com/en/faq/FA148/which-ports-need-to-be-open-to-use-skype-on-desktop.
- Mozilla Foundation (2020) Mozilla Foundation. 2020. Public Suffix List. https://publicsuffix.org/.
- NCC (2020) RIPE NCC. 2020. RIPE Database Query. https://apps.db.ripe.net/db-web-ui/query.
- Netflix (2020) Netflix. 2020. Reducing Netflix traffic where it’s needed while maintaining the member experience. https://media.netflix.com/en/company-blog/reducing-netflix-traffic-where-its-needed.
- Otto et al. (2011) J. S. Otto, M. Sánchez, D. Choffnes, F. Bustamante, and G. Siganos. 2011. On Blind Mice and the Elephant: Understanding the Network Impact of a Large Distributed System. In ACM SIGCOMM.
- Padmanabhan et al. (2019) R. Padmanabhan, A. Schulman, D. Levin, and N. Spring. 2019. Residential Links Under the Weather. (2019).
- PeeringDB (2020) PeeringDB. 2020. PeeringDB. https://www.peeringdb.com.
- Pujol et al. (2019) E. Pujol, I. Poese, J. Zerwas, G. Smaragdakis, and A. Feldmann. 2019. Steering Hyper-Giants’ Traffic at Scale. In Proceedings of ACM CoNEXT 2019.
- REDImadrid (2020) REDImadrid. 2020. REDImadrid. https://www.redimadrid.es/.
- Ribeiro et al. (2020) M. H. Ribeiro, K. Gligoric, M. Peyrard, F. Lemmerich, M. Strohmaier, and R. West. 2020. Sudden Attention Shifts on Wikipedia Following COVID-19 Mobility Restrictions. https://arxiv.org/abs/2005.08505.
- Rüth et al. (2018) J. Rüth, I. Poese, C. Dietzel, and O. Hohlfeld. 2018. A First Look at QUIC in the Wild. In PAM.
- Sanghani (2020) B. Sanghani. 2020. COVID-19 & IXPs. RIPE 80, https://ripe80.ripe.net/wp-content/uploads/presentations/27-ripe80-covid-ixp-1.pdf.
- Schilz and Maunier (2020) B. Schilz and R. Maunier. 2020. Experience on deploying a new remote PoP during COVID-19 restriction. RIPE 80, https://ripe80.ripe.net/wp-content/uploads/presentations/26-Volterra-Ripe-connect-presentation.pdf.
- Schlinker et al. (2017) B. Schlinker, H. Kim, T. Cui, E. Katz-Bassett, H. V. Madhyastha, I. Cunha, J. Quinn, S. Hasan, P. Lapukhov, and H. Zeng. 2017. Engineering Egress with Edge Fabric: Steering Oceans of Content to the World. In ACM SIGCOMM.
- Shafiq et al. (2011) M. Z. Shafiq, L. Ji, A. X. Liu, and J. Wang. 2011. Characterizing and ModelingInternet Traffic Dynamics of Cellular Devices. In ACM SIGMETRICS.
- Sivanathan et al. (2018) Arunan Sivanathan, Hassan Habibi Gharakheili, and Vijay Sivaraman. 2018. Can We Classify an IoT Device using TCP Port Scan? 1–4. https://doi.org/10.1109/ICIAFS.2018.8913346
- Snijders (2020) J. Snijders. 2020. Internet Network Operations during Pandemics. https://www.youtube.com/watch?v=tFeVlzBxICc
- Telegeography (2020) Telegeography. 2020. State of the Network: Updates on Covid-19. https://www2.telegeography.com/network-impact.
- Timberg (2020) C. Timberg. 2020. The Washington Post, April 6, 2020 YourInternetisworking.ThanktheseColdWar-erapioneerswhodesigneditto%****␣paper.bbl␣Line␣725␣****handlealmostanything.
- Trevisan et al. (2018) M. Trevisan, D. Giordano, I. Drago, M. Mellia, and M. Munafo. 2018. Five Years at the Edge: Watching Internet from the ISP Network. In CoNEXT.
- Vu et al. (2020) A. V. Vu, J. Hughes, I. Pete, B. Collier, Y. T. Chua, I. Shumailov, and A. Hutchings. 2020. Turning Up the Dial: the Evolution of a Cybercrime Market Through Set-up, Stable, and COVID-19 Eras. In ACM IMC.
- Xie et al. (2008) H. Xie, Y. R. Yang, A. Krishnamurthy, Y. G. Liu, and A. Silberschatz. 2008. P4P: Provider Portal for Applications. In ACM SIGCOMM.
- Xu et al. (2011) Q. Xu, J. Huang, Z. Wang, F. Qian, A. Gerber, and Z. M. Mao. 2011. Cellular Data Network Infrastructure Characterization and Implication on Mobile Content Placement. (2011).
- Yap et al. (2017) K-K. Yap, M. Motiwala, J. Rahe, S. Padgett, M. Holliman, G. Baldus, M. Hines, T. Kim, A. Narayanan, A. Jain, V. Lin, C. Rice, B. Rogan, A. Singh, B. Tanaka, M. Verma, P. Sood, M. Tariq, M. Tierney, D. Trumic, V. Valancius, C. Ying, M. Kallahalla, B. Koley, and A. Vahdat. 2017. Taking the Edge off with Espresso: Scale, Reliability and Programmability for Global Internet Peering. In ACM SIGCOMM.
- Zakaria et al. (2020) C. Zakaria, A. Trivedi, M. Chee, P. Shenoy, and R. Balan. 2020. Analyzing the Impact of Covid-19 Control Policies on Campus Occupancy and Mobility via Passive WiFi Sensing. https://arxiv.org/abs/2005.12050.
Appendix A Traffic Classification
To the best of our knowledge, there is no established and comprehensive classification of flow data into traffic classes. Even if such a classification existed, it would be a constantly moving target and highly dependent on the vantage point. Thus, we have compiled classifications based on scientific-related work such as (Böttger et al., 2018; Sivanathan et al., 2018), product and service documentations (Games, 2020; Cisco, 2020b; Microsoft, 2020a, b), and public databases (NCC, 2020; PeeringDB, 2020) for the different vantage points. These classifications have the largest possible overlap, but may differ between vantage points for one or more of the following reasons.
Local differences. We are investigating vantage points from a total of three countries on two continents. There exist local content providers and ISPs in each country that play a dominant role in their respective home market (e.g., digital offers of local broadcasting networks, national ISPs). Likewise, for IXPs, not every network is present at every IXP, which makes defining a common classification across different IXPs difficult.
Different types of Networks. We investigate different types of networks attracting different traffic mixes. For instance, cloud gaming does not play a major role in academic networks (see Section 7), and Video on Demand is usually not consumed via mobile providers. Consequently, different traffic classes are relevant for different networks leading to a different classification.
Ease of Classification. Not all traffic classes can be classified easily and they are not mutually exclusive. An example is the VPN classification in section 6 requiring the additional use of DNS information. Moreover, the number and size of the datasets used in this work is exceptional, so certain classifications cannot be performed on all data in reasonable time.
Notably, the goal of the classifications defined in this work is not to catch all traffic for a certain traffic class, but rather a representative subset of traffic allowing to reason about trends during the pandemic. In the following we disclose as many details of the classifications used in this work as possible. However, due to the sensitive nature of flow data, some of the information is covered by non-disclosure agreements and can therefore not be published.
A.1. Hypergiants Classification
A classification of hypergiant ASes is provided by Böttger et al. (Böttger et al., 2018). As this classification is established in the scientific community, we leverage it in this work. For more details on this classification and how the 15 ASes are selected, see (Böttger et al., 2018). Table 2 reports the full list of ASes considered for this category. Nevertheless, the classification is limited to a few very large networks and cannot provide insights beyond these hypergiants.
| Org. Name | ASN |
|---|---|
| Apple Inc | 714 |
| Amazon.com | 16509 |
| 32934 | |
| Google Inc. | 15169 |
| Akamai Technologies | 20940 |
| Yahoo! | 10310 |
| Netflix | 2906 |
| Hurricane Electric | 6939 |
| OVH | 16276 |
| Limelight Networks Global | 22822 |
| Microsoft | 8075 |
| Twitter, Inc. | 13414 |
| Twitch | 46489 |
| Cloudflare | 13335 |
| Verizon Digital Media Services | 15133 |
A.2. Application Classification Academic Network
For the academic network, we focus on applications we expect to be used by academic staff and students, e.g., VPN, SSH, remote desktop applications and entertainment (e.g., Spotify), see Table 3.
| Application class | Filter |
|---|---|
| Web | TCP:80, TCP:443, UDP:443 (QUIC), TCP:8000, TCP:8080 |
| QUIC | UDP:443 |
| Push notifications | TCP:5223, TCP:5228 |
| TCP:25, TCP:110, TCP:143, TCP:465, TCP:587, TCP:993, TCP:995 | |
| VPN | UDP:500, ESP, GRE, TCP:1194, UDP:1194, UDP:4500 (Fortigate) |
| SSH | TCP:22 |
| Remote Desktop | TCP:1494 and UDP:1494 (Citrix remote desktop), TCP:3389 (Windows remote desktop), TCP:5938, UDP:5938 (Team Viewer) |
| Spotify | TCP:4070 or ASN8403 |
| Application class |
# of filters |
|
|
Notes | ||||
|---|---|---|---|---|---|---|---|---|
| Web conferencing and telephony (Web conf) | 7 | 1 | 6 | Conferencing audio/video ports, AS-based for pure conferencing provider (TCP:444, UDP:3478-3481, UDP:8200, UDP:5005, UDP:1089, UDP:10000) | ||||
| Video on Demand (VoD) | 5 | 5 | - | Large to medium VoD provider ASes | ||||
| Gaming | 8 | 5 | 57 | Transport ports of popular games , AS-based for large gaming providers (e.g. TCP:1716, TCP:4001, TCP:3074, …), includes cloud gaming services | ||||
| Social media | 4 | 4 | 1 | Social networks including their respective CDNs (HTTPs+respective AS) | ||||
| 1 | - | 10 | Typical mail transport ports (TCP:25, TCP:587, TCP:109, TCP:110, TCP:143, TCP:220, TCP:645, TCP:585, TCP:993, TCP:995) | |||||
| Educational | 9 | 9 | - | ASes of universities close to respective vantage points | ||||
| Collaborative working | 8 | 2 | 9 | Collaborative editing, file sharing, versioning, VPN, remote administration (e.g. TCP:1194, UDP:1194, UDP:1197, UDP:1198, …) | ||||
| Content Delivery Network (CDN) | 8 | 8 | - | Dominant CDN providers (excluding social network CDNs) by AS |
A.3. Application Classification ISP/IXPs
As ISP and IXP networks have a comparable traffic mix, we compiled a joint classification for the ISP/IXP vantage points allowing for a high comparability. The classification is based on combinations of ASes (at IXPs by port, at ISP by IP ranges) and transport protocol ports if characteristic protocols exist. While the transport protocols are disclosed in Table 4, the measured ASes cannot be disclosed due to non-disclosure agreements.
Appendix B Additional Plots for Link Utilization
The hereby presented plots serve as an addition to statements made in Section 3.3. Figures 14 and 15 show the relative link utilization at IXP-CE for weeks in April and June, respectively. We also plot the link utilization from the reference week in February for comparison. These plots show, in contrast to Figure 5, an increased overall link utilization at IXP-CE.
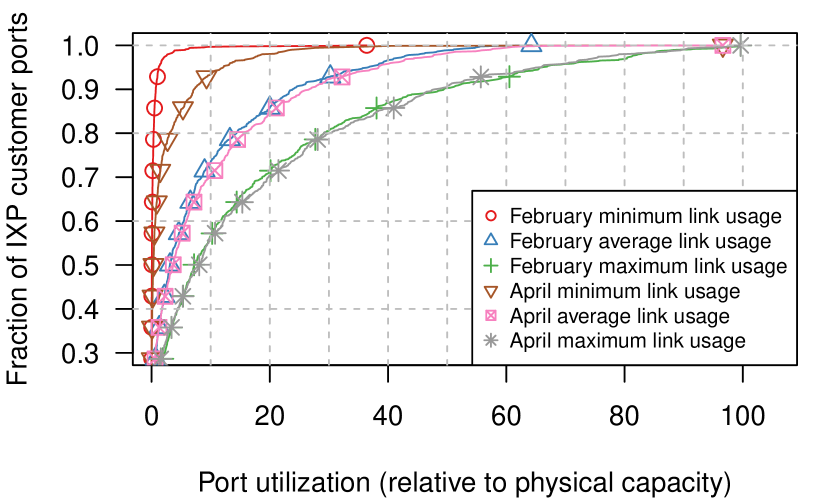
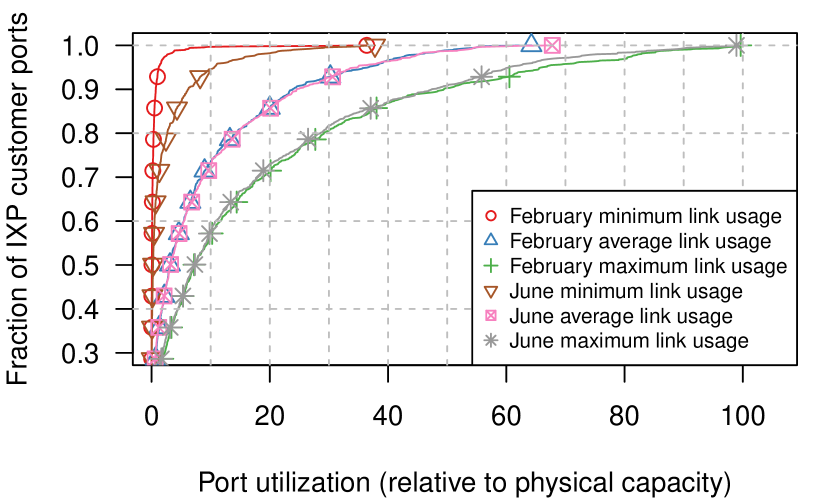
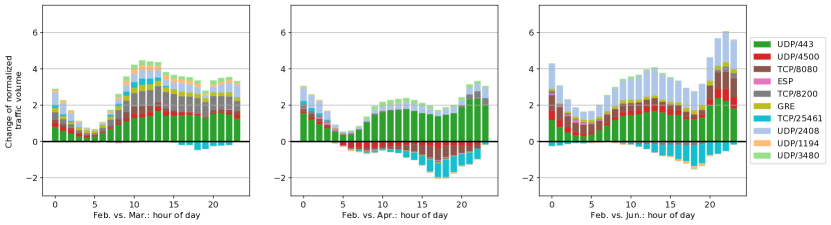
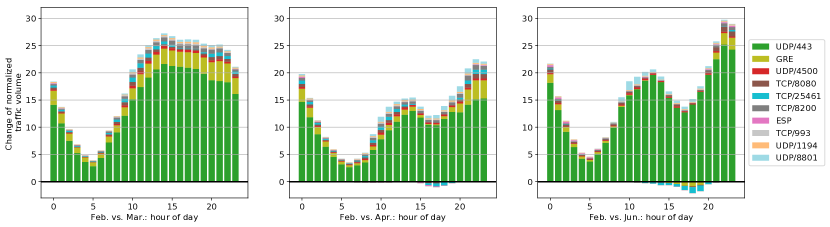
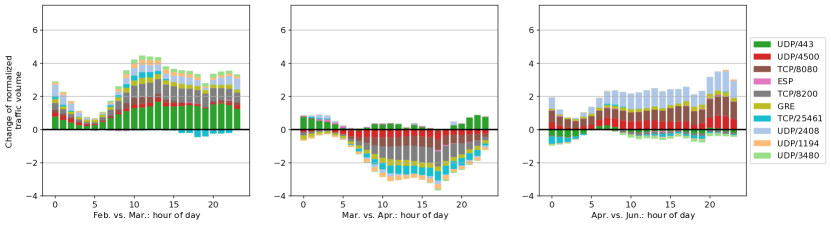
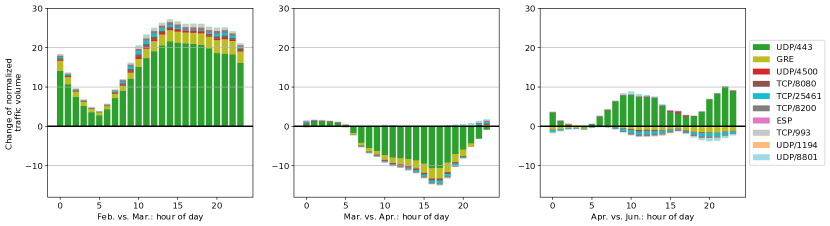
Appendix C Additional Plots for Applications by Port Classification
In the following we present additional plots for the applications by port classification.
Figures 16 and 17 show the differences by top application ports compared directly with the base week of February, for the IXP-CE and ISP-CE respectively. This is different from Figures 7 and 8 shown in Section 4 which show the difference for weeks of two consecutive month, i.e., emphasizing on the differences between the selected weeks. On the other hand, Figures 16 and 17 emphasize the result of the lockdown and its lifting compared to the regular February 2020 week, i.e., what changes do we observe in each month compared to the base week.