Phase behaviour of (Ti:Mo)S2 binary alloys arising from electron-lattice coupling
Abstract
While 2D materials attract considerable interests for their exotic electronic and mechanical properties, their phase behaviour is still largely not understood. This work focuses on (Mo:Ti)S2 binary alloys which have captured the interest of the tribology community for their good performance in solid lubrication applications and whose chemistry and crystallography is still debated. Using electronic structures calculations and statistical mechanics we predict a phase-separating behaviour for the system and trace its origin to the energetics of the -band manifold due to crystal field splitting. Our predicted solubility limits as a function of temperature are in accordance with experimental data and demonstrate the utility of this protocol in understanding and designing TMD alloys.
keywords:
TMD , 2D Materials , Alloy , Phase Stability , Phase Diagram , Cluster Expansion , DFT1 Introduction
The unique structural and electronic properties of 2D materials attract considerable interest. Applications range from nanostructured electronics such as FET channels (1, 2) to Li- and Na-ions batteries (3, 4) and solid lubrication (5, 6, 7). While theoretical and experimental studies tend to focus on the electronic and mechanical properties, the phase behaviour of low dimensional materials, equally important to inform synthesis strategies and understand service life, remains an open question (8).
This work focuses on the phase behaviour of a compound that has captured the interest of the tribology community: (Mo:Ti)S2 alloys have been identified as a promising material with enhanced tribological properties both by experiments and computational investigations. Mesoscale experiments report that Ti-doped composite coatings show better resistance to oxidation compared to pristine MoS2, while preserving low friction coefficients (9). Recent computational work (10, 11) has put forward an argument to rationalise the good frictional behaviour in terms of the vibrational properties: the low-frequency optical phonon modes taken to be associated with the perfect shear of two layers are extrapolated along the sliding path and taken as an indication of low energy barriers for sliding modes. By studying this descriptor across the transition-metal dichalcogenide (TMD) chemical space, the authors identified layered 2H-Ti1/4Mo3/4S2, where a quarter of TM sites within the TM-S2 layers is occupied by Ti, as a candidate material with enhanced frictional properties compared with other analysed TMDs. Albeit the interest attracted by this compound, the exact structure and chemistry are still debated. To experimentally realise this computationally engineered chemistry, it would be advantageous for Ti1/4Mo3/4S2 to be thermodynamically stable within the Ti-Mo-S chemical space. However, the reported mechanically stability in Density Functional Theory (DFT) calculations is by itself insufficient to assess the thermodynamic viability. Experiments do not provide a definite answer either. On the one hand, studies on thin films synthesised via magneto-sputtering suggest Ti is not fully integrated within the TM-S2 planes (9, 12). On the grounds of the measured ratio between chemical composition and film hardness, the authors conclude that if Ti were fully incorporated in the layered structure, the resulting properties of the material, including hardness, should deviate more from pristine MoS2 than is observed. On the other hand, a separate study of Ti-doped MoS2 nanostructures concluded that Ti is incorporated within the TM-S2 planes (13). The authors disregarded possible intercalation between the layers due to the absence of distortion along the interlayer axis, suggesting Ti is embedded in the planes.
In an attempt to elucidate the thermodynamic viability of layered (Mo:Ti)S2 compounds including 2H-Ti1/4Mo3/4S2, we computationally investigate the energetics and thermodynamics of site substitutions to identify ordered phases and solubility limits along the full (Mo:Ti)S2 pseudo-binary line within the Mo-Ti-S phase space.
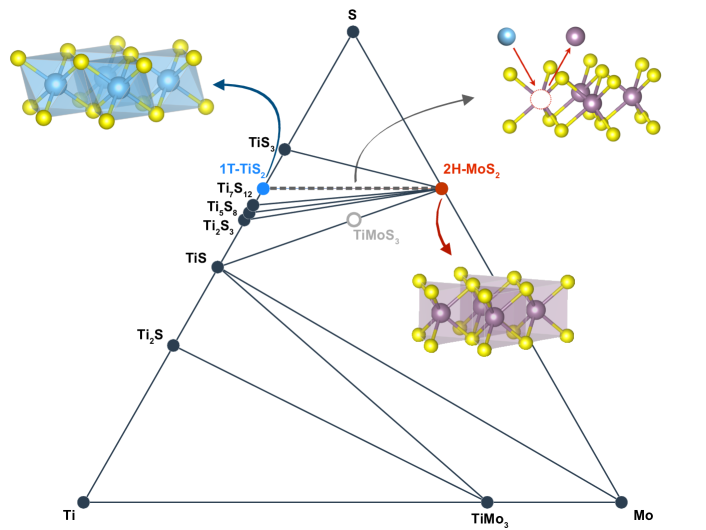
Figure 1 visualises the considered part of the ternary phase space. We consider only compounds TixMo1-xS2 within the two host structures suggested by the binary sulfides. The ternary plot in Figure 1 reports stable configurations and tie lines in the chemical space according to the Materials Project Database (14, 15). The only ternary compound reported is TiMoS3, an unstable non-layered structure with formation energy above the convex hull. To the best of our knowledge, there are no stable ternaries reported in the phase field MoS2-TiS2-Ti7S relevant here, and no attempt was made to computationally search for unknown ternaries in this region of the chemical space.
The two end-members are:
-
1.
1T-TiS2 is a semi-metal that crystallises in a layered compound with space group . The structure is depicted on the left side in Figure 1. Triangular Ti layers are sandwiched by triangular chalcogenide planes, mutually rotated by , resulting in octahedrally coordinated Ti. The 1T prefix indicates that TiS2 planes are stacked in an AA fashion (16).
-
2.
2H-MoS2 is a semiconductor with an indirect bandgap of and crystallises in a layered structure with space group . Mo planes are sandwiched by S planes that are not rotated relative to each other, resulting in prismatic coordination of Mo, as sketched on the right side in Figure 1. The 2H prefix designates an AB stacking order of MoS2 layers (16).
To explore the effects of system dimensionality on the phase stability, the systems are also studied in purely monolayer (ML) form. No staking order is present in the ML case and the pristine compounds are referred to as 1T-TiS2 and 1H-MoS2.
2 Methods
2.1 Cluster Expansion method
The combinatorial problem of cation ordering within a crystal structure is addressed using the Cluster Expansion (CE) formalism (17). The CE approach, effectively, coarse grains all degrees of freedom of the system until only the site occupancy on a lattice remains. The energy of a configuration of the lattice is expanded in terms of clusters functions representing different interaction patterns
| (1) |
where the sum runs over the distinct orbits . An orbit is a set of symmetry-equivalent clusters . The cluster functions are averages over all clusters within an orbit . The strength of each interaction is given by the constants , termed Effective Cluster Interaction (ECI). Even though Eq. 1 is exact in the limit of an infinite number of orbits , the series must be truncated for any practical application. In most system, the shortsighted nature of interactions allows a satisfactory description of the behaviour retaining only a few clusters (18, 19). The utility of a CE is twofold. Once a CE-model has been built, this provides a fast-evaluating Hamiltonian describing the configurational space of the system that allows to efficiently search for new ground-state orderings. Iterating this search and refining the CE model until the underlying interaction is described correctly, one has obtained an Ising-like lattice Hamiltonian that enables the evaluation of thermodynamic properties via Monte Carlo simulations.
The Alloy Theory Automated Toolkit (ATAT) (20) has been used to construct cluster expansions. The series Eq. 1 is truncated at figures of four vertices and cross-validation is used to select the most predictive model over a training set. The expansion is considered converged once the ground states predicted by the CE agree with DFT calculations and the error on predicted energies is deemed negligible.
2.2 First-principles calculations
Total energy calculations of geometries along the TixMo1-xS2 tie-line are performed using DFT within the Projector Augmented-Wave (PAW) framework (21) as implemented in the Vienna Ab initio Simulation Package (VASP) (22, 23). Exchange-correlation effects are modelled using the Strongly Constrained Appropriately Normed (SCAN) functional (24). The subtle van der Waals interactions coupling the layers in bulk systems are described using the non-local kernel correction rVV10 (25). This combination has proven to accurately describe layered materials and complex geometries (26).
A plane wave cut-off of was adopted for all DFT calculations; the Brillouin zone of the pristine compounds in their primitive cell was sampled using an mesh and the number of points per reciprocal atom was kept constant for larger supercells. For the ML geometries, layers of TMD are separated by , ensuring there is no interaction between periodic images. In order to obtain accurate total energies, cell vectors and atomic positions were relaxed with a convergence cut-off of .
2.3 Monte Carlo simulations
To investigate the effect of temperature and configurational entropy on the system, Monte Carlo simulations were performed using the CE Hamiltonians and the EMC routine of the ATAT package (27). The simulations are carried out in the semi grand-canonical ensemble, where the chemical potential , number of lattice sites and temperature are fixed while concentration and energy can fluctuate.
The supercells used in the calculation are reported in Table 1. All ground states of the system are stabilized within the chosen chemical-potential range, spanned in steps of . Temperature is varied as function of its inverse between and in steps . This ensures a high sampling density at low temperatures while conveniently enabling the ideal solid solution case as a high-temperature staring point. Each MC simulation is considered converged once concentration fluctuations are less than the threshold of .
| Host | Training set size | Clusters | CV [eV] | MC cell size |
|---|---|---|---|---|
| 2H bulk | 57 | 19 | 0.009 | 37x37x8 |
| 1T bulk | 113 | 31 | 0.052 | 21x21x11 |
| 1H ML | 39 | 8 | 0.016 | - |
| 1T ML | 46 | 37 | 0.083 | - |
3 Results
3.1 Crystallography and Cluster Expansion
The lattice parameters of the pristine compounds 2H-MoS2 and 1T-TiS2 as obtained from calculations are reported in Table 2 and compared with experimental crystallographic data. The DFT-SCAN with rVV10 correction describes the in-plane bonding accurately and stacking lattice constants are in good agreement with experiment, which indicates that the rVV10 kernel accurately captures the cohesive inter-layer interactions.
| Compound | Method | Reference | ||
|---|---|---|---|---|
| 2H-MoS2 | 3.168 | 12.5 | DFT-SCAN | This work |
| 3.161 | 12.3 | experimental | (28) | |
| 1T-TiS2 | 3.409 | 5.75 | DFT-SCAN | This work |
| 3.410 | 5.70 | experimental | (29) |
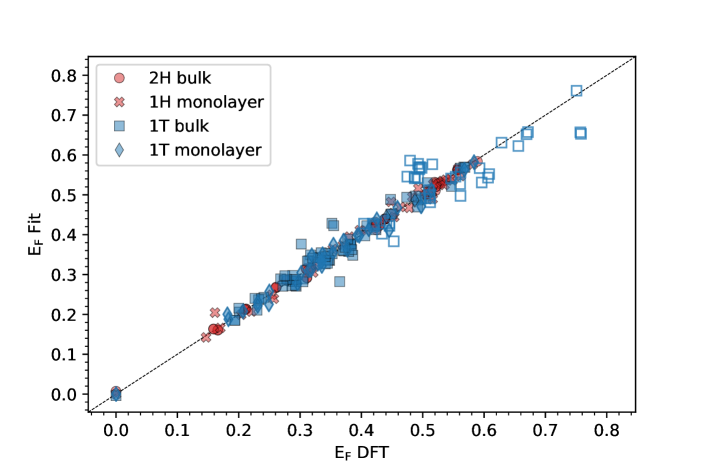
Separate CE Hamiltonians were built for the trigonal-prismatic (H) and the octahedral (T) hosts. Two datasets of total energy calculations, one per host, were used to train the ECIs, which are reported in greater detail in A. A dataset comprising around 50 structures was sufficient to bring CE and DFT into agreement for the trigonal-prismatic host, while a little over a hundred configurations were needed for the octahedral host as reported in Table 1. The CE for the trigonal-prismatic host was build using the full concentration range , while the CE model for the octahedral host was biased to accurately reproduce the ground-states only in as explained in Section 3.2. As reported in Figure 2, energies predicted by CE models agree with the DFT-computed ones: the average error is for the 2H host and for 1T host. Considering that the energy landscape is spanned by the formation energy of end-members in the non-native host, which is of the order of 0.5 eV, this error is negligible in the description of the energetics defining most phase diagrams. The error in the 1T host is comparable to the thermal energy at room temperature , making it relevant for low-temperature simulations at low concentration , near the 1T-TiS2 end-member. However, in the high-temperature portion of the phase diagram, which is the one of interest here, this error becomes negligible.
3.2 Convex Hull
In order to understand stability across different hosts, the formation energy of a configuration is defined as follows
| (2) |
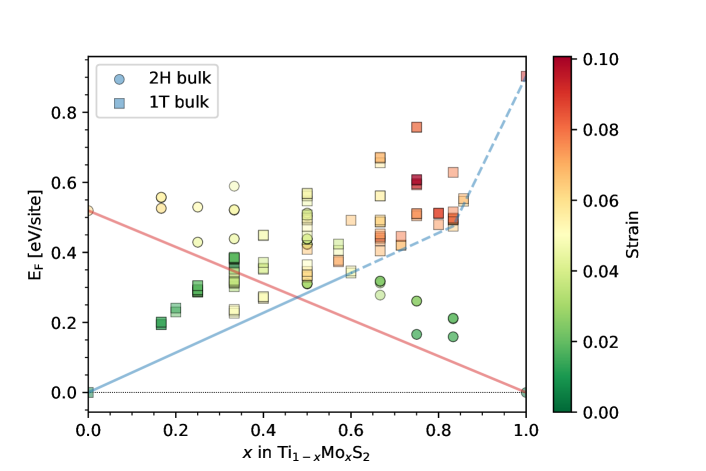
where is the energy per TM site of the configuration at concentration , and remaining terms are the total energy of the pristine compound in the ground-state hosts. Formation energies from Section 3.2 are reported in Figure 3 for bulk and ML (ML) in both octahedral 1T and trigonal prismatic 1H and 2H hosts. The line connecting the end-member in each host (solid red for H host and dashed grey for T host in Figure 3) represents the energy of ideal solid-solution with negligible interactions between the fraction of sites occupied by Mo and the remaining Ti sites. Points lying below this line represent stable configurations in the given host while points over it mark energetically unfavourable regions, where Mo-rich and Ti-rich parts are segregated within the same host geometry. Finally, stable structures across both hosts would show negative formation energies, lying below the black dotted line in Figure 3, but no such configuration has been found.
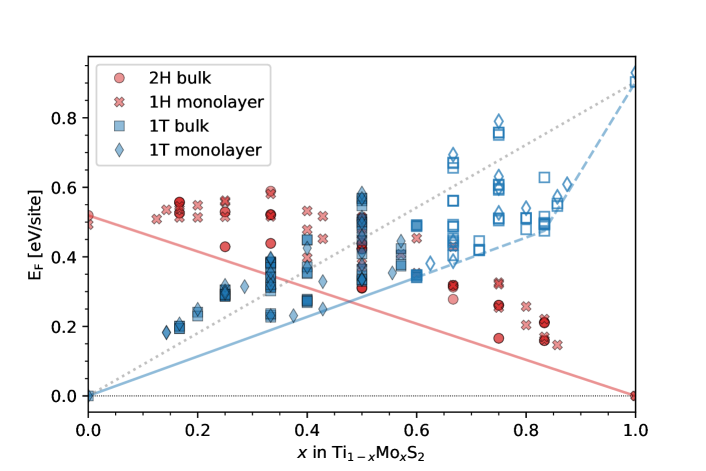
The prismatic host is not receptive to alloying. All training set configurations lie above the line connecting the end-members (red symbols in Figure 3), indicating a high energy penalty for Ti in prismatic coordination. Since no ordered arrangement of the two species yields an energy gain, Mo and Ti ions within the 2H host segregate at . Conversely, energy favourable orderings are found within the octahedral host. Several training set configurations lie below the ideal solid-solution line, as shown by blue marks below the grey dotted line in Figure 3. In particular the CE iterative search identifies ground-state orderings at (Mo3/5Ti2/5S2) and at (Mo5/6Ti1/6S2). According to the convex hull in Figure 3, the octahedral T host is favourable until , after which the prismatic H host becomes more stable. This concentration-depend stability between the two hosts at and the large distortions occurring in the T host for , as reported in B, motivated the decision to constrain the training set of the 1T model: CE Hamiltonians are required to reproduce correctly the 1T ground-state only within the range . This is because at higher concentrations the system will prefer the H host and the CE has difficulties to capture the energetics of large lattice distortions (20).
Since no part of either convex hull lies below the zero-formation energy line of the composite-host system (black dotted line in Figure 3), the system is deemed phase-separating at : the lowest-energy configuration at any concentration comprises two separate regions of 1T-TiS2 and 2H-MoS2. Only at finite temperature, entropic effects could stabilise the presence of mixed-concentration configurations within a single host.
3.3 Miscibility at higher T
The CE Hamiltonians for the 2H and 1T bulk system trained with the data-points in Figure 3 was used to run finite-temperature MC simulations to build free-energy curves for each host that govern the stability of the system once temperature and configurational entropy are introduced. Since the MC simulations are carried out in a semi grand-canonical ensemble, only single-phase regions of the phase diagram are directly explored by the simulations and two-phase equilibrium regions are inferred. Then the multi-host free-energy surface is obtained by a double tangent construction: at a fixed temperature, the free energy surface of each host is built with the two-tangent construction and the convex hull of the resulting two surfaces yields the total free energy .
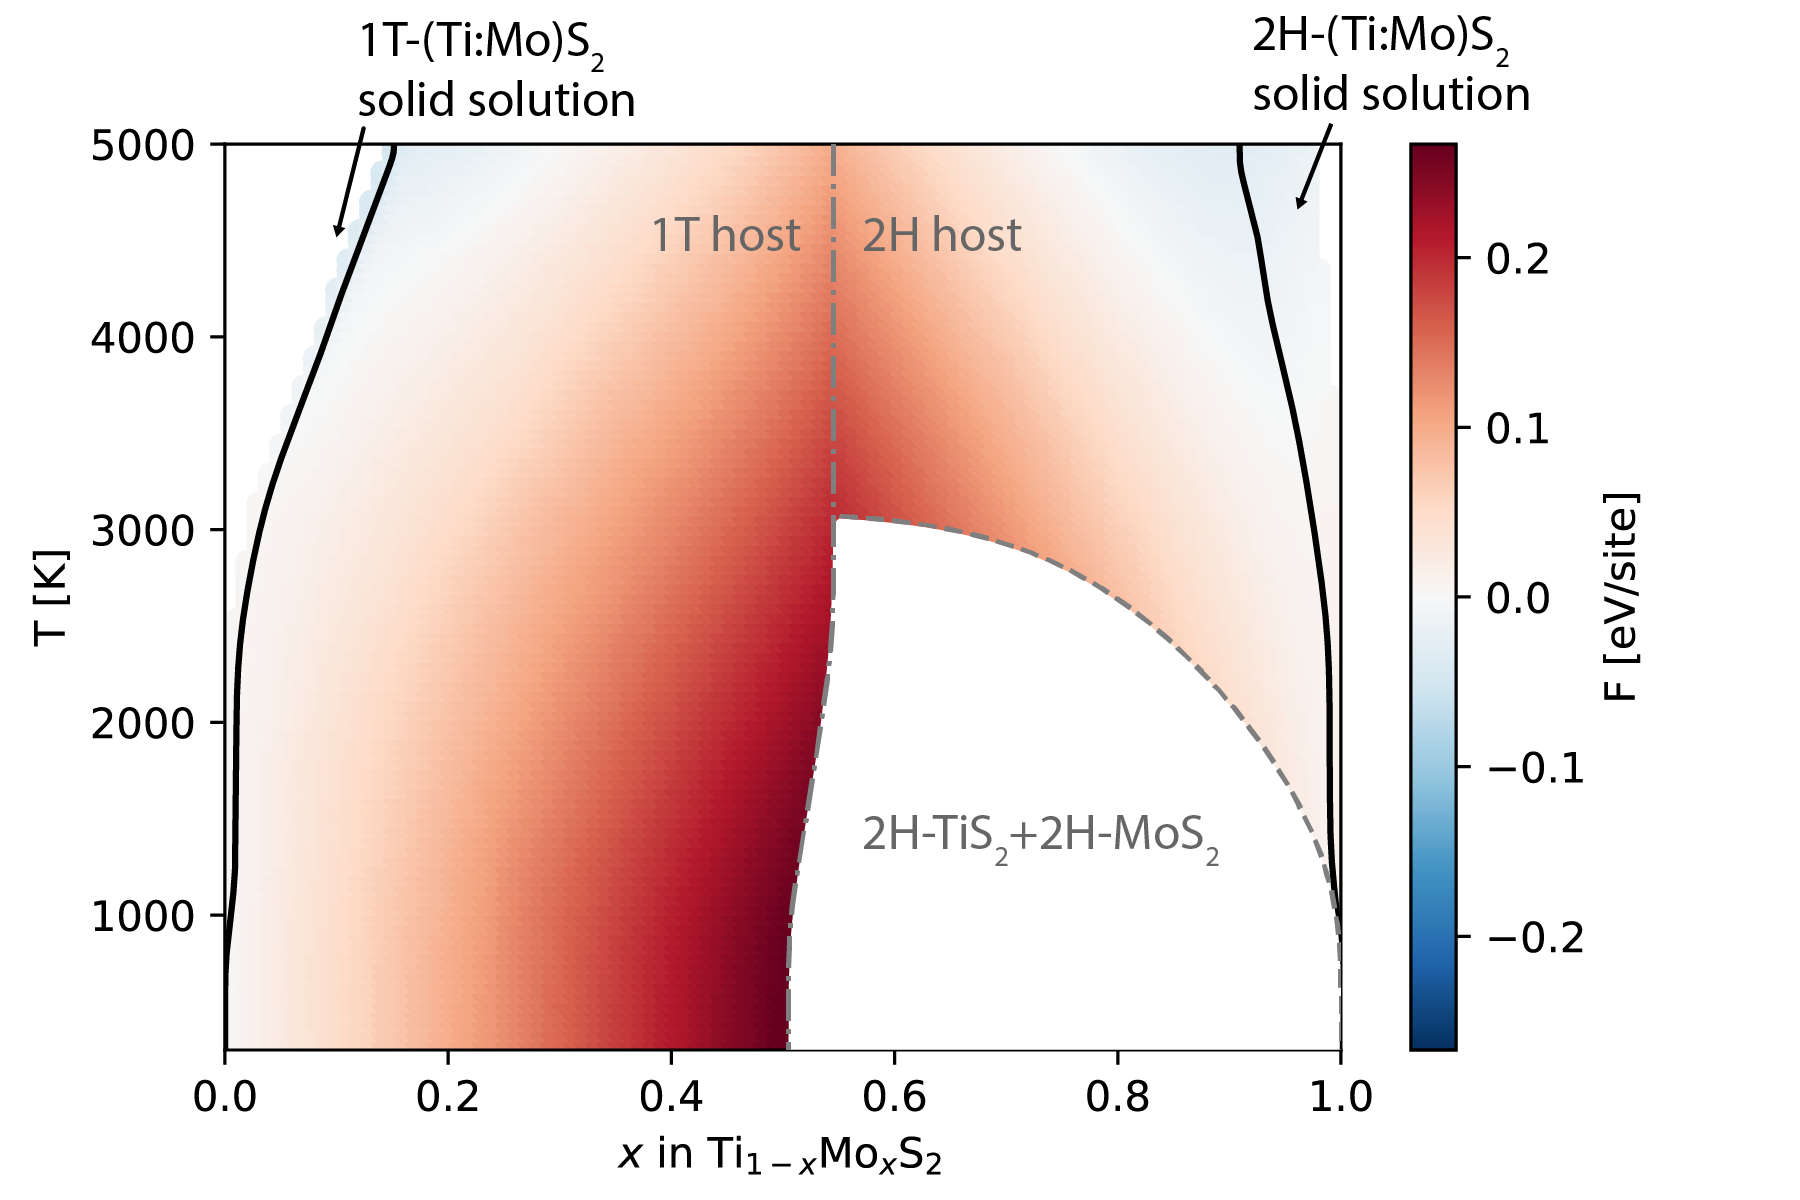
The phase diagram of the system across 2H and 1T hosts is thus divided in phase separating and solid-solution regions. The color scheme in Figure 4 shows the value of the multi-host Helmholtz free-energy as function of concentration and temperature . Considering the thermodynamic behaviour of each host independently (i.e., excluding phase separation into different hosts), the T host shows solid-solution behaviour already at room temperature, while phase-separation of Ti and Mo is observed within the prismatic 2H host up to at . Similar to the zero temperature data shown in Figure 3, the lower energy host changes from 1T for lower concentrations of Ti to 2H at about with a slight shift to higher at elevated temperatures.
Finally, the solid black line in Figure 4 indicates the phase boundaries between two-phase separation into 1T and 2H hosts (central region) and solid solution in a single host (left-most and right-most regions) and shows that in a realistic temperature range the system is completely phase separating, with configurational entropy stabilizing only small-percentage doping around the two end-members.
4 Discussion
4.1 Stabilisation mechanism in octahedral host
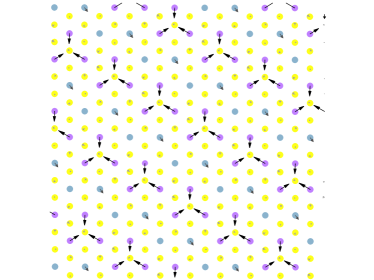
Even though it does not lead to overall-stable geometries, it is interesting to understand the origin of the stabilization mechanism leading to the ordered configuration Mo3/5Ti2/5S2 at in the 1T host. The ordering is sketched in Figure 5a. The configuration consists of a striped arrangement composed of three staggered rows of Mo and two rows of Ti. As shown by the displacement arrows in Figure 5a Ti cations retain their position, locally preserving octahedral coordination, while Mo clusters distort the host, locally breaking the symmetry. This distortion around Mo ions can be understood qualitatively with Crystal Field (CF) theory and Kramer’s theorem (30). The CF description has an intuitive physical interpretation but only leads to a qualitative description of the present system, because the transition metal-chalcogenide bond shows a degree of covalency while the CF model assumes purely ionic bonding.
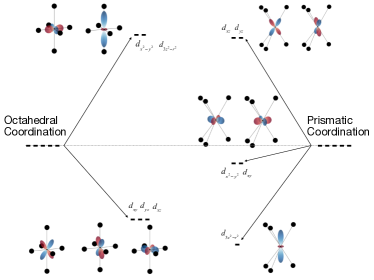
The CF resulting from octahedral coordination splits the five degenerate orbitals of the isolated TM into two energy manifolds, as depicted on the left-hand side of Figure 5b. The lower energy manifold consists of three orbitals, while the higher energy manifold comprises two orbitals. Prismatic coordination, on the other hand, leads to three manifolds with only the orbital contributing to the lowest energy manifold.
Assigning Ti a formal valence of 4+, neither crystal field will result in an energetic advantage for the ion, because the triply degenerate states of the octahedral environment and the states of the prismatic environment are both empty. Hence, octahedral coordination is favoured as it provides the most efficient packing (31). On the other hand, Mo4+ is a ion leading to the partial occupation of the manifolds. According to Kramer’s theorem, the system will, therefore, tend to lower its symmetry through Jahn-Teller (JT) distortions to break the degeneracy of and lowers the total energy. The lattice is thus divided into non-JT-active sites, i.e. Ti rows, and JT-active sites, composed of the Mo triplets clustering together. The same mechanism cannot occur in the MoS2 native prismatic coordination, as the low-energy CF level is non-degenerate for the configuration of Ti4+ as well as the configuration of Mo4+ ions and, thus, Kramer’s theorem does not apply.
The slightly higher solubility of Mo in TiS2 compared to Ti in MoS2 seen in Figure 4 is, therefore, attributed to the additional stability obtained from JT activity of Mo4+ within the octahedral environment of the 1H host.
4.2 Generalised principle for 2D TMDs design
The dimensionality and vdW interactions do not affect the phase stability of the alloy system. As Figure 3 reports, in both hosts, the convex hull of the bulk system and their ML counterpart present the same character. This finding has important implications for future studies: since the phase behaviour is unchanged from the bulk case, one could extrapolate from ML phase diagrams to the bulk. Extrapolating from monolayer formation energies to bulk without information on interlayer interactions yields errors in the prediction of the order of stacking faults energies. Stacking fault energies are typically around for TMDs (32, 33) and other 2D sheets bounded by vdW dispersion (34, 35) and for transition metal oxides (36). This argument can be extended to most TMD families and layered materials in general, provided that vdW forces are the only inter-layer interactions, i.e. no Coulomb or magnetic interaction are present (37, 38).
Moreover, the electron-lattice stabilisation mechanism presented in Section 4.1 could occur in other TMD-based compounds and must be taken into account when designing similar alloys. The JT-based distortion lowers the energy of the ground-state configurations at in Figure 3 by about compared to the ideal-solid solution limit. Even though this energy gain is not enough to redefine the multi-host convex hull in the (Mo:Ti)S2 system, it could lead to ground-state orderings in other similar alloys, if the formation energy of the end-members in both hosts is low enough or zero, when end-members share the same ground-state host (39).
4.3 Comparison with experimental data
The phase diagram in Figure 4 contains useful information from a synthesis point of view, allowing estimation of the maximum doping fraction at a given temperature. For example, at the maximum fraction of substituted Ti should be around . Considering that the melting point of pristine MoS2 and Mo-Ti metallic alloys are reported to be around and (40), respectively, it should be in principles possible to observe such doped configurations experimentally by high-temperature synthesis routes and subsequent quenching to inhibit the phase segregation at a lower temperature. This prediction is consistent with the results of Hsu et al. (13), where energy dispersive X-ray analysis detected the presence of a small amount of Ti in 2H-MoS2-based nanostructures obtained by mixing Mo-Ti powder and H2S at , while the inter-layer lattice constant measured from the High-Resolution Transmission Electron Microscopy and X-ray diffraction fail to show an expansion, which would be indicative of Ti ions intercalated between MoS2 sheets.
5 Conclusion
We presented the (Ti:Mo)S2 phase diagram that results from considering TM substitutions within the native hosts of the pristine compounds. Our model based on electronic-structure calculations and statistical mechanics predicts full phase separation in the system across hosts and the solubility limits inferred from our MC simulations are in agreement with the high-temperature synthesis of Ti-doped 2H-MoS2 reported by Hsu and coworkers (13).
The phase behaviour of the system is understood in terms of a general electron-lattice coupling mechanism that we argue could apply to other members of the TMD family and, if strong enough, lead to stable orderings and/or miscibility in other binary compounds. Comparison between 3D bulk and 2D convex hulls reveals interlayer coupling and system dimensionality, at the origin of sought-after exotic electronic behaviour, are negligible regarding phase stability of the binary alloys. We argue that this finding should be valid for most 2D materials in which phase stability is governed by the similar in-plane electron-lattice effect, while more subtle behaviour could arise in presence of magnetic or Coulombic interactions (37, 38). The possibility to limit phase diagrams to pure ML systems allows to work in a reduced combinatorial space and achieve a considerable speed-up of the protocol for future studies.
Appendix A ECI value
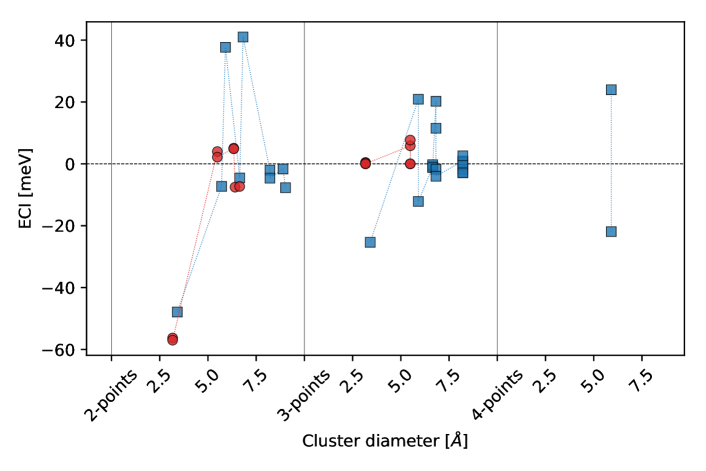
Figure 6 shows the ECIs of the CE models used in this work. ECI energies are plotted as a function of cluster diameter in groups of pairs, triplets, and quadruplets. In both cases, the shortest range next-neighbour pair interaction has a negative ECI, favouring the same species neighbouring pairs. This interaction seems to be the leading term in the trigonal-prismatic host, as longer-range terms are significantly smaller in magnitude. Conversely, in the octahedral host, longer-range pair interactions and higher-order clusters contribute similarly to the energy expansion Equation 1 in the main text.
Appendix B Distortion of Host Lattice
Figure 7 reports the distortion from the native geometry occurring upon relaxation as a function of concentration . The host distortion is defined as the strain needed to transform the original cell into the relaxed one, apart from isotropic scaling and rotations. Quantitatively, the distortion is evaluated as the sum of the squared elements of the strain tensor (20):
Distortions are usually considered too large for the CE formalism to be applied (20), as the mapping of the relaxed configuration to the perfect lattice breaks down.
Acknowledgements
This project has received funding from the European Union Horizon2020 research and innovation programme under grant agreement No. 721642: SOLUTION. The authors acknowledge the use of the IRIDIS High Performance Computing Facility, and associated support services at the University of Southampton, in the completion of this work. The authors are grateful to the UK Materials and Molecular Modelling Hub for computational resources, which is partially funded by EPSRC (EP/P020194/1). TP acknowledges the support from the project OPVVV Novel nanostructures for engineering applications No. CZ.02.1.01/0.0/0.0/16_026/0008396 supported by EU/MSMT.
Author Contributions
AS carried out all calculations and data analysis. AS and DK conceptualize the study in the first place. TP and DK supervised the study. All authors contributed to the writing of the manuscript.
Competing interests
The authors declare no competing interests.
References
-
(1)
Q. H. Wang, K. Kalantar-Zadeh, A. Kis, J. N. Coleman, M. S. Strano,
Electronics
and optoelectronics of two-dimensional transition metal dichalcogenides,
Nature Nanotechnology 7 (11) (2012) 699–712.
doi:10.1038/nnano.2012.193.
URL http://www.nature.com/doifinder/10.1038/nnano.2012.193 -
(2)
M. Chhowalla, H. S. Shin, G. Eda, L.-J. Li, K. P. Loh, H. Zhang,
The chemistry of
two-dimensional layered transition metal dichalcogenide nanosheets, Nature
Chemistry 5 (4) (2013) 263–275.
doi:10.1038/nchem.1589.
URL http://www.nature.com/doifinder/10.1038/nchem.1589 -
(3)
L. Ma, X. Zhou, L. Xu, X. Xu, L. Zhang, W. Chen,
Ultrathin
few-layered molybdenum selenide/graphene hybrid with superior electrochemical
Li-storage performance, Journal of Power Sources 285 (2015) 274–280.
doi:10.1016/j.jpowsour.2015.03.120.
URL http://dx.doi.org/10.1016/j.jpowsour.2015.03.120https://linkinghub.elsevier.com/retrieve/pii/S0378775315005443 - (4) D. T. Larson, I. Fampiou, G. Kim, E. Kaxiras, Lithium Intercalation in Graphene-MoS 2 Heterostructures, Journal of Physical Chemistry C 122 (43) (2018) 24535–24541. doi:10.1021/acs.jpcc.8b07548.
- (5) E. W. Roberts, Thin solid lubricant films in space, Tribology International 23 (2) (1990) 95–104. doi:10.1016/0301-679X(90)90042-N.
-
(6)
T. Polcar, A. Cavaleiro,
Review on
self-lubricant transition metal dichalcogenide nanocomposite coatings alloyed
with carbon, Surface and Coatings Technology 206 (4) (2011) 686–695.
doi:10.1016/j.surfcoat.2011.03.004.
URL http://dx.doi.org/10.1016/j.surfcoat.2011.03.004 -
(7)
M. R. Vazirisereshk, A. Martini, D. A. Strubbe, M. Z. Baykara,
Solid Lubrication with MoS2: A
Review, Lubricants 7 (7) (2019) 57.
doi:10.3390/lubricants7070057.
URL https://www.mdpi.com/2075-4442/7/7/57 -
(8)
A. Ektarawong, Y. P. Feng, B. Alling,
Phase
stability of two-dimensional monolayer solid solutions revealed by a
first-principles, Physical Review Materials 3 (5) (2019) 054005.
doi:10.1103/PhysRevMaterials.3.054005.
URL https://link.aps.org/doi/10.1103/PhysRevMaterials.3.054005 -
(9)
V. C. Fox, N. Renevier, D. G. Teer, J. Hampshire, V. Rigato,
The structure of
tribologically improved MoS2-metal composite coatings and their industrial
applications, Surface and Coatings Technology 116-119 (1999) 492–497.
doi:10.1016/S0257-8972(99)00193-0.
URL http://dx.doi.org/10.1016/S0257-8972(99)00193-0 -
(10)
A. Cammarata, T. Polcar,
Tailoring
Nanoscale Friction in MX 2 Transition Metal Dichalcogenides, Inorganic
Chemistry 54 (12) (2015) 5739–5744.
doi:10.1021/acs.inorgchem.5b00431.
URL http://pubs.acs.org/doi/abs/10.1021/acs.inorgchem.5b00431 -
(11)
A. Cammarata, T. Polcar,
Overcoming nanoscale
friction barriers in transition metal dichalcogenides, Physical Review B
96 (8) (2017) 085406.
doi:10.1103/PhysRevB.96.085406.
URL https://journals.aps.org/prb/supplemental/10.1103/PhysRevB.96.085406/mxbar_supp_info.pdfhttp://link.aps.org/doi/10.1103/PhysRevB.96.085406 -
(12)
N. Renevier, V. Fox, D. Teer, J. Hampshire,
Coating
characteristics and tribological properties of sputter-deposited MoS2/metal
composite coatings deposited by closed field unbalanced magnetron sputter ion
plating, Surface and Coatings Technology 127 (1) (2000) 24–37.
doi:10.1016/S0257-8972(00)00538-7.
URL https://www.sciencedirect.com/science/article/pii/S0257897200005387http://linkinghub.elsevier.com/retrieve/pii/S0257897200005387http://linkinghub.elsevier.com/retrieve/pii/S0257897200007970 - (13) W. K. Hsu, Y. Q. Zhu, N. Yao, S. Firth, R. J. H. Clark, H. W. Kroto, D. R. M. Walton, Titanium-doped molybdenum disulfide nanostructures, Advanced Funtional Materials 11 (1) (2001) 69–74. doi:10.1002/1616-3028(200102)11:1<69::AID-ADFM69>3.0.CO;2-D.
- (14) S. P. Ong, L. Wang, B. Kang, G. Ceder, Li - Fe - P - O2 phase diagram from first principles calculations, Chemistry of Materials 20 (5) (2008) 1798–1807. doi:10.1021/cm702327g.
- (15) A. Jain, S. P. Ong, G. Hautier, W. Chen, W. D. Richards, S. Dacek, S. Cholia, D. Gunter, D. Skinner, G. Ceder, K. A. Persson, Commentary: The materials project: A materials genome approach to accelerating materials innovation, APL Materials 1 (1) (2013). doi:10.1063/1.4812323.
-
(16)
A. V. Kolobov, J. Tominaga,
Two-Dimensional
Transition-Metal Dichalcogenides, Vol. 239, 2016.
doi:10.1007/978-3-319-31450-1.
URL http://link.springer.com/10.1007/978-3-319-31450-1 -
(17)
J. W. D. Connolly, A. R. Williams,
Density-functional theory
applied to phase transformations in transition-metal alloys, Physical
Review B 27 (8) (1983) 5169–5172.
doi:10.1103/PhysRevB.27.5169.
URL https://journals.aps.org/prb/pdf/10.1103/PhysRevB.27.5169https://link.aps.org/doi/10.1103/PhysRevB.27.5169 - (18) C. M. Wolverton, Ground-State Properties and Phase Stability of Binary and Ternary Intermetallic Alloys, Ph.D. thesis, University of California at Berkeley (1993).
- (19) J. M. Sanchez, Foundations and Practical Implementations of the Cluster Expansion, Journal of Phase Equilibria and Diffusion 38 (3) (2017) 238–251. doi:10.1007/s11669-017-0521-3.
- (20) A. van de Walle, M. D. Asta, G. Ceder, The Alloy-Theoretic Automated Toolkit (ATAT): A User Guide, Calphad 26 (2002) 539–553.
- (21) P. E. Blöchl, Projector augmented-wave method, Physical Review B 50 (24) (1994) 17953–17979. doi:10.1103/PhysRevB.50.17953.
-
(22)
G. Kresse, J. Hafner,
Ab initio
molecular dynamics for open-shell transition metals, Physical Review B
48 (17) (1993) 13115–13118.
doi:10.1103/PhysRevB.48.13115.
URL https://journals.aps.org/prb/pdf/10.1103/PhysRevB.48.13115 -
(23)
G. Kresse, D. Joubert,
From ultrasoft
pseudopotentials to the projector augmented-wave method, Physical Review B
59 (3) (1999) 1758–1775.
doi:10.1103/PhysRevB.59.1758.
URL https://link.aps.org/doi/10.1103/PhysRevB.59.1758 -
(24)
J. Sun, A. Ruzsinszky, J. Perdew,
Strongly
Constrained and Appropriately Normed Semilocal Density Functional, Physical
Review Letters 115 (3) (2015) 036402.
doi:10.1103/PhysRevLett.115.036402.
URL https://journals.aps.org/prl/pdf/10.1103/PhysRevLett.115.036402https://link.aps.org/doi/10.1103/PhysRevLett.115.036402 - (25) O. A. Vydrov, T. Van Voorhis, Nonlocal van der Waals density functional: The simpler the better, Journal of Chemical Physics 133 (24) (2010) 1–9. doi:10.1063/1.3521275.
-
(26)
H. Peng, Z.-H. Yang, J. P. Perdew, J. Sun,
Versatile van der Waals
Density Functional Based on a Meta-Generalized Gradient Approximation,
Physical Review X 6 (4) (2016) 041005.
doi:10.1103/PhysRevX.6.041005.
URL https://journals.aps.org/prx/pdf/10.1103/PhysRevX.6.041005https://link.aps.org/doi/10.1103/PhysRevX.6.041005 -
(27)
A. van de Walle, M. Asta,
Self-driven
Lattice-model Monte Carlo Simulations of Alloy Thermodynamic Properties and
Phase Diagrams, Model. Simul. Mater. Sc. 10 (1002) (2002) 521–539.
URL http://iopscience.iop.org/article/10.1088/0965-0393/10/5/304/pdf -
(28)
R. G. Dickinson, L. Pauling,
The crystal structure
of molybdenite, Journal of the American Chemical Society 45 (6) (1923)
1466–1471.
doi:10.1021/ja01659a020.
URL http://pubs.acs.org/doi/abs/10.1021/ja01659a020 -
(29)
R. R. Chianelli, J. C. Scanlon, A. H. Thompson,
Structure
refinement of stoichiometric TiS2, Materials Research Bulletin 10 (12)
(1975) 1379–1382.
doi:10.1016/0025-5408(75)90100-2.
URL https://www.sciencedirect.com/science/article/pii/0025540875901002?via%3Dihubhttp://linkinghub.elsevier.com/retrieve/pii/0025540875901002 -
(30)
J. Huheey, E. Keiter, R. Keiter,
Inorganic
Chemistry: Principles of Structure and Reactivity, in: Inorganic Chemistry,
Pearson Education, 1993, p. 808.
URL https://books.google.co.uk/books?id=Ix1fTQ5gY5cC&dq=huheey+inorganic+chemistry&hl=en&sa=X&ved=0ahUKEwjylO66s_baAhWqJcAKHQJlAekQ6AEIKTAA -
(31)
M. Kertesz, R. Hoffmann,
Octahedral
vs. Trigonal-Prismatic Coordination and Clustering in Transition-Metal
Dichalcogenides, Journal of the American Chemical Society 106 (12) (1984)
3453–3460.
doi:10.1021/ja00324a012.
URL http://www.roaldhoffmann.com/sites/all/files/209s_0.pdf -
(32)
B. J. Irving, P. Nicolini, T. Polcar,
On the lubricity of transition
metal dichalcogenides: an ab initio study, Nanoscale 9 (17) (2017)
5597–5607.
doi:10.1039/C7NR00925A.
URL http://xlink.rsc.org/?DOI=C7NR00925A - (33) G. Levita, A. Cavaleiro, E. Molinari, T. Polcar, M. C. Righi, Sliding properties of MoS2 layers: Load and interlayer orientation effects, Journal of Physical Chemistry C 118 (25) (2014) 13809–13816. doi:10.1021/jp4098099.
- (34) G. Losi, P. Restuccia, M. C. Righi, Superlubricity in phosphorene identified by means of ab initio calculations, 2D Materials (2020). doi:10.1088/2053-1583/ab72d7.
-
(35)
M. Reguzzoni, A. Fasolino, E. Molinari, M. C. Righi,
Potential
energy surface for graphene on graphene: Ab initio derivation, analytical
description, and microscopic interpretation, Physical Review B - Condensed
Matter and Materials Physics 86 (24) (2012).
doi:10.1103/PhysRevB.86.245434.
URL https://journals.aps.org/prb/pdf/10.1103/PhysRevB.86.245434 - (36) J. L. Kaufman, J. Vinckevičiūtė, S. Krishna Kolli, J. Gabriel Goiri, A. Van Der Ven, Understanding intercalation compounds for sodium-ion batteries and beyond, Philosophical Transactions of the Royal Society A: Mathematical, Physical and Engineering Sciences 377 (2152) (2019). doi:10.1098/rsta.2019.0020.
- (37) A. Ramasubramaniam, D. Naveh, Mn-doped monolayer MoS2: An atomically thin dilute magnetic semiconductor, Physical Review B - Condensed Matter and Materials Physics 87 (19) (2013) 1–7. doi:10.1103/PhysRevB.87.195201.
-
(38)
M. Calandra,
Phonon-Assisted
Magnetic Mott-Insulating State in the Charge Density Wave Phase of
Single-Layer 1T-NbSe2, Physical Review Letters 121 (2) (2018) 026401.
doi:10.1103/PhysRevLett.121.026401.
URL https://journals.aps.org/prl/pdf/10.1103/PhysRevLett.121.026401https://link.aps.org/doi/10.1103/PhysRevLett.121.026401 -
(39)
M. Worsdale, A. Rabis, E. Fabbri, T. J. Schmidt, D. Kramer,
Conductivity
Limits of Extrinsically Doped SnO2 Supports, ECS Transactions 69 (17)
(2015) 1167–1178.
doi:10.1149/06917.1167ecst.
URL http://ecst.ecsdl.org/cgi/doi/10.1149/06917.1167ecst - (40) H. Baker, ASM Handbook: Alloy Phase Diagrams Volume 3, 1998.