First principles study on the thermoelectric performance of CaAl2Si2-type Zintl phase compounds
Abstract
We investigate the thermoelectric properties of CaAl2Si2-type Zintl phase compounds ( = Mg, Ca, Sr, Ba, = Mg, Zn, Cd, and = P, As, Sb) using first principles band calculations within the Boltzmann transport theory assuming the constant relaxation time approximation. We introduce the effective degree of valley degeneracy to focus on the relationship between the thermoelectric properties and the multivalley character of the electronic band structure around the Fermi level. We also introduce a quantity , which takes into account and anisotropy of the valley structure, and it is found that enables us to well understand the overall trend of the material dependence of the power factor. We finally suggest promising thermoelectric materials, e.g. BaMg2P2 for PF W/cmK2 and at 300K and SrZn2As2 for PF W/cmK2 and at 300K assuming a relaxation time of 10 fs and a lattice thermal conductivity value of 2 W/mK.
1 Introduction
Thermoelectric materials have recently attracted much attention owing to its capability of directly converting waste heat into electricity. Conversion efficiency of thermoelectric converters is correlated with the dimensionless figure of merit given as follows,
| (1) |
where is the electrical conductivity, is the Seebeck coefficient, is the thermal conductivity, and is the absolute temperature. The power factor , which is the numerator of , is related to the power of the thermoelectric generation. The thermal conductivity is described as the summation of the lattice term and the electronic term .
In order to realize high thermoelectric efficiency, the thermoelectric materials should exhibit the coexistence of large power factor and small thermal conductivity. Reducing the lattice thermal conductivity by nanostructuring is a popular way for obtaining large because nanostructuring can reduce the phonon relaxation time while keeping the carrier mobility[1, 2, 3]. As for the power factor, it is generally difficult to increase both the electrical conductivity and the Seebeck coefficient at the same time due to the anti-correlation between the electrical conductivity and the Seebeck coefficient against the carrier concentration.
From the band structure point of view, a combination of high group velocity of electrons and large density of states around the Fermi level can result in large power factor. Thus, specific band structures have been suggested such as multi-valley band[4], pudding-mold-type band[5], and low dimensional band structure[6, 7, 8]. Especially, the multi-valley structure can play an important role in realizing good thermoelectric performance through material designing such as elemental substitution because a relatively small change in the elements and/or the crystal structure can affect largely the valley degeneracy.[4] Recently discovered thermoelectric material -MgAgSb ( at K)[9] is another example of materials where multi-valley band structure enhances the thermoelectric efficiency.
Recently, a number of Zintl phase compounds have been discovered as good thermoelectric materials.[10] For instance, Yb14MnSb11[11], Ca9Zn4.6Sb9[12], YbCd1.6Zn0.4Sb2[13] and Mg3.2Sb1.5Bi0.49Te0.01[14] have been found to have large exceeding 1. Yb(Cd,Zn)2Sb2 and Mg3+δ(Sb,Bi,Te)2 are 1-2-2 type Zintl phase compounds , where is alkaline earth metal or lanthanoid atom, is Mg, Zn, or Cd, and is pnictogen atom. 1-2-2 type Zintl phase compounds are crystallized in CaAl2Si2-, BaCu2S2- or ThCr2Si2-type structure. For CaAl2Si2-type structure (the space group), both the n- and p-type thermoelectric compounds exhibiting have been found.[13, 16, 14, 15, 17, 18, 19, 10] It has been pointed out that the thermoelectric properties of CaAl2Si2-type compounds can be understood within the multi-valley scenario.[20, 14, 21] For the p-type compounds, the valence band structure mainly consists of the orbitals of atoms at the site, and the number of the bands around the Fermi level strongly correlates with the power factor and the dimensionless figure of merit. Also in the electron doped case, Mg3Sb2 possesses multi-valley structure, where the conduction band is minimized at around the L point in the Brillouin zone.
Both theoretically and experimentally, 1-2-2 type Zintl phase compounds for =Sb have been widely investigated[13, 16, 14, 15, 17, 18, 19, 10, 20, 26, 28, 22, 24, 27, 25, 23, 21], but in the last few years, 1-2-2 type arsenides have been discovered as good thermoelectric materials. For instance, K-doped BaZn2As2 and BaCd2As2 possess and 0.8, respectively.[29, 30, 31] The thermal conductivity for and however tends to be larger than that for , but small lattice thermal conductivity has been obtained for K-doped BaCd2As2 (0.46 W/mK at 773K) and K-doped BaZn2As2 (W/mK at 773K). The number of the valley structure of the phosphides and arsenides in the hole doped regime tend to be large due to the reduction of the spin-orbit coupling constant compared to the antimonides[20, 26, 32], so that thermoelectric performance of the phosphides and arsenides is expected to become larger than that of antimonides. Thus promising thermoelectric materials could be discovered in the 1-2-2 type Zintl phase arsenides and phosphides.
Given this background, we investigate the thermoelectric properties of 25 compounds of CaAl2Si2-type crystal structure in not only antimonides but also arsenides and phosphides. In order to analyze the relationship between the multi-valley structure and the thermoelectric properties, we introduce a quantity that stands for the effective number of valleys contributing to the thermoelectric properties, and also a quantity which corresponds to a combination of the magnitude of the anisotropy of the band structure and the number of valleys. In the hole doped regime, the split of the bands due to spin-orbit coupling still appears not only in antimonides but also in arsenides and phosphides, and it is found that phosphides are suitable for maximizing the number of valleys. The number of valleys in the electron doped regime tends to be larger than 3 because of the lowest conduction band at the M point. The degree of the valley degeneracy is maximized at or and , in which the - and -orbital components at the and sites construct the conduction band structure. We conclude that CaAl2Si2-type phosphides and arsenides can be promising thermoelectric materials, such as p-type BaMg2P2 for PF W/cmK2 and at 300K and n-type SrZn2As2 for PF W/cmK2 and at 300K assuming the relaxation time to be 10 fs and the lattice thermal conductivity value to be 2 W/mK.
2 Method
For the 25 compounds listed in Table 4, the crystal structure is optimized by means of first principles calculations with the VASP package[33, 34, 35, 36, 37] using the Perdew–Burke–Ernzerhof exchange-correlation functional revised for solids (PBEsol)[38] without considering the spin-orbit coupling. We take a -mesh in the Brillouin zone, and plane wave cut-off energy of 816 eV. Using the optimized crystal structures, the electronic band structure and the thermoelectric properties are performed using the WIEN2k package[39, 40] with modified Becke–Johnson potential[41, 42] considering the spin-orbit coupling. We set , and use 2,000 and 100,000 -points in the Brillouin zone for self-consistent calculation and calculation of the thermoelectric properties, respectively.
For calculating the thermoelectric properties, we use the BoltzTraP code[43], which can evaluate the Seebeck coefficient, the electrical conductivity, and the electronic term of the thermal conductivity within the Boltzmann transport theory assuming the constant relaxation time . The thermoelectric properties using the BoltzTraP code are calculated as described below,
| (2) | |||||
| (3) | |||||
| (4) | |||||
| (5) |
where is the transport coefficient tensor, is the elementary charge, is the group velocity of electrons at a certain wave vector and the -th band structure , is the Fermi-Dirac distribution function, and is the chemical potential. Within the constant relaxation time approximation, the Seebeck coefficient does not depend on the relaxation time, but the electrical conductivity and the electronic thermal conductivity depend on the relaxation time. Because it is difficult to evaluate the relaxation time and the thermal conductivity using first principles calculations, we assume fs and W/mK in this study. In fact, it has been found that the lattice thermal conductivity is around 1 to 2 W/mK for 1-2-2 type arsenides BaCd2As2 and BaZn2As2.[29, 30, 31]
3 Results and Discussion
3.1 The crystal structure and the electronic band structure

We first show the crystal structure of a CaAl2Si2-type compound Mg3As2 in Fig. 1(a). Almost all the crystal structures and the band structures of have already been discussed in previous studies, so that we will mainly show the result of arsenides. The CaAl2Si2-type crystal structure consists of alternately stacked []2- anionic layers and cation sheets. In a []2- two-dimensional layer, pnictogen atoms at the site form two edge sharing tetrahedra, where the atoms at the site are centered. The optimized lattice parameters and , and the internal coordinates at the and sites are listed in Table 1 for the arsenides and Table 4 for the 25 compounds. The calculated structural parameters are in good agreement with the experimental results. For example, the crystal parameters of Mg3As2 are , and (experiment[45]), and , , and (present calculation).
| compound | ||||
|---|---|---|---|---|
| Mg3As2 | 4.26 | 6.69 | 0.642 | 0.229 |
| CaMg2As2 | 4.34 | 7.04 | 0.635 | 0.247 |
| CaZn2As2 | 4.13 | 6.92 | 0.631 | 0.257 |
| CaCd2As2 | 4.38 | 7.09 | 0.633 | 0.234 |
| ZnMg2As2 | 4.23 | 6.49 | 0.646 | 0.218 |
| SrMg2As2 | 4.40 | 7.34 | 0.630 | 0.260 |
| SrZn2As2 | 4.19 | 7.19 | 0.629 | 0.270 |
| SrCd2As2 | 4.44 | 7.36 | 0.632 | 0.249 |
| BaMg2As2 | 4.47 | 7.68 | 0.625 | 0.272 |
| BaCd2As2 | 4.51 | 7.64 | 0.630 | 0.262 |
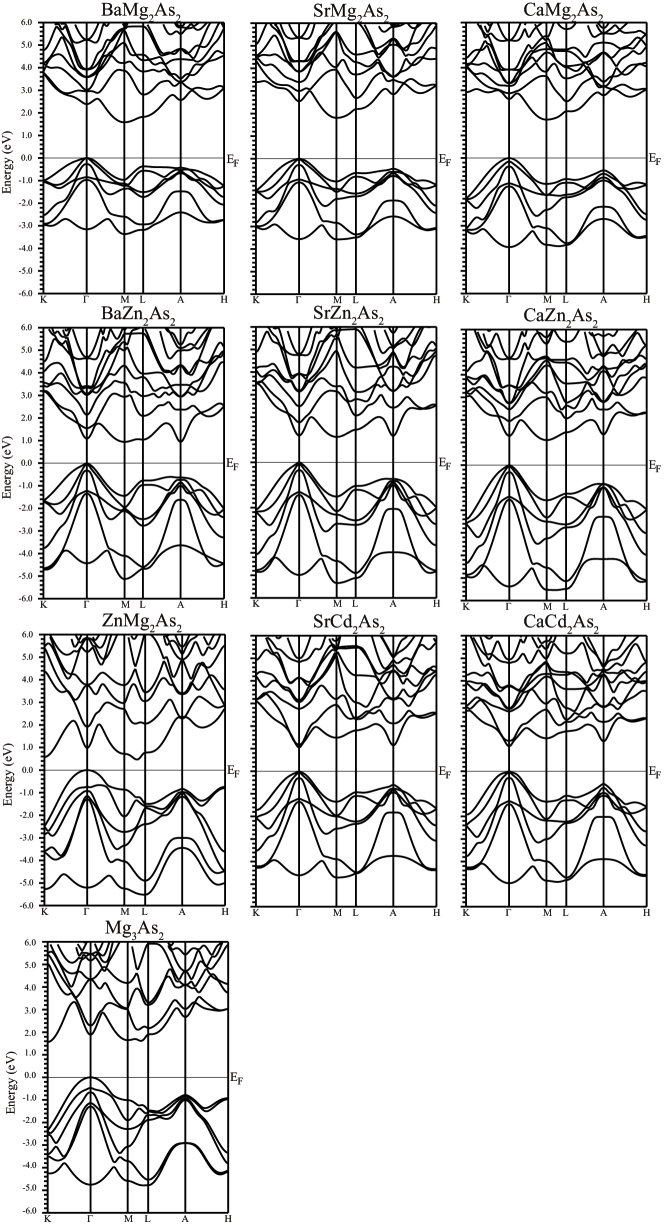
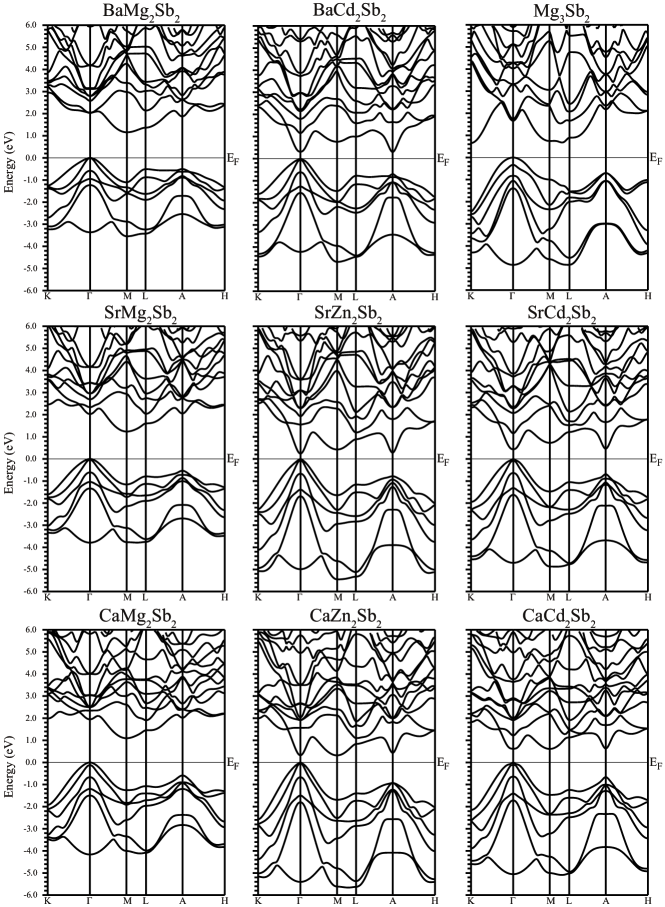
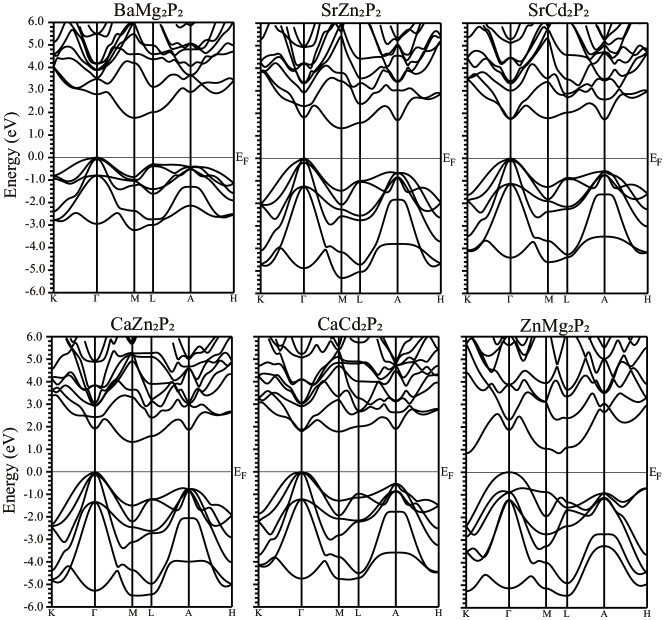
The electronic band structure of the 25 compounds is shown in Figs. 9, 10 and 11. Due to the space group, the Brillouin zone shown in Fig. 1(b) has a hexagonal prism structure, and there are one point, two K/H points, and three M/L points. The electronic band structure and the density of states for Mg3As2 shown in Fig. 1(c) clearly indicate that the six valence bands ranging from to 0 eV measured from the Fermi level mainly consist of the orbitals of the As atoms at the sites. The highest valence band mainly originates from the orbital, and the second and third highest bands are mainly composed of the hybridization of the and orbitals. Due to the symmetry of the crystal structure and the orbital character of the and orbitals, the second and third highest bands should have two-fold degeneracy at the point, but the hybridization between all the orbitals due to spin-orbit coupling split the two bands. In the conduction bands, the band structure originates from the hybridization of orbitals of all the atoms, but is mainly composed of the orbital of the Mg atoms positioned at the site and the and orbitals at the site. The bottom of the conduction band is positioned at the K point and a certain wave vector around the L point, which corresponds to eight Fermi surfaces in the electron doped regime as shown in Fig. 1(b). The eight valleys in the conduction band thus contribute to the thermoelectric effect in the electron doped case.
3.2 Thermoelectric properties
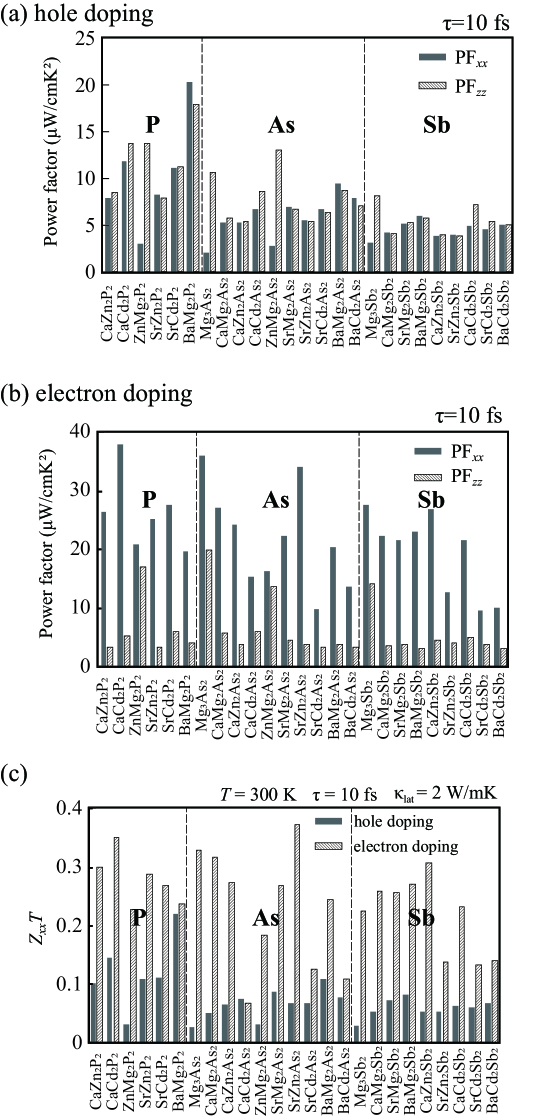
In Figs. 2(a) and (b), we show the maximum and components of the power factor, within the doping level of 0.1 carriers per unit cell, for each compound in the hole and electron doped regime. The doping level at which the maximum power factor is obtained is listed in Tables 5 and 6 within this doping level. Actually, some compounds e.g. Mg3As2 exhibit large power factor even at around 0.5 holes per unit cell because of the large density of states at around eV (Fig. 1(c)), but the Seebeck coefficient is smaller than 50 V/K, which does not result in a large figure of merit exceeding 1. This is because the maximum value of the dimensionless figure of merit is determined by the ratio of to the Lorenz number when we assume the Wiedemann–Franz law to hold and , and at least V/K is required to obtain .
In the hole doped regime, the maximum value of the and components of the power factor is comparable to each other (Fig. 2(a)) because the effective mass in the , and directions is comparable, e.g. for CaZn2As2, the effective mass of the first valence band is , where is the electron mass. The maximum power factor for the P system tends to be larger than that for the As and Sb systems, whereas the power factor in the electron doped regime (Fig.2(b)) does not strongly depend on the pnictogen atom at the site. The maximum values of the dimensionless figure of merit along the -axis is shown in Fig. 2(c). The result of reflects the tendency of the power factor in the electron and hole doped regime, namely, p-type in the P system tends to be larger than that in the As and Sb systems, assuming W/mK for all the compounds.
3.3 Valley degeneracy in the hole doped regime
In the hole doped regime, the valley degeneracy originating from the three bands around the Fermi level plays an important role for the thermoelectric effect. In Ref. \citenZhang2016, the energy difference has been used to reflect the degeneracy of the three bands around the Fermi level. is defined as , where and are the energy of the two bands and one band at the point. In this evaluation, the two bands are degenerate at the point because the spin-orbit coupling is not considered. As shown in Fig. 1(c), the spin-orbit coupling forces the bands to split, so that two energy differences and should be considered for evaluating the valley degeneracy. and are the energy difference between the first and second highest valence bands, and between the first and third bands at the point, respectively (see Fig. 1(c)). It has been found that is almost the same as , and is much larger than in the Sb system[20]. can therefore reflect the degree of degeneracy of the first and second bands.
However, when both and are smaller than several , it is important to understand how many bands contribute to the thermoelectric properties using and . We thus introduce , the effective degree of the band degeneracy, extended to non-integer numbers, as described below,
| (6) |
where is zero, namely, the energy of the highest valence band at the point, and the chemical potential and the temperature that enter are fixed at and K In Eq. (6), is the normalization factor for obtaining at .
Eq. (6) originates from the transport coefficient , which are also written as follows,
| (7) | |||||
| (8) |
in the transport coefficient extracts the energy range in which the band structure contribute to the thermoelectric effect. The contribution to the electrical conductivity thus comes from the band structure within the energy range between several . For the Seebeck coefficient, due to the term of of in Eq. (7), the energy range is wider than that for the electrical conductivity. We use the energy at the point and for simplification instead of to evaluate the contribution of the band structure to the thermoelectric effect. The reason why we take in is because we intend to analyze the correlation between and the maximum power factor (within the hole doping rate of ), and the power factor tends to be maximized at a doping rate corresponding to . In some cases, the power factor is maximized at away from zero, but even in this case, we have checked that the power factor at is comparable to its maximum value. Using Eq. (6), we obtain the effective degree of the valley degeneracy of 0.8, 0.4 and 0.1 for , , and , respectively.
| SOC | no SOC | |||||
|---|---|---|---|---|---|---|
| Mg3As2 | 0.47 | 0.66 | 1.00 | 2.0 | -0.52 | 1.00 |
| CaMg2As2 | 0.15 | 0.37 | 1.20 | 5.3 | -0.19 | 1.19 |
| CaZn2As2 | 0.06 | 0.31 | 1.74 | 5.3 | 0.10 | 2.43 |
| CaCd2As2 | 0.06 | 0.30 | 1.71 | 6.7 | 0.10 | 2.46 |
| ZnMg2As2 | 0.74 | 0.93 | 1.00 | 2.8 | -0.81 | 1.00 |
| SrMg2As2 | 0.03 | 0.27 | 1.95 | 6.9 | -0.04 | 2.75 |
| SrZn2As2 | 0.08 | 0.34 | 1.57 | 5.5 | 0.15 | 2.18 |
| SrCd2As2 | 0.07 | 0.30 | 1.68 | 6.7 | 0.11 | 2.38 |
| BaMg2As2 | 0.00 | 0.26 | 2.02 | 9.5 | 0.01 | 2.99 |
| BaCd2As2 | 0.07 | 0.31 | 1.68 | 7.9 | 0.11 | 2.37 |
| BaMg2Sb2 | 0.07 | 0.61 | 2.00 | 4.2 | 0.01 | 2.99 |
| BaMg2P2 | 0.01 | 0.08 | 2.59 | 20.3 | 0.00 | 3.00 |
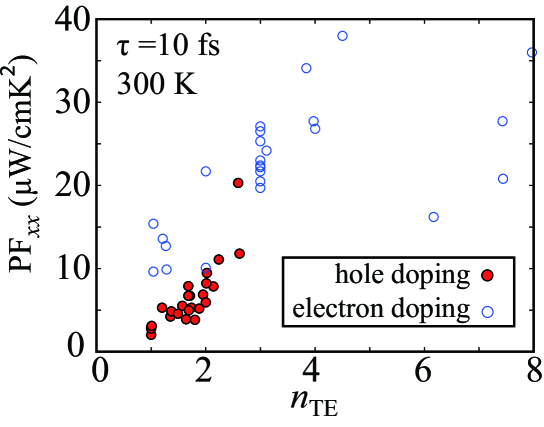
Table 2 shows, for the As systems (and also for BaMg2Sb2 and BaMg2P2), the energy differences , the maximum power factor within the doping level of less than 0.1 holes, and the effective degree of the valley degeneracy . The data for all the 25 compounds are listed in Table 4. The maximum value of the component of the power factor is plotted against in Fig. 3. We can clearly see the correlation between the degree of the band degeneracy and the power factor in the hole doped regime.
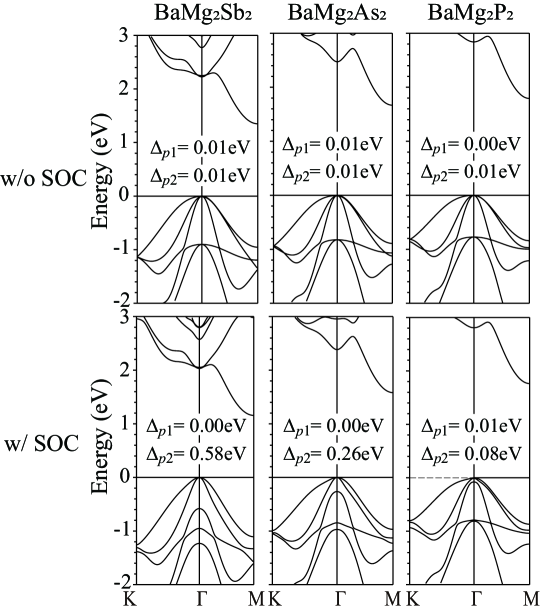
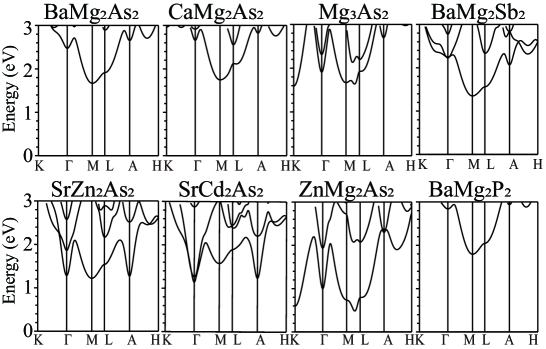
To understand the material dependence of the degree of degeneracy, we show in Fig. 4 the electronic band structure calculated with or without the spin-orbit coupling considered. When we ignore the spin-orbit coupling, the three bands of BaMg are almost degenerate at the point, but drastically increases when the spin-orbit coupling is turned on for the Sb and As systems. The smallest value of for each pnictogen system is 0.58 for , 0.26 for , and 0.07 eV for , which corresponds to 22 for Sb, 10 for As and 2.7 for P at 300K. Thus, the effect of the spin-orbit coupling on is not so small even in the P system. We evaluate the ratio of with and without including spin-orbit coupling, and the median of the ratio is 0.68, 0.72 and 0.95 in the Sb, As and P systems, respectively. Hence the P system is favorable at least from the viewpoint of enhancing the thermoelectric efficiency through increasing the degree of valley degeneracy.
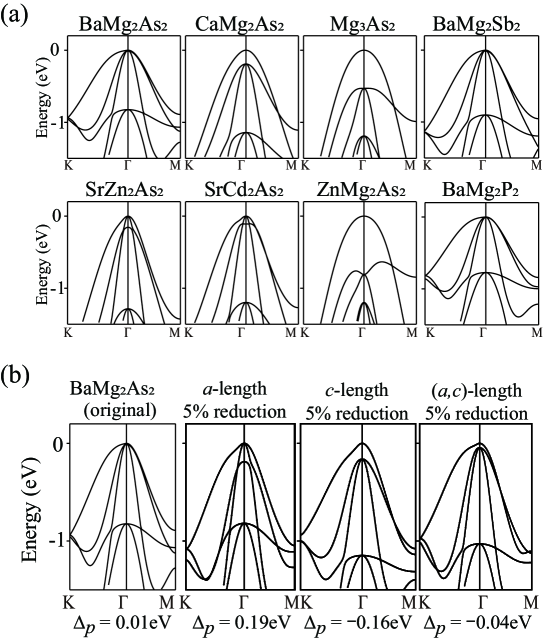
We move onto the discussion on the element dependence of the valley degeneracy. Fig. 5(a) shows the valence band structure calculated without including the spin-orbit coupling. It is found that the energy splitting between the and orbitals becomes larger with decreasing the atomic number at the site from Ba to Ca and Mg (see the band structure of Mg2As2 for and in Fig. 5(a)). We can naturally understand the -site dependence of the energy splitting by considering the variation of the lattice parameters. Fig. 5(b) shows the band structure of BaMg2As2 with hypothetical crystal structures where the lattice parameters are reduced from the optimized ones and the internal coordinates are fixed at the optimized ones. It is found that the -length controls the As-As distance at the same -coordinate in the [Mg2As2]2- layers, and thus the on-site energy and the hopping integrals of the and orbitals in the two-dimensional layers increase. The energy of the bands at the point becomes larger than that of the band when the -length is reduced. On the other hand, when the lattice parameter decreases, the energy of the band at the point increases. Actually, substituting the Mg atom for the Ba atom at the site reduces the lattice constant and by 5% and 13%, respectively. The correlation between the -length and can be seen in ZnMg2As2, where the lattice constant is smaller than that of Mg3As2.
This correlation can be seen in the elemental substitution at another site. In the comparison of the lattice parameters of SrZn2As2 and SrCd2As2, the ratios of to are 0.58 and 0.60, respectively. Thus the energy difference of the and bands for SrCd2As2 is a bit smaller than that for SrZn2As2. In the case of the elemental substitution at the site, the ratio of to barely changes from 0.58 to 0.59, so that the energy difference remains almost unchanged against the variation of the pnictogen atom. In fact, the energy difference of BaMg for is nearly 0 eV when we exclude the spin-orbit coupling as shown in Fig. 4. We can conclude that two of the important factors for increasing the effective degree of the valley degeneracy are (i) to increase the atomic number of the site for optimizing the lattice parameters, (ii) to reduce the atomic number of the site for reducing the spin-orbit coupling constant. It is noted that the material dependence of cannot be understood from the variation of alone. For instance, of BaMg2As2 and SrZn2As2 is comparable but the difference in between the two compounds is 0.15 eV. This may be because of the difference in the group of elements at the site, which can affect the - bonding condition.
We note that one of the bands along the -M direction becomes less dispersive when we replace Ba with Mg at site (see the second highest valence band of Mg3As2 and BaMg2As2 in Fig. 5(a)). Thus the effective mass of this band in Mg3As2 is much larger than that of BaMg2As2. For ZnMg2As2, the effective mass of the band at the point is positive along the -M direction, so that the multiple Fermi surfaces appear when is positioned at around eV although this would be a heavily hole doped situation. ZnMg2As2 could possess largest if the band sank below the bands. From the viewpoint of the anisotropy of the electronic band structure, ZnMg2As2 and Mg3As2 also possess strongly anisotropic band, which results in the large density of states and the large group velocity. If this anisotropic feature of the band structure can be realized in the large -length regime, where the top of the bands is above that of the band, large thermoelectric performance is expected.
3.4 Valley degeneracy in the electron doped regime
| compound | 1 | 2 | K | M | ||
|---|---|---|---|---|---|---|
| Mg3As2 | 0.01 | 0.00 | 2.00 | 5.96 (M∗) | 7.97 | 36.0 |
| CaMg2As2 | 0.00 | 0.00 | 0.00 | 3.00 | 3.00 | 27.1 |
| CaZn2As2 | 0.11 | 0.00 | 0.00 | 3.00 | 3.11 | 24.2 |
| CaCd2As2 | 1.00 | 0.03 | 0.00 | 0.01 | 1.04 | 15.4 |
| ZnMg2As2 | 0.00 | 0.00 | 0.17 | 6.00 (M∗) | 6.17 | 16.2 |
| SrMg2As2 | 0.00 | 0.00 | 0.00 | 3.00 | 3.00 | 22.4 |
| SrZn2As2 | 0.84 | 0.00 | 0.00 | 3.00 | 3.84 | 34.1 |
| SrCd2As2 | 1.00 | 0.28 | 0.00 | 0.00 | 1.28 | 9.9 |
| BaMg2As2 | 0.00 | 0.00 | 0.00 | 3.00 | 3.00 | 20.5 |
| BaCd2As2 | 1.00 | 0.20 | 0.00 | 0.01 | 1.21 | 13.6 |
We now discuss the effective degree of degeneracy in the electron doped regime. Although the spin-orbit coupling reduces the degree of the valley degeneracy in the hole doped regime as shown in Fig. 4, the spin-orbit coupling barely affect the conduction bands near the Fermi level. This is because the energy splitting due to the spin-orbit coupling does not exist in the lowest conduction bands. Actually, the maximum power factor obtained considering the spin-orbit coupling shown in Fig. 2 is almost the same as that obtained without considering the spin-orbit coupling (not shown).
We show the electronic band structure obtained without considering the spin-orbit coupling in Fig. 6. The lowest conduction band is minimized at , K or M point in the calculated compounds except for a few compounds such as Mg. To discuss the band degeneracy in the electron doped regime, we modify the expression of Eq. (6) by including the band structure at other -points, which is described below,
| (9) |
where is the number of equivalent -points for the wave vectors , M, and K ( for , 2 for K, and 3 for M), and is the energy difference between the first and -th lowest conduction band at the wave vector . and for in Eq. (9) are zero (bottom of the conduction band) and 300 K, respectively. In Mg3X2 and ZnMg2P2, the conduction band minimum is positioned at around L point, so that we add this -point denoted as “M∗” in Table 3 in the summation of Eq. (9) instead of the point. The calculated degree of the valley degeneracy is shown in Table 3, and the power factor is plotted against in Fig. 3. Also in the electron doped regime, positive correlation between the valley degeneracy and the power factor except for Mg and ZnMg exhibiting large (see Tables 3, and 4–6).
In Table 3, it is found that the degree of the valley degeneracy tends to be larger than three because the lowest energy of the conduction band of almost all the 25 compounds is minimized at the M point. The average value of is actually 3.55, which means that the n-type CaAl2Si2-type compounds can exhibit larger thermoelectric performance than p-type compounds. In addition, for or , the conduction band minimum is positioned at around L point, so that the band degeneracy drastically increases due to the six-valley band structure.
The six valleys of the lowest conduction band at the M∗ point may originate from the orbital character of the element at the site. The conduction band minimum at the M∗ point appears only when the orbital at the site construct the conduction bands. or fullfil this condition, and actually exhibit the six-valley structure in the conduction bands. For , or , the orbitals of the atom construct the conduction bands, which are minimized at the M or point. We calculated the electronic band structure of BaMg2As2 using the lattice parameters and the internal coordinates modified to be the same as those of Mg3As2, but the six-valley structure does not appear, so that we conclude that the six-valley structure does not originate from a peculiar set of lattice parameters and internal coordinates. From the viewpoint of the band degeneracy, ZnMg and Mg3As2 can be promising thermoelectric materials. For SrCd2As2, the lowest energy at the point is larger than that at the M point, so that the degree of the valley degeneracy therefore changes from 3 to 1 for the elemental substitution of = Zn with Cd. The partial elemental substitution of Zn with Cd can thus maximize the band degeneracy at the Fermi level. Table 3 shows that the number of valleys does not strongly depend on the pnictogen atom, but the average of the component of the power factor increases when Sb is replaced with P and As, because of the increase of the effective mass.
3.5 Valley degeneracy and anisotropy
The relationship between the band degeneracy and the power factor shown in Fig. 3 exhibits a positive correlation, but some results cannot be understood using only . For example, the power factor at is widely spread from 3 to 15W/cmK2. Moreover, the power factor for n-type ZnMg2As2 () is not larger than that of the compounds at . This is because we do not include the effect of the density of states and the group velocity, which mainly contribute to the thermoelectric effect within the constant relaxation time approximation. The coexistence of large density of states and large group velocity is realized by strong anisotropy of the band structure. Assuming the constant relaxation time approximation, the component of in Eq. (8) can be rewritten as
| (10) |
where is the average of the group velocity at the energy , and is the density of states.
When the band structure has a three dimensional character, namely, the band width along the and directions is much larger than , the density of states and the average value of the group velocity are proportional to and , respectively. is thus proportional to , so that we introduce a quantity which simultaneously takes into account the anisotropy of the band structure and the valley degeneracy,
| (11) |
where is the effective mass of the -th band centered at the wave vector .[46]
The above formula for is based on the assumption that the density of states is proportional to , which is not correct for electronic structures with low dimensionality. This can be understood by taking the limit, where . In order to see what kind of correction should be made for for low dimensional systems, we analyze a simple tightbinding model given as,
| (12) |
where , and are the nearest neighbor hopping integrals along the , and axis, respectively. Within this tightbinding model, the effective mass is expressed as and .
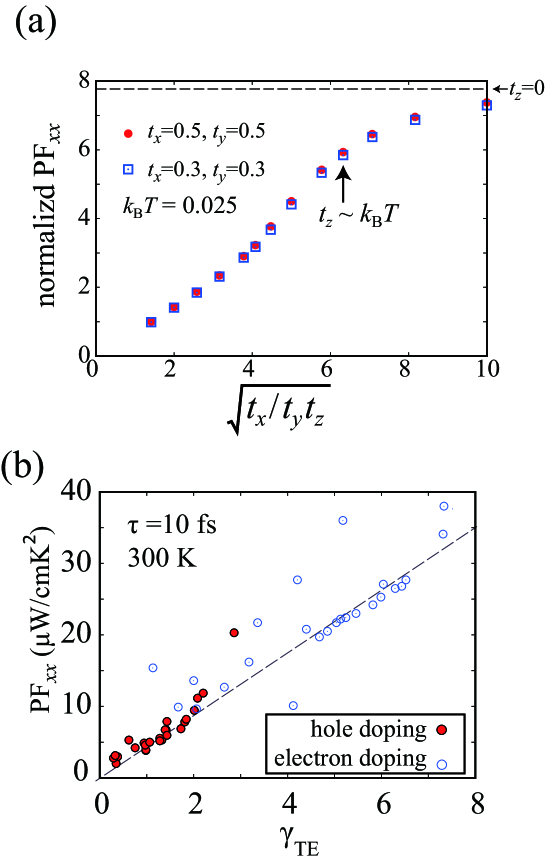
The power factor obtained using this model is normalized such that the value at , and = 0.025 is equal to 1. The normalized power factor of this model is plotted against in Fig. 7(a). Here we fix at 0.3 or 0.5 and vary . The power factor for and exhibits essentially the same values for a fixed because depends not on the value of and but on the ratio of to .[47] The calculated power factor is almost proportional to , but at around , the slope of the power factor as a function of becomes small. This behavior of the power factor originates from the small band width along the axis, which is evaluated as . Therefore, when , namely, at 300K, the band structure should be regarded as a two-dimensional one as far as the power factor is concerned. Based on the present analysis, in Eq. (11), we set as when because the power factor is essentially independent of for nearly two-dimensional systems with such large values of .
In Fig. 7(b), we plot the maximum value of the component of the power factor for the 25 compounds against , which clearly shows that the power factor is basically proportional to . Thus can be used to find promising thermoelectric materials. On the other hand, we may say that the materials which largely deviate from the linear plot toward the larger regime in Fig. 7 can be considered as those whose power factor is boosted owing presumably to the invalidity of the effective mass approximation.
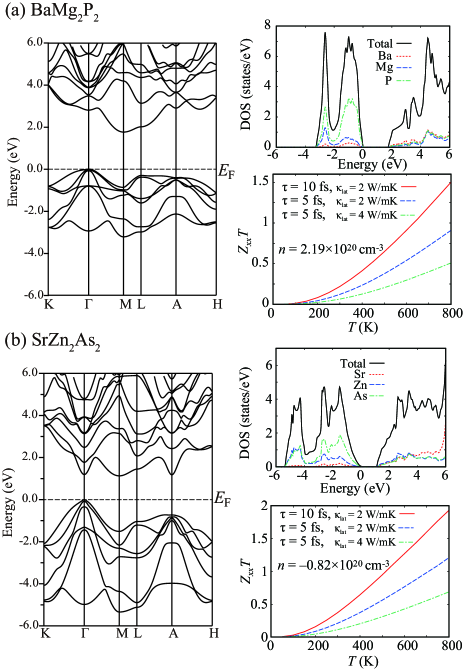
Finally, in Fig. 8, we analyze in detail the two compounds which possess the largest largest dimensionless figure of merit in the electron and hole doped regime, respectively. p-type BaMg2P2 exhibits W/cmK2 and at 300K assuming the relaxation time to be 10 fs and the lattice thermal conductivity to be 2 W/mK. It can be seen that of BaMg2P2 deviates from the linear line depicted in Fig. 7(b), which means that the valence band structure of BaMg2P2 cannot be described within the effective mass approximation. The band structure shown in Fig. 8(a) actually indicates that the effective mass at the point is totally different from that at the point. The band structure along A-L has nearly flat portion, which gives rise to the large density of states around the Fermi level. We also show the temperature dependence of the dimensionless figure of merit at the doping level at which the dimensionless figure of merit is maximized at 300K. The dimensionless figure of merit can be rewritten as . The terms of and do not depend on the relaxation time because it implicitly appears in the expression of and , so that is one of the key parameters that determine . In reality, the relaxation time tends to decrease when the temperature increases, but at the same time decreases, so that assuming a constant can be considered as a reasonable approximation. The experimentally observed lattice thermal conductivity for the Sb and As systems is around 2 W/mK at 300K[49, 50, 48, 29, 30, 31], so that with a similar order could be expected also in the P system, although the lattice thermal conductivity tends to be larger in the phosphides than in the antimonides. For the n-type compounds, largest dimensionless figure of merit is obtained in SrZn2As2, which possesses larger PF of W/cmK2 and large of 0.35 at 300K. This is because the effective degree of the valley degeneracy is about 4 due to the conduction bands at the and M points. Both the conduction band structures at the and M points exhibit two-dimensional shape, which results in the large density of states above the Fermi level. The dimensionless figure of merit thus exceeds 1 at around 500 K.
4 Conclusion
We have theoretically investigated the thermoelectric properties of the 25 CaAl2Si2-type Zintl phase compounds . In order to analyze the relationship between the electronic band structure and the thermoelectric properties, we have introduced the quantity , which reflects the valley degeneracy. We can see the positive correlation between and the power factor. It is found that the valley degeneracy is maximized when in the hole doped regime, and or in the electron doped regime. We have also introduced , which takes into account the effect of the effective mass and the valley degeneracy contributing to the thermoelectric properties. We have found that the power factor of many of the 25 compounds is proportional to . Assuming the relaxation time to be 10 fs and the lattice thermal conductivity to be 2 W/mK, SrZn2As2 can exceed at 300K for n-type, and of BaMg2P2 is larger than 0.2 at 300K for p-type. Other compounds also exhibit large degree of the valley degeneracy, so that we can conclude that there is a room to find promising thermoelectric materials in the CaAl2Si2-type Zintl phase pnictides.
We acknowledge C.H. Lee, K. Kihou, H. Kunioka and Y. Kimura for fruitful discussions. This work was supported by JSPS KAKENHI (Grants No. 19K15436) and JST CREST (Grant No. JPMJCR20Q4), Japan.
Appendix A The results of the electronic band structure and the thermoelectric properties
In this appendix, we show the electronic band structure and the thermoelectric properties of all the 25 compounds in Figs. 9, 10 and 11, and Tables 4, 5 and 6. The optimized lattice parameters and , and the internal coordinates at the and sites are listed in Table 1 for the arsenides and Table 4 for the 25 compounds. The doping level at which the maximum power factor is obtained is listed in Tables 5 and 6 within the doping level of less than 0.1 holes/electrons at 300K.
| CaZn2P2 | 3.99 | 6.74 | 0.633 | 0.262 | 0.03 | 0.15 | 2.14 | 3.00 |
| CaCd2P2 | 4.25 | 6.94 | 0.637 | 0.238 | 0.02 | 0.07 | 2.62 | 4.50 |
| ZnMg2P2 | 4.11 | 6.26 | 0.652 | 0.222 | 0.87 | 0.91 | 1.00 | 7.44 |
| SrZn2P2 | 4.05 | 7.02 | 0.630 | 0.274 | 0.03 | 0.20 | 2.01 | 3.00 |
| SrCd2P2 | 4.32 | 7.20 | 0.635 | 0.252 | 0.03 | 0.12 | 2.24 | 3.97 |
| BaMg2P2 | 4.35 | 7.52 | 0.624 | 0.275 | 0.01 | 0.08 | 2.59 | 3.00 |
| Mg3As2 | 4.26 | 6.69 | 0.642 | 0.229 | 0.47 | 0.66 | 1.00 | 7.97 |
| CaMg2As2 | 4.34 | 7.04 | 0.635 | 0.247 | 0.15 | 0.37 | 1.20 | 3.00 |
| CaZn2As2 | 4.13 | 6.92 | 0.631 | 0.257 | 0.06 | 0.31 | 1.74 | 3.11 |
| CaCd2As2 | 4.38 | 7.09 | 0.633 | 0.234 | 0.06 | 0.30 | 1.71 | 1.04 |
| ZnMg2As2 | 4.23 | 6.49 | 0.646 | 0.218 | 0.74 | 0.93 | 1.00 | 6.17 |
| SrMg2As2 | 4.40 | 7.34 | 0.630 | 0.260 | 0.03 | 0.27 | 1.95 | 3.00 |
| SrZn2As2 | 4.19 | 7.19 | 0.629 | 0.270 | 0.08 | 0.34 | 1.57 | 3.84 |
| SrCd2As2 | 4.44 | 7.36 | 0.632 | 0.249 | 0.07 | 0.30 | 1.68 | 1.28 |
| BaMg2As2 | 4.47 | 7.68 | 0.625 | 0.272 | 0.00 | 0.26 | 2.02 | 3.00 |
| BaCd2As2 | 4.51 | 7.64 | 0.630 | 0.262 | 0.07 | 0.31 | 1.68 | 1.21 |
| Mg3Sb2 | 4.55 | 7.19 | 0.632 | 0.224 | 0.33 | 0.83 | 1.01 | 7.43 |
| CaMg2Sb2 | 4.64 | 7.48 | 0.630 | 0.241 | 0.11 | 0.66 | 1.35 | 3.00 |
| SrMg2Sb2 | 4.70 | 7.75 | 0.629 | 0.254 | 0.04 | 0.61 | 1.88 | 3.00 |
| BaMg2Sb2 | 4.77 | 8.09 | 0.626 | 0.267 | 0.00 | 0.58 | 2.00 | 3.00 |
| CaZn2Sb2 | 4.41 | 7.36 | 0.631 | 0.256 | 0.05 | 0.66 | 1.80 | 4.00 |
| SrZn2Sb2 | 4.48 | 7.63 | 0.632 | 0.270 | 0.07 | 0.66 | 1.64 | 1.27 |
| CaCd2Sb2 | 4.64 | 7.51 | 0.630 | 0.236 | 0.11 | 0.64 | 1.37 | 2.00 |
| SrCd2Sb2 | 4.70 | 7.75 | 0.631 | 0.249 | 0.09 | 0.63 | 1.49 | 1.04 |
| BaCd2Sb2 | 4.78 | 8.00 | 0.632 | 0.262 | 0.07 | 0.61 | 1.69 | 2.00 |
| CaZn2P2 | 0.037 | 7.8 | 0.027 | 8.5 | 0.004 | 0.10 | 0.020 | 0.09 |
|---|---|---|---|---|---|---|---|---|
| CaCd2P2 | 0.023 | 11.8 | 0.013 | 13.7 | 0.014 | 0.15 | 0.009 | 0.18 |
| ZnMg2P2 | 0.097 | 3.0 | 0.004 | 13.7 | 0.012 | 0.03 | 0.003 | 0.18 |
| SrZn2P2 | 0.007 | 8.2 | 0.050 | 7.9 | 0.004 | 0.11 | 0.035 | 0.07 |
| SrCd2P2 | 0.044 | 11.1 | 0.029 | 11.2 | 0.022 | 0.11 | 0.020 | 0.13 |
| BaMg2P2 | 0.070 | 20.3 | 0.077 | 17.9 | 0.027 | 0.22 | 0.027 | 0.20 |
| Mg3As2 | 0.098 | 2.0 | 0.003 | 10.6 | 0.009 | 0.03 | 0.009 | 0.14 |
| CaMg2As2 | 0.097 | 5.3 | 0.002 | 5.8 | 0.027 | 0.05 | 0.002 | 0.08 |
| CaZn2As2 | 0.082 | 5.3 | 0.071 | 5.4 | 0.005 | 0.07 | 0.005 | 0.06 |
| CaCd2As2 | 0.099 | 6.7 | 0.009 | 8.6 | 0.012 | 0.07 | 0.007 | 0.12 |
| ZnMg2As2 | 0.099 | 2.8 | 0.003 | 13.0 | 0.014 | 0.03 | 0.002 | 0.17 |
| SrMg2As2 | 0.097 | 6.9 | 0.014 | 6.6 | 0.010 | 0.09 | 0.010 | 0.09 |
| SrZn2As2 | 0.097 | 5.5 | 0.094 | 5.4 | 0.007 | 0.07 | 0.007 | 0.05 |
| SrCd2As2 | 0.097 | 6.7 | 0.097 | 6.3 | 0.008 | 0.07 | 0.008 | 0.07 |
| BaMg2As2 | 0.095 | 9.5 | 0.095 | 8.7 | 0.013 | 0.11 | 0.013 | 0.10 |
| BaCd2As2 | 0.099 | 7.9 | 0.099 | 7.1 | 0.010 | 0.08 | 0.011 | 0.07 |
| Mg3Sb2 | 0.083 | 3.1 | 0.002 | 8.1 | 0.071 | 0.03 | 0.002 | 0.11 |
| CaMg2Sb2 | 0.016 | 4.2 | 0.002 | 4.1 | 0.014 | 0.05 | 0.002 | 0.06 |
| SrMg2Sb2 | 0.009 | 5.2 | 0.010 | 5.2 | 0.007 | 0.07 | 0.007 | 0.07 |
| BaMg2Sb2 | 0.009 | 5.9 | 0.010 | 5.7 | 0.007 | 0.08 | 0.007 | 0.08 |
| CaZn2Sb2 | 0.004 | 3.8 | 0.004 | 4.0 | 0.003 | 0.05 | 0.003 | 0.06 |
| SrZn2Sb2 | 0.006 | 3.9 | 0.005 | 3.8 | 0.004 | 0.05 | 0.004 | 0.05 |
| CaCd2Sb2 | 0.012 | 4.9 | 0.006 | 7.2 | 0.011 | 0.06 | 0.006 | 0.10 |
| SrCd2Sb2 | 0.010 | 4.6 | 0.007 | 5.4 | 0.009 | 0.06 | 0.005 | 0.07 |
| BaCd2Sb2 | 0.008 | 5.0 | 0.006 | 5.0 | 0.006 | 0.07 | 0.005 | 0.07 |
| CaZn2P2 | 0.016 | 26.5 | 0.008 | 3.3 | 0.007 | 0.30 | 0.008 | 0.05 |
|---|---|---|---|---|---|---|---|---|
| CaCd2P2 | 0.054 | 38.0 | 0.028 | 5.2 | 0.012 | 0.35 | 0.016 | 0.07 |
| ZnMg2P2 | 0.091 | 20.8 | 0.012 | 16.9 | 0.007 | 0.23 | 0.006 | 0.20 |
| SrZn2P2 | 0.017 | 25.3 | 0.008 | 3.3 | 0.007 | 0.29 | 0.008 | 0.05 |
| SrCd2P2 | 0.034 | 27.7 | 0.025 | 5.9 | 0.010 | 0.27 | 0.022 | 0.08 |
| BaMg2P2 | 0.020 | 19.7 | 0.013 | 3.9 | 0.010 | 0.24 | 0.011 | 0.06 |
| Mg3As2 | 0.037 | 36.0 | 0.012 | 19.8 | 0.014 | 0.33 | 0.007 | 0.25 |
| CaMg2As2 | 0.019 | 27.1 | 0.062 | 5.7 | 0.011 | 0.32 | 0.035 | 0.07 |
| CaZn2As2 | 0.083 | 24.2 | 0.008 | 3.7 | 0.006 | 0.27 | 0.008 | 0.05 |
| CaCd2As2 | 0.097 | 15.4 | 0.049 | 5.9 | 0.063 | 0.07 | 0.039 | 0.06 |
| ZnMg2As2 | 0.099 | 16.2 | 0.006 | 13.8 | 0.005 | 0.18 | 0.004 | 0.18 |
| SrMg2As2 | 0.015 | 22.4 | 0.031 | 4.6 | 0.008 | 0.27 | 0.018 | 0.06 |
| SrZn2As2 | 0.015 | 34.1 | 0.010 | 3.7 | 0.009 | 0.37 | 0.010 | 0.05 |
| SrCd2As2 | 0.097 | 9.9 | 0.097 | 3.3 | 0.003 | 0.13 | 0.013 | 0.04 |
| BaMg2As2 | 0.019 | 20.5 | 0.012 | 3.7 | 0.011 | 0.25 | 0.011 | 0.05 |
| BaCd2As2 | 0.098 | 13.6 | 0.084 | 3.4 | 0.002 | 0.11 | 0.076 | 0.04 |
| Mg3Sb2 | 0.056 | 27.7 | 0.011 | 14.2 | 0.008 | 0.22 | 0.006 | 0.18 |
| CaMg2Sb2 | 0.021 | 22.2 | 0.013 | 3.5 | 0.009 | 0.26 | 0.011 | 0.05 |
| SrMg2Sb2 | 0.018 | 21.7 | 0.018 | 3.8 | 0.009 | 0.26 | 0.014 | 0.05 |
| BaMg2Sb2 | 0.024 | 23.0 | 0.014 | 3.1 | 0.012 | 0.27 | 0.012 | 0.05 |
| CaZn2Sb2 | 0.014 | 26.8 | 0.012 | 4.4 | 0.006 | 0.31 | 0.009 | 0.06 |
| SrZn2Sb2 | 0.049 | 12.7 | 0.030 | 3.9 | 0.002 | 0.14 | 0.028 | 0.05 |
| CaCd2Sb2 | 0.017 | 21.7 | 0.031 | 4.9 | 0.009 | 0.23 | 0.026 | 0.07 |
| SrCdSb22 | 0.003 | 9.6 | 0.072 | 3.7 | 0.002 | 0.13 | 0.066 | 0.05 |
| BaCd2Sb2 | 0.002 | 10.1 | 0.099 | 3.0 | 0.002 | 0.14 | 0.095 | 0.04 |
References
- [1] A. I. Hochbaum, R. Chen, R. D. Delgado, W. Liang, E. C. Garnett, M. Najarian, A. Majumdar, and P. Yang, Nature (London) 451, 163 (2008).
- [2] A. I. Boukai, Y. Bunimovich, J. Tahir-Kheli, J. Yu, W. A. Guddard III, and J. R. Heath, Nature (London) 451, 168 (2008).
- [3] B. Poudel, Q. Hao, Y. Ma, Y. Lan, A. Minnich, B. Yu, X. Yan, D. Wang, A. Muto, D. Vashaee, X. Chen, J. Liu, M. S. Dresselhaus, G. Chen, and Z. Ren, Science 320, 634 (2008).
- [4] Y. Pei, X. Shi, A. LaLonde, H. Wang, L. Chen, and G. J. Snyder, Nature 473, 66 (2011).
- [5] K. Kuroki and R. Arita, J. Phys. Soc. Jpn. 76, 083707 (2007).
- [6] L. D. Hicks and M. S. Dresselhaus, Phys. Rev. B 47, 12727 (1993).
- [7] L.D.Hicks and M. S. Dresselhaus, Phys. Rev. B 47, 16631(R) (1993).
- [8] M. S. Dresselhaus, G. Chen, M. Y. Tang, R. G. Yang, H. Lee, D. Z. Wang, Z. F. Ren, J.‐P. Fleurial, and P. Gogna, Adv. Mater. 19, 1043 (2007)
- [9] Z. Liu, J. Mao, J. Sui, and Z. Ren, Energy Environ. Sci. 11, 23 (2018).
- [10] For a review, J. Shuai, J. Mao, S. Song, Q. Zhang, G. Chen, and Z. Ren, Mater. Today Phys. 1, 74 (2017).
- [11] S.R. Brown, S.M. Kauzlarich, F. Gascoin, and G.J. Snyder, Chem. Mater. 18, 1873 (2006).
- [12] S. Ohno, U. Aydemir, M. Amsler, J.-H. Pohls, S. Chanakian, A. Zevalkink, M.A. White, S.K. Bux, C. Wolverton, and G.J. Snyder, Adv. Funct. Mater. 321, 1606361 (2017).
- [13] X.-J. Wang, M.-B. Tang, H.-H. Chen, X.-X. Yang, J.-T. Zhao, U. Burkhardt, and Y. Grin, Appl. Phys. Lett. 94, 092106 (2009).
- [14] H. Tamaki, H.K. Sato, and T. Kanno, Adv. Mater 28, 10182 (2016).
- [15] H. Zhang, M. Baitinger, M.-B. Tang, Z.-Y. Man, H.-H. Chen, X.-X. Yang, Y. Liu, L. Chen, Y. Grin, and J.-T. Zhao, Dalton Trans. 39, 1101 (2010).
- [16] K. Guo, Q.-G. Cao, X.-J. Feng, M.-B. Tang, H.-H. Chen, X. Guo, L. Chen, Y. Grin, and J.- T. Zhao, Eur. J. Inorg. Chem. 2011, 4043 (2011).
- [17] J. Shuai, Z. Liu, H.S. Kim, Y. Wang, J. Mao, R. He, J. Sui, and Z. Ren, J. Mater. Chem. A 4, 4312 (2016).
- [18] J. Shuai, H. Geng, Y. Lan, Z. Zhu, C. Wang, Z. Liu, J. Bao, C.-W. Chu, J. Sui, and Z. Ren, Proc. Natl. Acad. Sci. U. S. A. 113, E4125 (2016).
- [19] J. Zhang, L. Song, S.H. Pedersen, H. Yin, Le Thanh Hung, and B.B. Iversen, Nat. Commun. 8, 13901 (2017).
- [20] J. Zhang, L. Song, G. K. H. Madsen, K. F. F. Fischer, W. Zhang, X. Shi, and B. B. Iversen, Nat. Commun. 7, 10892 (2016).
- [21] J. Zhang and B. B. Iversen, J. Appl. Phys 126, 85104 (2019).
- [22] E.S. Toberer, A. F. May, B. C. Melot, E. Flage-Larsen, and G. J. Snyder, Dalton Trans. 39, 1046 (2010).
- [23] J. Tani, M. Takahashi, and H. Kido, Phys. B 405, 4219 (2010).
- [24] D. J. Singh and D. Parker, J. Appl. Phys. 114, 143703 (2013).
- [25] G. S. Pomrehn, A. Zevalkink, W. G. Zeierm, A. van de Walle, and G. J. Snyder, Angew. Chem. Int. Ed. 53, 3422 (2014).
- [26] J. Sun and D. J. Singh, J. Mater. Chem. A 5, 8499 (2017).
- [27] J. Zhang, L. Song, M. Sist, K. Tolborg, and B. B. Iversen, Nat. Commun. 9, 4716 (2018).
- [28] W. Peng, S. Chanakian, and A. Zevalkink, Inorg. Chem. Front. 5, 1744 (2018).
- [29] K Kihou, H Nishiate, A Yamamoto, and C. H. Lee, Inorg. Chem. 56, 3709 (2017).
- [30] H. Kunioka, K. Kihou, H. Nishiate, A. Yamamoto, H. Usui, K. Kuroki, and C. H. Lee, Dalt. Trans. 47, 16205 (2018).
- [31] H. Kunioka, K. Kihou, D. Kato, H. Usui, T. Iida, H. Nishiate, K. Kuroki, A. Yamamoto, and C. H. Lee, Inorg. Chem. 59, 5828 (2020).
- [32] T. Belfarh, M. Batouche, T. Seddik, G. Uur, S. Bin Omran, A. Bouhemadou, Sandeep, X. Wang, X.-W. Sun, and R. Khenata, Physica B 538, 35 (2018).
- [33] G. Kresse and D. Joubert, Phys. Rev. B 59, 1758 (1999).
- [34] G. Kresse and J. Hafner, Phys. Rev. B 47, 558(R) (1993).
- [35] G. Kresse and J. Hafner, Phys. Rev. B 49, 14251 (1994).
- [36] G. Kresse and J. Furthmüller, Comput. Mater. Sci. 6, 15 (1996).
- [37] G. Kresse and J. Furthmüller, Phys. Rev. B 54, 11169 (1996).
- [38] J. P. Perdew, A. Ruzsinszky, G. I. Csonka, O. A. Vydrov, G. E. Scuseria, L. A. Constantin, X. Zhou, and K. Burke, Phys. Rev. Lett. 100, 136406 (2008).
- [39] P. Blaha, K. Schwarz, G. K. H. Madsen, D. Kvasnicka, J. Luitz, R. Laskowski, F. Tran and L. D. Marks, WIEN2k, An Augmented Plane Wave + Local Orbitals Program for Calculating Crystal Properties (Karlheinz Schwarz, Techn. Universität Wien, Austria), 2018. ISBN 3-9501031-1-2.
- [40] P. Blaha, K. Schwarz, F. Tran, R. Laskowski, G. K. H. Madsen and L. D. Marks, J. Chem. Phys. 152, 074101 (2020).
- [41] A. D. Becke and E. R. Johnson, J. Chem. Phys. 124, 221101 (2006).
- [42] F. Tran and P. Blaha, Phys. Rev. Lett. 102, 226401 (2009).
- [43] G. K. H. Madsen and D. J. Singh, Comput. Phys. Commun. 175, 67 (2006).
- [44] K. Momma and F. Izumi, J. Appl. Crystallogr. 44, 1272 (2011).
- [45] R. Juza and R. Kroebel, Z. Anorg. Allg. Chem. 331, 187 (1964).
- [46] At , we replace the term of the effective mass from to ( because of the symmetry of the band structure centered at the M point. Generally, the band structure having three- or six-fold symmetry cannot be reproduced within the effective mass approximation using and , but we used this approximation in this study because not and but and are important factors for in the 1-2-2 type Zintl phase compunds.
- [47] Even in the two-dimensional system, namely, in the case of the limit, the density of states and the average value of the group velocity are proportional to and , respectively, so that is determined by the ratio of to .
- [48] C. Yu, T. J. Zhu, S. N. Zhang, X. B. Zhao, J. He, Z. Su, and T. M. Tritt, J. Appl. Phys. 104, 013705 (2008).
- [49] H. Zhang, J.-T. Zhao, Y. Grin, X.-J. Wang, M.-B. Tang, Z.-Y. Man, H.-H. Chen, and X.-X. Yang, J. Chem. Phys. 129, 164713 (2008).
- [50] Q.-G. Cao, H. Zhang, M.-B. Tang, H.-H. Chen, X.-X. Yang, Y. Grin, and J.-T. Zhao, J. Appl. Phys. 107, 053714 (2010).